OPEN-SOURCE SCRIPT
Linear Regression Slope - Version 2
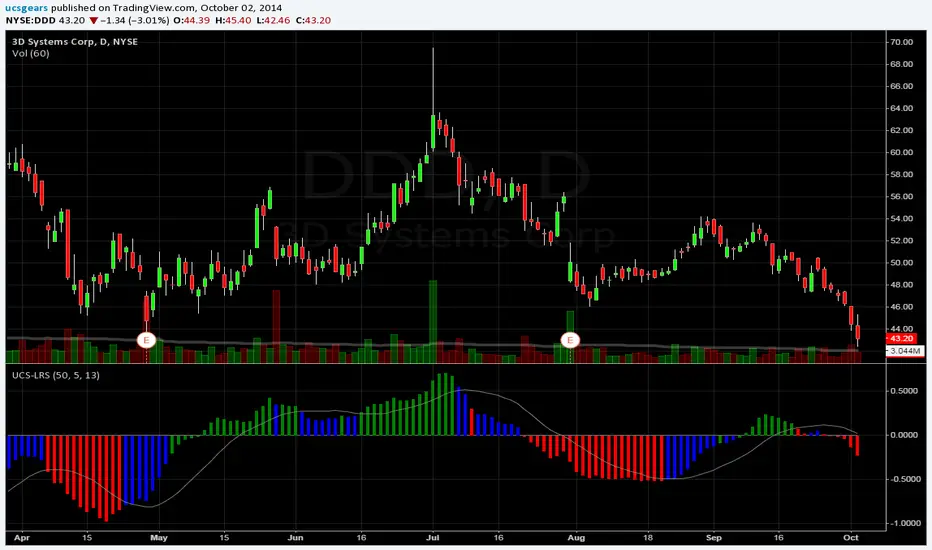
Version 2 - Linear Regression Slope. This version will have more freedom on picking your own length for all the Inputs.
One of the main reason I changed it is because, Slope calculation on transition period was not being computed properly. Because the Version 1, looks back the length assigned, and compute the slope based on two candle readings, could be 10 days apart or 50. That was misleading.
Therefore, I changed it to plot daily slope and Smooth it with an EMA.
Linear Regression Curve - tradingview.com/v/JojPxTRD/
List of All my Indicators - tradingview.com/p/stocks/?sort=recent&time=day&by=ucsgears
Açık kaynak kodlu komut dosyası
Gerçek TradingView ruhuna uygun olarak, bu komut dosyasının oluşturucusu bunu açık kaynaklı hale getirmiştir, böylece yatırımcılar betiğin işlevselliğini inceleyip doğrulayabilir. Yazara saygı! Ücretsiz olarak kullanabilirsiniz, ancak kodu yeniden yayınlamanın Site Kurallarımıza tabi olduğunu unutmayın.
Uday C Santhakumar
Feragatname
Bilgiler ve yayınlar, TradingView tarafından sağlanan veya onaylanan finansal, yatırım, işlem veya diğer türden tavsiye veya tavsiyeler anlamına gelmez ve teşkil etmez. Kullanım Şartları'nda daha fazlasını okuyun.