Liquidity Sweep Sniper AP StyleAP Capital – Liquidity Sweep Sniper (Fab-Style)
📌 Overview
This indicator is a precision scalping tool inspired by professional liquidity-based trading concepts often demonstrated by elite intraday scalpers.
The script focuses on liquidity sweeps followed by strong displacement, aiming to capture short, high-probability momentum moves — particularly effective on lower timeframes (1–5 min) during active market sessions.
It is not a signal spam tool. Signals appear only when multiple objective conditions align.
🧠 Core Concept
Markets do not move randomly — they seek liquidity before expanding.
This indicator identifies:
Buy-side / Sell-side liquidity
Liquidity sweeps (stop-hunts)
Strong displacement candles reclaiming price
Optional higher-timeframe trend alignment
Only when all conditions are met does a signal print.
🔍 What the Indicator Detects
1️⃣ Liquidity Pools
Equal highs or equal lows detected within a configurable lookback
Minimum number of touches required
ATR-based tolerance to adapt to volatility
These levels represent areas where stop orders are likely resting.
2️⃣ Liquidity Sweep
A valid sweep requires:
Price to wick beyond the liquidity level
Candle to close back inside the range
This indicates failed breakout / stop-hunt behaviour.
3️⃣ Displacement Confirmation
After the sweep, the candle must show:
Strong body (default >60% of candle range)
Candle range large relative to ATR
Clear directional intent (momentum)
This filters out weak reactions and chop.
4️⃣ Optional Trend Filter
EMA-based higher-timeframe bias
Helps align scalps with dominant direction
Can be enabled or disabled
📈 Signals
BUY: Sell-side liquidity sweep → bullish displacement
SELL: Buy-side liquidity sweep → bearish displacement
Signals are plotted directly on the chart and can be used with alerts.
⚙️ Recommended Usage
Markets: XAUUSD, indices, liquid FX pairs
Timeframes: 1m–5m
Sessions: London & New York (best performance)
Risk Management: Always required — this tool does not place trades
Best used as a confirmation tool, not standalone.
⚠️ Important Notes
This indicator is inspired by liquidity-based scalping concepts, not an exact replication of any individual trader’s private strategy.
No indicator predicts the future — this tool highlights high-probability scenarios, not guarantees.
Past performance is not indicative of future results.
Intraday

[ARTIO] TTG Levels Pro: The Grail (S.C.T.) TTG Levels Pro Professional Multi-Timeframe & Intraday Analysis Tool
This indicator is a comprehensive solution for analyzing Key Levels across multiple timeframes and tracking intraday structure. It automates the calculation of significant Support/Resistance zones and provides real-time Volume Weighted data.
How it works (Technical Methodology):
Multi-Timeframe Levels (HTF): The script uses request.security() to fetch High and Low pivot data from higher timeframes (1M, 1W, 1D, 4H, 1H). It identifies the most relevant "unbroken" range levels and projects them onto the current chart.
Intraday Structure (VWAP & Bisector):
VWAP (Volume Weighted Average Price): Calculated cumulatively from the start of the trading day. This represents the fair value based on volume distribution.
Daily Bisector (Midpoint): Calculates the 50% retracement level of the current daily range (High + Low) / 2. This updates dynamically with every tick as the daily range expands.
Visualization Engine:
History Mode: Users can toggle "Path" mode to see how the VWAP and Bisector levels evolved throughout the session (stepline visualization).
Clean Mode: Users can switch to a straight-line projection to keep the chart clean, focusing only on current values.
Features:
Monitor 6 Timeframes simultaneously.
Dynamic Alert System (Price Proximity & Trend Direction).
Synergy Detection: Alerts when multiple timeframe levels cluster together within a defined % range.
Customizable Dashboard Table.
Settings are fully customizable via the inputs menu.

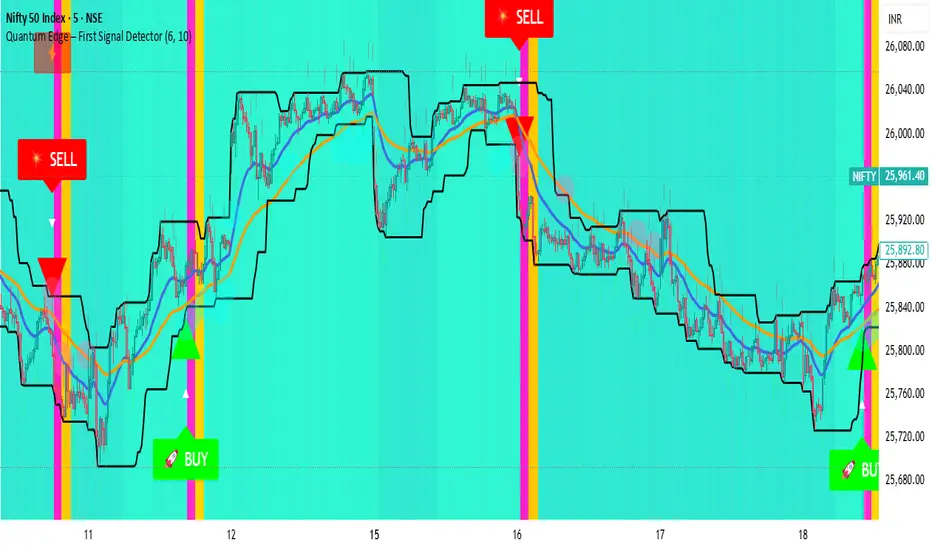
Quantum Edge First Signal DetectorQuantum Edge is a non-repainting, multi-confirmation indicator that detects the first high-probability BUY & SELL signals using momentum, trend, volume, volatility, and price-action voting logic.
🧠 About This Indicator
Quantum Edge – First Signal Detector is designed to solve one common trader problem:
too many late or repeated signals.
Instead of firing continuous entries, this indicator focuses only on the FIRST valid signal after a market shift — helping traders enter early, reduce noise, and avoid over-trading.
It uses a quantum-style voting engine where multiple independent market factors must align before a signal is confirmed.
⚙️ Core Logic (How It Works)
Each candle is evaluated using 6 independent factors:
RSI Momentum
Bullish when RSI > 50
Bearish when RSI < 40
Price Location
Price near recent highs or lows
Volume Expansion
Current volume above moving average
EMA Trend Direction
EMA 20 vs EMA 50
Candle Strength
Strong bullish or bearish candle bodies
Volatility Filter
ATR-based low volatility confirmation
Each factor gives 1 vote.
When minimum confirmations are met, a FIRST BUY or FIRST SELL signal is generated.
🚀 Key Features
✅ First-Signal-Only Logic
Only the first BUY or SELL after trend change
No repeated signals in the same direction
Built-in signal cooldown (user-controlled)
✅ Non-Repainting
Signals are confirmed on candle close
No future data, no repainting
✅ Smart Trend Filtering
EMA-based directional bias
Avoids weak counter-trend entries
✅ Advanced Visual System
Clear BUY / SELL triangles
Trend, volume & momentum backgrounds
Support & resistance zones
Market sentiment bar coloring
✅ Alert Support
Buy alert
Sell alert
📊 Best Timeframes
Scalping: 1m – 5m
Intraday: 5m – 15m
Swing Confirmation: 30m – 1H
Works on:
Forex
Crypto
Indices
Stocks
🎯 How to Trade (Simple Guide)
BUY Setup
✔ First BUY signal appears
✔ Trend is bullish
✔ Use nearby support as reference
SELL Setup
✔ First SELL signal appears
✔ Trend is bearish
✔ Use nearby resistance as reference
Always combine with risk management.
Disclaimer: This indicator is for educational purposes only and does not constitute financial advice. Trading involves risk. Use proper risk management.
New Rate - PREMIUM v2New Rate - PREMIUM v2
New Rate - PREMIUM v2 is an intraday Opening Range Breakout (ORB) strategy built around a strict one-trade-per-day execution model.
The strategy defines a price range using the first N candles of a user-defined session, freezes the High/Low at the close of candle N, and places OCO stop orders exactly at those levels. The first breakout fills, the opposite order is canceled, and no further trades are allowed until the next trading day.
This script is published for educational and research purposes, with documented mechanics and backtest settings to support transparency and reproducibility.
How the strategy works
Session range construction
The user selects a minutes-based timeframe, a session start time, and the number of candles N. During the session window, the strategy tracks the highest High and lowest Low formed by the first N candles. These candles are visually highlighted on the chart.
Range freeze
When candle N closes, the range is locked. Horizontal High/Low lines are drawn and extended forward. An optional 50% midpoint can be displayed for reference.
OCO breakout execution
Immediately after the range is frozen, the strategy places:
A buy stop at the frozen High
A sell stop at the frozen Low
Orders are linked using OCO (One-Cancels-Other) logic. When one side fills, the opposite order is automatically canceled.
Exit management
Two exit frameworks are available:
Tick-based exits: stop-loss and take-profit are fixed distances in ticks from entry.
Risk/Reward exits: optional stop at the opposite side of the range, with TP calculated as RR × risk.
Both modes can display SL/TP boxes projected forward for visual review.
Daily execution lock
After the first filled trade of the day, the strategy blocks any new entries until the next daily reset. This enforces strict discipline and prevents over-trading.
Visual features
Configurable High/Low lines and labels (color, style, width, alignment)
Optional midpoint (50%) line
Session background highlight with adjustable opacity
Optional SL/TP boxes with configurable colors, borders, and projection length
Weekday filter (trade only selected days)
Settings used for the published backtest (replication)
The performance screenshots included with this publication were generated using the following configuration:
Market & chart
Symbol: FX:XAUUSD
Timeframe: 15 minutes
Session & range
Session start: as configured on chart (exchange time)
Range candles (N): 1
Auto range end: enabled (TF × N)
Line extension: 20 bars
Exits
Exit mode: SL/TP by ticks
Stop-loss: 1500 ticks
Take-profit: 2000 ticks
Weekdays
Monday to Friday enabled
Strategy Properties (TradingView settings)
Initial capital: 1,000 USD
Commission: 0.1 (as set in Strategy Properties)
Slippage: 1 tick
Users should adjust commission, slippage, and position sizing to match their own broker and execution conditions.
Backtest context and limitations
This strategy uses stop orders that may fill intrabar depending on TradingView’s execution model.
Results vary by symbol, timeframe, session selection, and trading costs.
Past performance does not guarantee future results.
This script is not financial advice.
Originality and usefulness
While opening-range breakouts are a known concept, this strategy’s implementation focuses on:
Exact range-freeze timing: orders are armed precisely at the close of the N-th candle.
True OCO + hard daily lock: one-and-done execution enforced at the engine level.
Dual exit framework: fixed-tick and RR exits analyzed with the same SL/TP visual logic.
Operational safeguards: weekday filters and drawing limits designed for stable long-term backtesting.

Session Volume Profile - Asia London NYSession Volume Profile – Asia, London, NY
Description
OVERVIEW
Session Volume Profile is a technical analysis indicator designed to visualize how volume is distributed during the three primary global trading sessions: Asia, London, and New York. The script separates intraday volume data into time-defined sessions to help traders observe where trading activity concentrated and how value areas evolve as liquidity transitions between regions.
This indicator is intended for market structure and contextual analysis, not signal generation.
TECHNICAL OUTPUT
For each enabled session, the indicator calculates and displays:
Point of Control (POC)
The price level with the highest traded volume during the session.
Value Area High / Low (VAH / VAL)
The price range containing a user-defined percentage of total session volume (commonly 70%).
Session Volume Histogram
A horizontal volume-at-price visualization showing relative participation across price levels, highlighting high- and low-volume areas.
CALCULATION FRAMEWORK
Session Segmentation
Sessions are identified using exchange-based time boundaries. Each session is processed independently to prevent overlap and ensure clean separation of volume data.
Volume Binning
Intraday volume is allocated into discrete price buckets using an array-based structure. The resolution of these buckets is controlled by the Histogram Density input.
Value Area Expansion
The script identifies the session’s POC and expands outward in both directions until the selected percentage of total volume is reached, defining the Value Area High and Low.
HOW TO USE
Session Context
Observe how price reacts to prior-session POC and value areas when a new session begins.
Customization Controls
Individual sessions can be enabled or disabled, and visual opacity can be adjusted to maintain clarity on lower timeframes.
Session Awareness
An optional countdown timer displays remaining session time to help traders stay aware of upcoming liquidity transitions.
DESIGN NOTES
This indicator visualizes historical volume distribution only. It does not identify specific participants or predict future price behavior. All calculations are derived exclusively from price and volume data available on the chart.
DISCLAIMER
This script is provided for educational and analytical purposes only. It does not generate trade signals, alerts, or financial advice. Historical volume distributions do not guarantee future market behavior.

Trading Volatility Clock⏰ TRADING VOLATILITY CLOCK - Know When the Action Happens (Anywhere in the World)
A real-time session tracker with multi-timezone support for active traders who need to know when US market volatility strikes - no matter where they are in the world. Perfect for day traders, scalpers, and anyone trading liquid US markets.
══════════════════════════════════════════════════════
📊 WHAT IT DOES
This indicator displays a live clock showing:
- Current time in YOUR selected timezone (10 major timezones supported)
- Active US market session with color-coded volatility levels
- Countdown timer showing time remaining in current session
- Preview of the next upcoming session
- Optional alerts when entering high-volatility periods
══════════════════════════════════════════════════════
🌍 MULTI-TIMEZONE SUPPORT
SESSIONS ALWAYS TRACK US MARKET HOURS (Eastern Time):
No matter which timezone you select, the sessions always trigger at the correct US market times. Perfect for international traders who want to:
• See their local time while tracking US market sessions
• Know exactly when US volatility hits in their timezone
• Plan their trading day around US market hours
SUPPORTED TIMEZONES:
• America/New_York (ET) - Eastern Time
• America/Chicago (CT) - Central Time
• America/Los_Angeles (PT) - Pacific Time
• Europe/London (GMT) - Greenwich Mean Time
• Europe/Berlin (CET) - Central European Time
• Asia/Tokyo (JST) - Japan Standard Time
• Asia/Shanghai (CST) - China Standard Time
• Asia/Hong_Kong (HKT) - Hong Kong Time
• Australia/Sydney (AEDT) - Australian Eastern Time
• UTC - Coordinated Universal Time
EXAMPLE: A trader in Tokyo selects "Asia/Tokyo"
• Clock shows: 11:30 PM JST
• Session shows: "Opening Drive" 🔥 HIGH
• They know: US market just opened (9:30 AM ET in New York)
══════════════════════════════════════════════════════
🎯 WHY IT'S USEFUL
Whether you trade futures, high-volume stocks, or ETFs, volatility isn't constant throughout the day. Knowing WHEN to expect movement is critical:
🔥 HIGH VOLATILITY (Red):
• Opening Drive (9:30-10:30 AM ET) - Highest volume of the day
• Power Hour (3:00-4:00 PM ET) - Second-highest volume, final push
⚡ MEDIUM VOLATILITY (Yellow):
• Pre-Market (8:00-9:30 AM ET) - Building momentum
• Lunch Return (1:00-2:00 PM ET) - Traders returning
• Afternoon Session (2:00-3:00 PM ET) - Trend continuation
• After Hours (4:00-5:00 PM ET) - News reactions
💤 LOW VOLATILITY (Gray):
• Overnight Grind (12:00-8:00 AM ET) - Thin volume
• Mid-Morning Chop (10:30-11:30 AM ET) - Ranges form
• Lunch Hour (11:30 AM-1:00 PM ET) - Dead zone
• Evening Fade (5:00-8:00 PM ET) - Volume dropping
══════════════════════════════════════════════════════
⚙️ CUSTOMIZATION OPTIONS
TIMEZONE SETTINGS:
• Select from 10 major timezones worldwide
• Clock automatically displays in your local time
• Sessions remain locked to US market hours
SESSION TIME CUSTOMIZATION:
• Every session boundary is adjustable (in minutes from midnight ET)
• Perfect for traders who define sessions differently
• Advanced users can create custom volatility schedules
DISPLAY OPTIONS:
• Toggle next session preview on/off
• Enable/disable high volatility alerts
• Clean, unobtrusive table display in top-right corner
══════════════════════════════════════════════════════
💡 HOW TO USE
1. Add indicator to any chart (works on all timeframes)
2. Select your timezone in Settings → Timezone Settings
3. Set your chart to 1-minute timeframe for real-time updates
4. Customize session times if needed (Settings → Session Time Customization)
5. Watch the top-right corner for live session tracking
TRADING APPLICATIONS:
• Avoid trading during dead zones (lunch hour, mid-morning chop)
• Increase position size during high volatility windows
• Set alerts for Opening Drive and Power Hour
• Plan your trading day around US market volatility schedule
• International traders can track US sessions in their local time
══════════════════════════════════════════════════════
🎓 EDUCATIONAL VALUE
This indicator teaches traders:
• Market microstructure and volume patterns
• Why certain times produce better opportunities
• How institutional flows create intraday patterns
• The importance of timing in active trading
• How to adapt US market trading to any timezone
══════════════════════════════════════════════════════
⚠️ IMPORTANT NOTES
- Works best on 1-minute charts for frequent updates
- Sessions are ALWAYS based on US Eastern Time (ET)
- Timezone selection only changes the clock display
- Clock updates when new bar closes (not tick-by-tick)
- Alerts trigger once per bar when enabled
- Perfect for international traders tracking US markets
══════════════════════════════════════════════════════
📈 BEST USED WITH
- High-volume US stocks: TSLA, NVDA, AAPL, AMD, META
- Major US ETFs: SPY, QQQ, IWM, DIA
- US Futures: ES, NQ, RTY, YM, MES, MNQ
- Any liquid US instrument with clear intraday volume patterns
══════════════════════════════════════════════════════
🌏 FOR INTERNATIONAL TRADERS
This tool is specifically designed for traders outside the US who need to:
• Track US market sessions in their local timezone
• Know when to be at their desk for US volatility
• Avoid waking up for low-volatility periods
• Maximize trading efficiency around US market hours
No more timezone confusion. No more missing the opening bell. Just set your timezone and trade with confidence.
══════════════════════════════════════════════════════
This is an open-source educational tool. Feel free to modify and adapt to your trading style!
Happy Trading! 🚀

Microstructure Participation & Acceptance Indicator📊 Microstructure Participation & Acceptance Indicator
An advanced participation-based filter combining VWAP distance analysis, volume delta detection, and real-time acceptance/rejection state identification—designed for smaller timeframe trading.
📊 FEATURES
VWAP Distance Normalization
Context-aware fair value measurement:
Automatically resets based on selected anchor (Session/Week/Month)
ATR-normalized distance calculation for universal application
Identifies when price is extended or compressed relative to equilibrium
Configurable extreme distance threshold (default: 1.5 ATR)
Adjustable source input (default: HLC3)
Volume Delta Proxy
Bull vs Bear participation tracking:
Calculates volume imbalance between bullish and bearish candles
EMA smoothing for cleaner signal generation (default: 9 periods)
Delta ratio measurement to identify dominant side
Expansion/compression detection to gauge momentum commitment
Configurable expansion threshold (default: 1.3x)
Acceptance/Rejection State Machine
Real-time market regime identification with six distinct states:
🟢 Accepted Long
Price moving away from VWAP with expanding bullish delta
Distance from VWAP increasing
Volume confirming the move
Indicates real buying pressure—trade WITH the move
🟢 Accepted Short
Price moving away from VWAP with expanding bearish delta
Distance from VWAP increasing
Volume confirming the move
Indicates real selling pressure—trade WITH the move
🟠 Fade Long
Price extended beyond threshold (>1.5 ATR above VWAP)
Delta not supporting the extension
Volume participation absent or diminishing
Potential mean-reversion short setup
🟠 Fade Short
Price extended beyond threshold (>1.5 ATR below VWAP)
Delta not supporting the extension
Volume participation absent or diminishing
Potential mean-reversion long setup
⚪ Chop
Price compressed near VWAP
Bollinger Bands tight (width compressed)
Delta neutral—no clear commitment
NO TRADE ZONE—wait for expansion
⚪ Neutral
Transitional state between regimes
Momentum shifting but not yet confirmed
Monitor for next acceptance signal
Bollinger Bands
Standard volatility measurement with TradingView default styling:
Adjustable period length (default: 20)
Configurable standard deviation multiplier (default: 2.0)
Visual fill between bands for volatility context
Used internally for chop/compression detection
Live Dashboard
Real-time metrics display (top-right corner):
Current market state with color coding
VWAP distance in ATR units
Delta ratio (bull/bear volume balance)
Delta state (Expanding/Compressing)
High-contrast design for instant readability
🎯 HOW TO USE
For Trend Trading:
Accepted Long/Short backgrounds indicate confirmed participation—stay with the trend
Strong moves typically travel 1-1.5 ATR from VWAP with delta support
Use VWAP as dynamic support/resistance
Combine with momentum indicators (MACD, RSI) for confluence
Price above VWAP + Accepted Long state = bullish bias
Price below VWAP + Accepted Short state = bearish bias
For Mean Reversion:
Fade Long/Short states signal overextension without participation
Price beyond 1.5 ATR from VWAP with weak delta = potential reversal
Look for price return to VWAP when extended
Bollinger Band extremes + Fade state = high-probability mean reversion setup
VWAP acts as mean reversion anchor during range-bound sessions
For Risk Management:
Chop state = avoid new entries
Bollinger Band compression + Chop = pre-expansion zone (wait for breakout)
Delta compression after strong move = early exhaustion warning
State transitions (Accepted → Neutral → Fade) = tighten stops
Signal Confirmation:
Strongest setups occur when multiple factors align:
BB breakout + Accepted state + price above/below VWAP
Price rejection at BB bands + Fade state
VWAP support/resistance hold + state transition
Delta expansion + distance increasing + trend direction
⚙️ SETTINGS
All components are fully customizable through organized input groups:
VWAP Distance Group:
VWAP source (default: HLC3)
Anchor period (Session/Week/Month)
ATR length for normalization (default: 14)
Extreme distance threshold in ATR multiples (default: 1.5)
Volume Delta Group:
Delta EMA length (default: 9)
Delta expansion threshold (default: 1.3)
Acceptance Logic Group:
Acceptance lookback period (default: 5)
Chop threshold in VWAP/ATR units (default: 0.3)
Bollinger Bands Group:
BB length (default: 20)
Standard deviation multiplier (default: 2.0)
Display Group:
Toggle state backgrounds
Toggle state change labels
Toggle VWAP line
Toggle Bollinger Bands
💡 EDUCATIONAL VALUE
This indicator teaches important concepts:
How institutional money identifies fair value (VWAP)
The difference between price movement and market acceptance
Why volume participation matters more than price action alone
How to distinguish between noise and committed directional moves
The relationship between volatility compression and expansion cycles
Why distance from equilibrium predicts mean reversion probability
⚠️ IMPORTANT NOTES
This indicator is for educational and informational purposes only
This is a filter, not a standalone trading system
No indicator is perfect—always use proper risk management
Past performance does not guarantee future results
Combine with your own analysis and risk tolerance
Test thoroughly on historical data before live trading
This is not financial advice—use at your own risk
🔧 TECHNICAL DETAILS
Pine Script Version 6
Overlay indicator (displays on price chart)
All calculations use standard, well-documented formulas
No repainting—all signals are confirmed on bar close
Compatible with all timeframes and instruments
Optimized for smaller timeframes (1-5 minute charts)
Minimal computational overhead
📝 CHANGELOG
Version 1.0
Initial release
VWAP distance normalization with ATR scaling
Volume delta proxy system (bull/bear EMA)
6-state acceptance/rejection state machine
Bollinger Bands integration
Real-time dashboard with live metrics
State change labels and background coloring
Full customization options
Developed for traders who need objective participation filters to distinguish high-probability setups from low-quality noise—without cluttering their charts with multiple indicator panels.

Market Session Terrain Monitor v1.0Summary
Market Session Terrain Monitor helps traders understand where the market is within its normal intraday behavior, not where it should go. It is a decision-support tool designed to reduce late entries, over-trading, and narrative bias by grounding intraday analysis in historical session statistics.
Purpose
Market Session Terrain Monitor provides statistical context for intraday market movement by analyzing how much each major trading session typically moves, how much it has moved so far, and what market state the current session inherits from previous sessions.
The indicator is designed to answer one core question:
Is the current session early, normal, or already expanded relative to its historical behavior?
This indicator does not predict direction and does not generate buy or sell signals. It is intended as a context and state-awareness tool to support independent, structure-based decision making.
Sessions Analyzed
The trading day is divided into three independent sessions, defined in UTC time:
• Asia
• London
• New York
Each session is analyzed separately using its own historical data. No session is assumed to control or predict the behavior of another.
Session Range
For each session, the indicator measures the session range, defined as the session high minus the session low. This captures how much the market actually moved during that session, regardless of direction.
P90 Expansion Benchmark
For each session, the indicator calculates a P90 expansion benchmark.
• P90 represents the range that only about ten percent of historical sessions exceed
• It reflects a large but repeatable expansion, not an extreme outlier
• It is used as a normalization reference so sessions with different volatility characteristics can be compared on equal terms
The P90 values are displayed in the table header in price units, such as USD, as a reference for scale.
Percent of P90
Current and previous session ranges are expressed as a percentage of that session’s own P90.
This shows:
• How much of a statistically large session has already been used
• Whether the session is still early, behaving normally, or approaching expansion
Rolling Comparative Table
The table displays three rows, ordered by time and anchored to the current active session:
• Current · Session
• Previous · Session
• Previous-2 · Session
Each row shows:
• Session name
• Session range in price units
• Session range as a percentage of that session’s P90
This rolling layout provides context about the market state inherited by the current session without implying causality.
How to Use the Indicator
The indicator helps with:
• Identifying whether a session is early or late in its statistical range
• Avoiding entries when a session is already stretched
• Recognizing compression versus expansion regimes
• Understanding the market state the current session inherits
The indicator does not:
• Predict direction
• Forecast highs or lows
• Assume that one session determines the next
Directional decisions should come from price structure, execution rules, and risk management.
Design Philosophy
• Range first, direction second
• State awareness over narrative
• Statistical normalization instead of absolute numbers
• Comparative, not predictive
The indicator intentionally avoids estimating remaining range or subtracting previous session movement, as those approaches introduce bias and false causality.
Suitable Markets
• Gold and silver
• Forex pairs
• Indices
• Other liquid instruments with clear session behavior

Smart MA Zone Crossover [HMA-EMA]Smart MA Zone Crossover is a trend-following indicator designed to capture early momentum shifts using the crossover between Hull Moving Average (HMA) and Exponential Moving Average (EMA).
The indicator visually highlights trend direction using a dynamic colored zone, making it easy to identify bullish and bearish market phases at a glance.
🔸 Step 1: Moving Average Calculation
HMA (Hull Moving Average) → Faster, smoother, reacts quickly to price
EMA (Exponential Moving Average) → Stable trend reference
Both MA lengths are **fully adjustable** from the settings panel.
🔸 Step 2: Trend Detection
Bullish Trend: HMA is above EMA
Bearish Trend: HMA is below EMA
The area between the two averages is filled with color to visually represent the current trend state.
Step 3: Signal Generation (Non-Repainting)
Signals are generated **only on confirmed crossovers**:
✅ BUY Signal- HMA crosses above EMA
❌ SELL Signal-HMA crosses belowEMA
Signals do **not repaint** and appear only once per crossover.
🔸 Step 4: Visual Customization
Users can enable or disable:
* Moving average lines
* Colored MA zone fill
* Buy/Sell arrows
* Buy/Sell text labels
This allows the indicator to remain **minimal or detailed**, depending on user preference.
🔹 Key Features
✔ Non-repainting logic
✔ Clean crossover-based signals
✔ Customizable HMA & EMA lengths
✔ Optional MA zone fill
✔ Buy/Sell arrows & labels
✔ Works on all timeframes
✔ Beginner-friendly & scalper-ready
🔹 Best Use Cases
* Trend confirmation
* Momentum trading
* Scalping & intraday trading
* Swing trend filtering
For best results, combine with:
* Support & resistance
* Volume
* Higher-timeframe trend
🔹 Disclaimer
This indicator is provided for **educational purposes only**.
It is **not financial advice**. Always backtest and use proper risk management before trading live markets.

Liquidity Levels Pro Tool - thewallranka
Liquidity Levels Pro Tool is a market-structure and liquidity-mapping indicator designed to help discretionary futures and index traders identify statistically relevant price levels where reactions, continuations, or liquidity sweeps are more likely to occur.
This script is a decision-support tool, not a signal generator. It does not issue buy/sell alerts or predict future price movement. Instead, it organizes and scores liquidity information so traders can make their own contextual decisions.
What this indicator does
The script continuously detects and maintains liquidity zones derived from price pivots, then evaluates those zones using multiple structural and contextual factors:
Repeated price interaction (touches)
Freshness (time since last interaction)
Confluence with key reference levels
Reaction behavior after contact
Session relevance (RTH vs overnight)
Market regime (trend vs mean reversion)
Time-of-day effects (open, midday, power hour)
Only the most relevant zones—based on a dynamic scoring system—are displayed to reduce chart clutter and focus attention on levels that have historically mattered.
Core components
1. Liquidity Zones
Zones are built from pivot highs and lows and expanded into areas using a configurable tick-based padding. Nearby zones are merged to avoid redundancy.
Each zone is continuously evaluated and assigned a score (0–100) reflecting its relative importance.
2. Zone Scoring (No Lookahead)
Zone scores are based on:
Number of confirmed interactions
Recency of the last touch
Confluence with prior day/week levels, VWAP, and Opening Range
Reaction quality after touches (speed and follow-through)
Session alignment (zones that “work” in the current session are favored)
Penalties after liquidity sweeps
Zones are not forward-looking and do not rely on future data.
3. Context Engine
The script classifies the current environment using VWAP slope and distance:
Trend (up or down)
Mean reversion
Mixed/transition
Time-of-day context (Open, Midday, Power Hour) is also tracked internally and influences zone scoring.
This context is displayed in the HUD to support situational awareness, not automated decisions.
4. Liquidity Sweeps
Optional sweep detection highlights situations where price trades beyond a zone and closes back inside, indicating potential stop runs or failed breakouts.
Sweeps are rate-limited and applied conservatively to avoid visual noise.
5. Trade Planning Levels (Optional)
When enabled, the script highlights the nearest high-quality liquidity level above and below price based on score thresholds.
These are intended as reference targets, not trade entries or exits.
HUD (Heads-Up Display)
The on-chart HUD summarizes:
Key reference levels (prior day/week, Opening Range)
Nearest strong liquidity above/below price
Market regime and time-of-day context
Distance to levels (ticks or points)
The HUD is fully optional, positionable, and includes resizable modes (Small / Medium / Large) to fit different chart layouts.
How to use this tool
This indicator is best used as part of a discretionary trading process, for example:
Identifying areas where price is more likely to react or pause
Framing trades around higher-quality structure instead of arbitrary levels
Filtering setups based on session and regime context
Managing expectations near known liquidity rather than chasing price
It is intentionally designed not to provide trade signals.
Limitations and important notes
This script does not predict outcomes or guarantee reactions
High-scoring zones can still fail
Liquidity behavior is context-dependent and probabilistic
No performance claims or backtested results are provided
The indicator should not be used in isolation
Past behavior does not imply future results.
Chart and usage notes
The script is intended for standard time-based charts
Recommended for liquid futures and index products
Use a clean chart for clarity when publishing or sharing
No external indicators are required
Final note
Liquidity Levels Pro (Tool) — v6 is designed to organize complex market structure into a clear, readable framework, allowing traders to focus on execution and risk management rather than raw level detection.
This script reflects an analytical approach to intraday liquidity and structure, not an automated trading system.

Session Volume Profile Sniffer: HVN & Rejection ZonesA simple tool built for traders who rely on intraday volume structure.
What this script does
This script tracks volume distribution inside a selected session and highlights two key price levels:
High Volume Nodes (HVNs) — areas where price spent time building heavy participation.
Low Volume Nodes (LVNs) — thin zones where price moved quickly with very little interest.
Instead of plotting a full profile, this tool gives you the exact rejection-level lines you usually hunt manually.
Why these levels matter
HVN → price tends to react, stall, or flip direction
LVN → price often rejects strongly since liquidity is thin
Rejection patterns around these areas give clean entry signals
Positioning trades around HVN/LVN helps filter noise in choppy sessions
This script removes the trouble of drawing profiles, counting bins, or guessing node levels. Everything is calculated inside the session you choose.
How the detection works
Inside your session window, the script:
1. Tracks each tick-based price bucket
2. Accumulates raw volume for every bucket
Identifies:
HVNs = buckets with volume above a tier
LVNs = buckets with volume below a tier
3. Prints each level as a single clean line
4. Generates:
Long signal → bounce from LVN
Short signal → rejection from HVN
Built-in exits use ATR-based conditions for quick testing.
Features
Session-based volume mapping
HVN + LVN levels drawn automatically
Entry triggers based on rejection
ATR exits for experimental backtests
Clean, minimal visual output
Best use cases
Intraday futures
Index scalping
FX sessions (London / NY)
Crypto sessions (user-timed)
Anyone who trades around volume structure
Adjustable settings
Session window
Volume bin size
HVN multiplier
LVN multiplier
Enable/disable zone lines
This keeps it flexible enough for both scalpers and slow-paced intraday setups.
Important note
This script is built for study + idea testing.
It is not intended as a final system.
Once you identify how price behaves around these nodes, you can blend this tool into your own setup.

Volatility High/Low Projection (PHOD / PLOD)AP Capital – Volatility + High/Low Projection
This indicator is designed to identify high-probability intraday turning points by combining daily range statistics, session behaviour, and volatility context into a single clean framework.
It is built for index, forex, and metals traders who want structure, not noise.
🔹 Core Features
1️⃣ Potential High of Day (PHOD) & Potential Low of Day (PLOD)
The indicator highlights likely intraday extremes based on:
Session timing (Asia, London, New York)
Current day volatility vs historical averages
Prior day expansion or compression behaviour
Each level is displayed with:
A clear label (PHOD / PLOD)
A forward-extending box acting as a live Point of Interest (POI)
Automatic invalidation when price breaks the zone
2️⃣ Volatility & Range Context (Info Panel)
A compact information panel in the top-right corner provides real-time context without cluttering the chart:
20-Day Average Range
% of the average range already used today
Range status (NORMAL / EXHAUSTED)
Average session ranges for:
Asia
London
New York
This allows traders to immediately assess whether price is:
Early in the day with room to trend
Statistically stretched and prone to reversal
Over-extended where breakout chasing is risky
3️⃣ Session-Aware Logic
The model respects how markets behave across the trading day:
Asia favours accumulation and potential lows
London provides expansion
New York often delivers distribution or exhaustion
This prevents random high/low marking and focuses only on structurally meaningful levels.
🧠 How to Use
Use PHOD / PLOD boxes as reaction zones, not blind entries
Combine with your own confirmation (structure break, momentum, volume, EMA reclaim, etc.)
Avoid chasing trades when the Range Status = EXHAUSTED
Particularly effective on 15m – 1h timeframes
⚠️ Important Notes
This indicator does not repaint
It is contextual, not a buy/sell signal generator
Best used as part of a complete trading plan
📈 Suitable Markets
XAUUSD (Gold)
Indices (NASDAQ, S&P 500, DAX)
Major FX pairs
📌 Disclaimer
This indicator is for educational and analytical purposes only.
It does not constitute financial advice. Trading involves risk.

SMC Sessions NYThis script plots vertical session markers on the chart to highlight session opens and closes based on New York time.
Key characteristics:
The indicator is plotted on the price chart (overlay).
It draws thin, dotted vertical lines at specific session times.
Sessions are calculated using the America/New_York timezone to ensure correct alignment.
Only weekdays (Monday to Friday) are considered.
The script draws sessions for today and up to one week back (maximum 7 calendar days).
All drawings are created once on the last bar to avoid duplicates and performance issues.
Each session has its own color for clear visual distinction:
Asia session (open)
London session (open and close)
New York / Kill Zone Morning (open and close)
Lunch session (open and close)
New York / Kill Zone Afternoon (open and close)
The Asia session open at 20:00 NY is intentionally excluded on Fridays, as there is no valid Asia session start on Friday evening.
The vertical lines extend across the entire visible price range of the chart.
The script is optimized to stay well within TradingView object limits.
Purpose:
The indicator is designed to give traders a clean, non-intrusive visual reference for key session transitions, helping to analyze price behavior around session opens and closes without cluttering the chart.
This approach is suitable for intraday and session-based trading models, including SMC-style workflows.

Daily Levels [cryptalent]Daily High / Low / Mid / Open Levels is a session-based reference indicator designed to visualize key daily price levels directly on the chart.
This indicator automatically plots the Daily High, Daily Low, Daily Midpoint (High + Low / 2), and Daily Open as horizontal lines for each trading day. These levels help traders quickly identify important structural prices where liquidity, reactions, or acceptance often occur.
Key Features
Automatic Daily Levels
Plots Daily High (H), Low (L), Mid (M), and Open (O) using higher-timeframe daily data.
Levels update in real time as the current day develops.
Multi-Day History
Displays daily levels for a configurable number of past days.
Older levels are automatically removed to keep the chart clean.
Line Extension
Current day levels can be extended forward by a user-defined number of bars.
Useful for projecting intraday reaction zones and liquidity targets.
Visual Customization
Independent line width and color settings for each level.
Mid level is shown as a dashed line for quick visual distinction.
Labels & Price Tags
Optional letter labels (H / L / M / O) displayed near the extended levels.
Optional price labels showing the exact level values on the right side of the chart.
Labels update dynamically and only display for the active trading day.
Performance-Oriented Design
Efficient line and label management using arrays.
Automatically cleans up unused objects to stay within TradingView limits.
Use Cases
Identifying intraday support and resistance
Tracking daily range behavior
Monitoring mean reversion vs. range expansion
Aligning intraday execution with higher-timeframe structure
This indicator is particularly useful for traders who rely on market structure, session behavior, and objective price references rather than subjective trend lines.

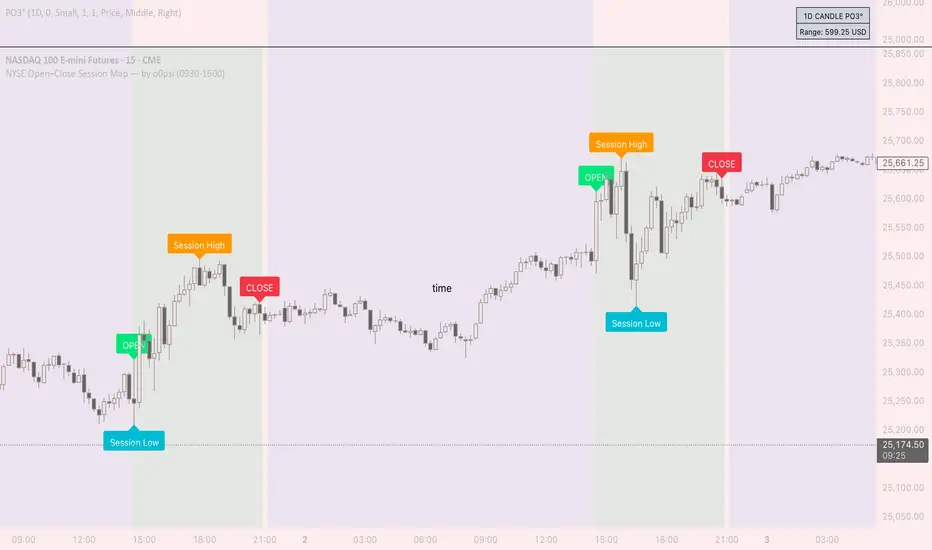
NYSE Open Close Session Map by o0psiNYSE Open Close Session Map by o0psi
This indicator highlights the regular US cash session window (default 09:30–16:00 New York time) and makes the key session bars obvious on the chart.
What it shows
A marker on the session OPEN bar
A marker on the session CLOSE bar (last in-session candle)
Optional background highlight for the full session window
Optional labels for the session high and session low bars (based on intraday price during the session)
How it works
The script detects bars inside the selected session window (New York timezone). It anchors OPEN on the first in-session bar, updates the session high/low while the session is active, then anchors CLOSE on the final in-session bar and labels the high/low bars where they occurred.
Notes
Session range precision depends on chart timeframe (lower timeframes capture extremes more precisely).
This is a charting/visualization tool and does not provide trading advice.
IDLP – Intraday Daily Levels Pro [FXSMARTLAB]🔥 IDLP – Intraday Daily Levels Pro
IDLP – Intraday Daily Levels Pro is a precision toolkit for intraday traders who rely on objective daily structure instead of repainting indicators and noisy signals.
Every level plotted by IDLP is derived from one simple rule:
Today’s trading decisions must be based on completed market data only.
That means:
✅ No use of the current day’s unfinished data for levels
✅ No lookahead
✅ No hidden repaint behavior
IDLP reconstructs the previous trading day from the intraday chart and then projects that structure forward onto the current session, giving you a stable, institutional-style intraday map.
🧱 1. Previous Daily Levels (Core Structure)
IDLP extracts and displays the full previous daily structure, which you can toggle on/off individually via the inputs:
Previous Daily High (PDH)
Previous Daily Low (PDL)
Previous Daily Open
Previous Daily Close,
Previous Daily Mid (50% of the range)
Previous Daily Q1 (25% of the range)
Previous Daily Q3 (75% of the range)
All of these come from the day that just closed and are then locked for the entire current session.
What these levels tell you:
PDH / PDL – true extremes of yesterday’s price action (liquidity zones, breakout/reversal points).
Previous Daily Open / Close – how the market positioned itself between session start and end
Mid (50%) – equilibrium level of the previous day’s auction.
Q1 / Q3 (25% / 75%) internal structure of the previous day’s range, dividing it into four equal zones and helping you see if price is trading in the lower, middle, or upper quarter of yesterday’s range.
All these levels are non-repaint: once the day is completed, they are fixed and never change when you scroll, replay, or backtest.
🎯 2. Previous Day Pivot System (P, S1, S2, R1, R2)
IDLP includes a classic floor-trader pivot grid, but critically:
It is calculated only from the previous day’s high, low, and close.
So for the current session, the following are fixed:
Pivot P – central reference level of the previous day.
Support 1 (S1) and Support 2 (S2)
Resistance 1 (R1) and Resistance 2 (R2)
These levels are widely used by institutional desks and algos to structure:
mean-reversion plays, breakout zones, intraday targets, and risk placement.
Everything in this section is non-repaint because it only uses the previous day’s fully closed OHLC.
📏 3. 1-Day ADR Bands Around Previous Daily Open
Instead of a multi-day ADR, IDLP uses a pure 1-Day ADR logic:
ADR = Range of the previous day
ADR = PDH − PDL
From that, IDLP builds two clean bands centered around the previous daily Open:
ADR Upper Band = Previous Day Open + (ADR × Multiplier)
ADR Lower Band = Previous Day Open − (ADR × Multiplier)
The multiplier is user-controlled in the inputs:
ADR Multiplier (default: 0.8)
This lets you choose how “tight” or “wide” you want the ADR envelope to be around the previous day’s open.
Typical use cases:
Identify realistic intraday extension targets, Spot exhaustion moves beyond ADR bands, Frame reversals after reaching volatility extremes, Align trades with or against volatility expansion
Again, since ADR is calculated only from the completed previous day, these bands are totally non-repaint during the current session.
🔒 4. True Non-Repaint Architecture
The internal logic of IDLP is built to guarantee non-repaint behavior:
It reconstructs each day using time("D") and tracks:
dayOpen, dayHigh, dayLow, dayClose for the current day
prevDayOpen, prevDayHigh, prevDayLow, prevDayClose for the previous day
At the moment a new day starts:
The “current day” gets “frozen” into prevDay*
These prevDay* values then drive: Previous Daily Levels, Pivots, ADR.
During the current day:
All these “previous day” values stay fixed, no matter what happens.
They do not move in real time, they do not shift in replay.
This means:
What you see in the past is exactly what you would have seen live.
No fake backtests.
No illusion of perfection from repainting behavior.
🎯 5. Designed For Intraday Traders
IDLP – Intraday Daily Levels Pro is made for:
- Day traders and scalpers
- Index and FX traders
- Prop firm challenge trading
- Traders using ICT/SMC-style levels, liquidity, and range logic
- Anyone who wants a clean, institutional-style daily framework without noise
You get:
Previous Day OHLC
Mid / Q1 / Q3 of the previous range
Previous-Day Pivots (P, S1, S2, R1, R2)
1-Day ADR Bands around Previous Day Open
All calculated only from closed data, updated once per day, and then locked.

KIMATIX VWAP/EMA System (by ASCE)**KIMATIX VWAP/EMA System (by ASCE)**
A precision-built intraday framework for momentum, structure, and liquidity timing.
**Why this indicator exists**
Most traders see movement, but not context. They enter too late, chase momentum, or fade reversals without understanding where institutional players react.
This tool solves that problem by combining two of the most powerful structural concepts in intraday price discovery:
Trend alignment through EMAs
Liquidity reaction zones through VWAPs
Together, they provide directional clarity, timing, and trade location.
**Core Components**
**Three Trend EMAs**
• **EMA 7** – Microtrend and momentum speed
• **EMA 23** – Intraday trend leadership
• **EMA 50** – Higher-timeframe structure anchor
This trio shows how price accelerates, slows, flips bias, or compresses.
**Three Volume-Weighted Average Prices**
• **Daily VWAP** – Primary scalper reference point
• **Weekly VWAP** – Bias filter and intermediate balance zone
• **Monthly VWAP** – High-impact “magnet” where major reactions occur
VWAP represents the fair value where volume is distributed.
When price taps, rejects, or reclaims these levels, liquidity flow shifts — ideal for scalp-to-swing entries.
**What it helps you see**
• When price is aligned with or diverging from trend
• Where momentum will expand or fail
• Which levels larger participants defend
• Where the highest-probability reaction zones form
This is not a signal tool — it is a structure and decision-making framework used by professional intraday traders.
**How to use it**
1. **Trade with VWAP alignment** – expect reactions at daily/weekly/monthly VWAPs
2. **Follow EMA flow** – when EMAs compress or flip, momentum changes
3. **Look for price interaction** – rejection, reclaim, or breakthrough of a VWAP often leads to fast moves
Ideal for scalping, day-trading, futures, FX, indices, crypto, and metals.
**Customization**
Colors for each EMA and each VWAP can be personalized, allowing alignment with your charting workflow.
**Final Notes**
This system gives you the *context* most traders miss — where trend meets liquidity.
Use it as a roadmap to understand where price *should* react and when momentum is likely to shift.

XAUMO MegaBar VSA by Mohamed Mahmoud XAUMO MegaBar VSA — Smart Money Breakout & Reversal Engine for XAUUSD
(Educational Use Only)
1) WHAT THIS INDICATOR DOES
XAUMO MegaBar VSA is an institutional-style smart money engine for XAUUSD designed to show you what professional money is doing, not just where price is moving.
It combines:
- MegaBar detection on 1H and 15m
- VSA (Volume Spread Analysis) events
- VPOC / WVPOC and volume clusters
- Liquidity sweeps, CHoCH, order blocks, FVGs
- Full Fibonacci leg mapping (retracements + extensions)
- Pre-built execution ladders (Entry, SL, TP1–TP4, Reverse Fib trades)
All in one dashboard with:
- Color-coded candles
- Clean, ATR-offset labels
- Optional tables and debug panels
So traders can quickly decide:
“Is this move driven by smart money, or is it just noise?”
2) CORE MODULES & FEATURES
A) SESSION + ACCUMULATION / DISTRIBUTION CONTEXT
- Session filter: London, New York, Overlap, or custom.
- Accumulation / distribution zones shaded on chart with adjustable colors/opacity.
- Quick legend so you always know if the market is in “smart money accumulation” or “distribution”.
HOW TRADERS USE IT:
Focus only on your trading session and instantly see if volume is building (accumulation), unloading (distribution), or flat. This helps you avoid trading in dead liquidity.
--------------------------------------------------
B) MEGABAR ENGINE + FIB MAP
- Automatically detects “MegaBars” (institutional candles) on 15m and 1H.
- Uses body size, range, and volume to pick only meaningful bars.
- Builds a full Fibonacci map from each active MegaBar:
• Retracements: 0, 13, 23.6, 38.2, 50, 61.8, 78.6, 86.2, 100, and -33.
• Extensions: 125% up to 600%+ (configurable ladder).
- Per-level style controls:
• Color, width, line style (solid/dotted/dashed).
• Optional price labels with ATR-based offsets.
- Main Fib legend that explains shallow / normal / deep reload zones.
HOW TRADERS USE IT:
You stop guessing where to buy or sell. You trade around the institutional leg:
- Buy dips into defined reload zones after bullish MegaBars.
- Sell rallies into extension zones after bearish MegaBars.
- Use clean, pre-mapped structure for both scalps and swings.
--------------------------------------------------
C) VSA ENGINE + CANDLE LABELING
- Detects a full set of VSA events such as:
• No Demand / No Supply
• Stopping Volume
• Absorption
• Springs / Upthrusts
• Buying Climax / Selling Climax
• Bullish / Bearish EVR
• Tests and confirmed VSA signals at S/R
- Enhances with:
• Body vs total range analysis
• Wick dominance for exhaustion vs aggression
• Momentum and volume confirmation filters
HOW TRADERS USE IT:
Each label becomes a “comment” from smart money on the chart:
- “No Demand” near resistance + weak RVOL = skip long entries.
- “Stopping Volume” + spring at Fib reload zone + VPOC cluster = potential high-quality long.
- Combine VSA with the MegaBar Fib map and volume profile for structured decisions.
--------------------------------------------------
D) SUPERSONIC BREAKOUT ENGINE
- Calculates a breakout strength score using:
• RVOL and volume expansion
• Spread expansion vs recent bars
• Body quality (body vs range)
• Bar progress (how much of the candle’s time has elapsed)
- Differentiates:
• Potential vs confirmed breakouts
• Strong, volume-backed moves vs weak spikes
- Optional debug label explaining:
• Momentum score
• Volume ratio and RVOL
• Spread behaviour
• Body quality
• Bar elapsed %
HOW TRADERS USE IT:
You avoid chasing every big candle.
You only act when:
- Breakout strength is high,
- Volume confirms the move,
- Structure (Fib / VPOC / CHoCH) is aligned.
--------------------------------------------------
E) VPOC / WVPOC CLUSTERS & DYNAMIC ZONES
- Tracks real-time VPOC and WVPOC.
- Identifies VPOC/WVPOC clusters as powerful S/R zones.
- Confirms bullish or bearish breaks when price clears these levels with volume.
- Provides dynamic SL and TP logic:
• SL near/behind VPOC with ATR buffer.
• TP ladders aligned with volume structure.
HOW TRADERS USE IT:
You anchor your risk to where the most volume traded, not random price points:
- Use VPOC as a rational stop placement.
- Treat VPOC/WVPOC clusters as “coiled springs” – zones where large moves often start.
--------------------------------------------------
F) SMART MONEY ENTRY ENGINE (1H + 15M MEGABARS)
- Uses MTF `request.security` logic to bring 1H MegaBars into lower timeframes.
- Identifies:
• 1H + 15m confluence entries (A-grade setups).
• Single-TF entries (B-grade setups).
- Pre-calculates for each scenario:
• Entry level (Fib-based within the MegaBar range).
• Stop loss (beyond range or leg-based).
• TP1–TP4 along Fib extensions / structure.
- Labels show:
• “Entry = …”
• “SL = …”
• “TP1 = … / TP2 = … / TP3 = … / TP4 = …”
with adjustable font size and ATR-based offsets.
- Optional “show only latest” mode to keep your chart clean.
- Alert-ready so you can receive notifications when conditions are met.
HOW TRADERS USE IT:
You get a fully defined execution ladder:
- The engine tells you where a logical entry is,
- Where a logical SL should be,
- And how to scale out with multiple targets.
You can use:
- Confluence setups for main trades,
- Single-TF setups for more frequent but lower conviction trades.
--------------------------------------------------
G) REVERSE FIB TRADING MODULE
- Triggers after extended moves when key TPs are hit.
- Looks for:
• Rejection candles at or beyond major extensions.
• Exhaustion + VSA confirmation.
- Builds a reverse (counter-trend) Fib plan:
• Counter-trend entry from extension extremes.
• TP ladder based on 0.618, 0.786, 1.236, 1.382, 1.5, 1.618, 2.0, etc.
• SL and TSL based on ATR and Fib distance.
- ATR timeframe adapts to chart timeframe.
HOW TRADERS USE IT:
You can fade overextended moves once structure and P/A agree:
- Trend traders can use it to tighten or exit.
- Counter-trend traders can structure “fade” setups with defined risk.
--------------------------------------------------
H) LIQUIDITY SWEEPS, CHoCH, ORDER BLOCKS, FVGs
- Detects sweeps above highs and below lows (liquidity grabs).
- Marks CHoCH (Change of Character) when structure flips with volume.
- Basic smart money order block detection (bullish / bearish).
- FVGs (Fair Value Gaps) shaded on chart, removed when filled.
HOW TRADERS USE IT:
Combine sweeps + CHoCH + MegaBar + VSA + VPOC:
- Join clean, volume-backed continuations.
- Fade obvious stop hunts when they reject into strong zones.
--------------------------------------------------
I) VSA + BREAKOUT DASHBOARD TABLE (OPTIONAL)
- Compact table with:
• VSA context
• Breakout score
• RVOL / volume status
• Spread and candle quality
• ATR regime
• Close position within the bar
• VPOC and elapsed bar percentage
HOW TRADERS USE IT:
Before pressing the button, glance at the table:
- Is volatility supportive?
- Is volume confirming?
- Is this a clean breakout or a tired move?
This pushes you toward rule-based execution and away from impulse.
--------------------------------------------------
3) TYPICAL TRADING WORKFLOW WITH XAUMO MEGABAR VSA
A) Pick timeframe and session
- Use 15m or 1H on XAUUSD.
- Align the indicator’s session inputs with your actual trading hours.
B) Read context first
- Check accumulation / distribution zones.
- Look at VSA events and the breakout engine.
- Note where VPOC / WVPOC are relative to price.
C) Find the active MegaBar and its Fib structure
- Identify the most recent bull/bear MegaBar.
- See if price is:
• Pulling back into reload zones,
• Breaking out of them,
• Or extending into high-risk zones.
D) Wait for smart money confirmation
- Look for:
• Confluence setups (1H + 15m MegaBars),
• Strong breakout score,
• Valid VSA signals,
• Helpful structure: CHoCH, FVG, sweeps.
E) Execute using the printed ladders
- Use the on-chart Entry / SL / TP labels as your execution framework.
- Adjust lot size and risk % according to your own plan.
F) Manage and exit
- Use ATR / VPOC logic to trail or lock profits.
- Rotate to reverse Fib setups if extensions look exhausted.
4) WHO THIS INDICATOR IS FOR
- Gold traders (XAUUSD CFD or spot) on 15m and 1H.
- Traders who prefer institutional structure (volume, VPOC, SMC, Fib) over simple indicators.
- Traders who want pre-structured entries, SL, and TP ladders without losing flexibility.
- Advanced students of VSA and smart money concepts who want everything in one tool.
5) FULL EDUCATIONAL DISCLAIMER (READ CAREFULLY)
- This indicator and all descriptions are for EDUCATIONAL PURPOSES ONLY.
- NOTHING in this script, its labels, tables, alerts, outputs, or documentation is:
• Investment advice
• Trading advice
• A recommendation to buy or sell any asset
• A signal service or portfolio management tool
- Markets are risky. Trading leveraged instruments such as CFDs, futures, or margin products involves a HIGH RISK of loss, including the possible loss of ALL invested capital.
- Past performance, backtests, or hypothetical examples DO NOT guarantee future results.
- Any probabilities, scores, or “quality levels” shown by the indicator are purely algorithmic and DO NOT represent guarantees or promises of profit.
- You are solely responsible for:
• Your position sizing
• Your leverage
• Your entries, exits, and risk management
• Compliance with local regulations and tax rules
- Before trading live with real money, you should:
• Thoroughly backtest and forward-test the indicator.
• Use a demo account to understand how signals behave in real time.
• Consult a licensed financial professional if you need personalised investment or trading advice.
- By using this indicator:
• You accept that the author and any associated entities or brands (including XAUMO, XAUMO indicators, and any promotional text) bear NO LIABILITY for any financial losses, missed gains, or decisions you make based on this tool.
• You agree that you are acting entirely at your own risk and that all outputs are informational and educational, not prescriptive trading instructions.
In short:
Use XAUMO MegaBar VSA as a powerful educational and analytical companion,
NOT as a substitute for your own independent judgment, testing, and risk control.
=====================================================
XAUMO MegaBar VSA — محرّك البريك آوت و الريفرسال بتاع السمارت ماني للدهب
( استخدام تعليمي بس)
1) المؤشّر ده بيعمل إيه؟
XAUMO MegaBar VSA معمول مخصوص للـ XAUUSD عشان يورّيك "الفلوس الكبيرة" بتتحرك إزاي،
مش بس السِعر رايح فين.
بيجمع في حتّة واحدة:
- رصد MegaBar على الساعة والربع ساعة
- VSA (Volume Spread Analysis) – سلوك الفوليوم جوّه الشمعة
- VPOC / WVPOC و تجمّعات الفوليوم المهمّة
- سويپس لليكويديتي + CHoCH + Order Blocks + FVGs
- خريطة فيبوناتشي كاملة (Retrace + Extensions)
- سلالم تنفيذ جاهزة (Entry, SL, TP1–TP4 + صفقات Reverse Fib)
وكل ده:
- بألوان واضحة على الشموع
- لِيبلات متظبّطة بـ ATR Offset
- Tables و Panels اختيارية
عشان المتداول يسأل نفسه:
"الحركة دي بتاعة سمارت ماني؟ ولا مجرد دوشة ملوش لازمة؟"
2) أهم الموديولات اللي جوّه المؤشّر
A) الكونتكست بتاع السيشن + تجميع/توزيع
- فلتر جلسات: لندن – نيو يورك – overlap – أو وقت تحطّه انت.
- مناطق Accumulation / Distribution متظلّلة بألوان أنت بتختارها.
- لچند بسيط يوضّح لك السوق دلوقتي: تجميع؟ توزيع؟ ولا نايم.
المتداول يستخدمه إزاي؟
تركّز بس في الجلسة اللي انت شغّال فيها، وتشوف فورًا:
فيه بناء مراكز؟ فيه تصريف؟ ولا مفيش فوليوم أصلاً؟
ده يقلّل دخولك في أوقات السوق فيها “ميت”.
--------------------------------------------
B) محرّك الـ MegaBar + خريطة الفيبوناتشي
- المؤشّر يلقط لوحده الـ MegaBars (شموع مؤسّسات) على 15m و 1h.
- بيعتمد على: حجم الجسم، مدى الشمعة، الفوليوم.
- يرسم خريطة فيبوناتشي كاملة من الرجل الأساسية:
• Retrace: 0, 13, 23.6, 38.2, 50, 61.8, 78.6, 86.2, 100, -33
• Extensions: من 125% لحد 600%+ (سلم قابل للتعديل)
- لكل مستوى:
• لون / سماكة / ستايل (سوليد – دوتيد – داشد)
• ليبل سِعر مع Offset بـ ATR
- لچند يشرح لك Reload Zones: ضحلة / عادية / عميقة.
المتداول يستخدمه إزاي؟
بدل ما “تخمّن” فين تشتري وتبيع:
- تشتري الدِپ جوّه مناطق Reload بعد MegaBar صاعد.
- تبيع الريبوند جوّه Extensions بعد MegaBar هابط.
- عندك هيكل واضح للسوينج والسكالب من غير فوضى.
--------------------------------------------
C) VSA + لِيبلات على الشموع
- يكتشف أحداث VSA زي:
• No Demand / No Supply
• Stopping Volume
• Absorption
• Spring / Upthrust
• Buying / Selling Climax
• EVR (شموع مجنونة فوليومًا)
• Tests و Confirmed Signals عند الدعوم/المقاومات
- مع تحسينات:
• تحليل Body vs Range
• مين اللي غالب؟ جسم الشمعة ولا الذيول؟
• فلتر Momentum + Volume
المتداول يستخدمه إزاي؟
كل ليبل على الشمعة = كومنت من السمارت ماني:
- No Demand عند مقاومة + RVOL ضعيف → بلاش تشتري.
- Stopping Volume + Spring جوّه Reload Zone + VPOC → فرصة قوية للشراء.
- توصل بين VSA + Fib + VPOC فتفهم “مين بيكسب المعركة”.
--------------------------------------------
D) محرّك البريك آوت Supersonic
- بيحسب Score للقوة بتاعة البريك آوت من:
• RVOL + Volume Expansion
• توسّع السبريد مقارنة بالشموع السابقة
• جودة جسم الشمعة (جسم ولا ذيل)
• نسبة الوقت اللي عدّى من الشمعة الحالية
- يفرّق بين:
• بريك آوت محتمل vs مؤكد
• حركة قوية مدعومة بفوليوم vs “شمعة شو”
- يقدر يطلع ليبل Debug يشرح:
• Momentum Score
• Volume Ratio / RVOL
• Spread Behaviour
• Body Quality
• % الوقت اللي فات من عمر الشمعة
المتداول يستخدمه إزاي؟
ماتجريش ورا كل شمعة كبيرة:
- استنَى لما يكون الـ Score عالي،
- والفوليوم مصدّق الحركة،
- والهيكل (Fib / VPOC / CHoCH) موافق.
ساعتها بس البريك آوت يستاهل المخاطرة.
--------------------------------------------
E) VPOC / WVPOC + مناطق الفوليوم
- يرقب VPOC و WVPOC في الوقت الحقيقي.
- يحدّد Clusters مهمة تتحوّل لـ Support / Resistance محترم.
- يراقب كسر المناطق دي بفوليوم واضح (بداية موجة جديدة).
- SL و TP ديناميك:
• SL حوالين VPOC مع Buffer من ATR.
• TP متوزع على مستويات فيبوناتشي و زونات فوليوم.
المتداول يستخدمه إزاي؟
بتربط مخاطرتك بأين اشتغل الفوليوم التقيل:
- VPOC = منطق منطقي للستوب.
- Clusters = زون ضغط ينفع يبدأ منها ترند قوي.
--------------------------------------------
F) محرّك الدخول بتاع السمارت ماني (1h + 15m MegaBars)
- يجيب MegaBars بتاعة الساعة جوّه فريمات أقل بالـ `request.security`.
- يميّز:
• Confluence بين MegaBar الساعة + MegaBar الربع ساعة (صفقة A-Grade).
• MegaBar على فريم واحد بس (B-Grade).
- يجهّز تلقائيًا:
• Entry
• SL
• TP1–TP4 على Extensions و مستويات هيكلية.
- اللّيبلات تكتب:
• Entry = …
• SL = …
• TP1 = … / TP2 = … / TP3 = … / TP4 = …
مع تحكّم في حجم الخط و ATR Offset.
- فيه اختيار “أظهر آخر سيناريو بس” عشان الشارت يفضل نضيف.
- جاهز للـ Alerts لما الشروط تكمّل.
المتداول يستخدمه إزاي؟
يبقى عندك Execution Ladder كامل:
- فين تدخل،
- فين تحط الستوب،
- إزاي تقسم الخروج على أكتر من هدف.
--------------------------------------------
G) موديل الـ Reverse Fib (صفقات عكس الاتجاه)
- بيشتغل بعد ما السعر يبالغ في الحركة و يوصل Extensions معيّنة.
- يدور على:
• شموع رفض عند/بعد Extensions.
• Exhaustion + إشارة VSA.
- يرسم خطة عكسية:
• Entry عكسي من Extension Extreme.
• TP سلم مبني على 0.618, 0.786, 1.236, 1.382, 1.5, 1.618, 2.0, … إلخ
• SL و TSL مبنيين على ATR و مسافة الفيبوناتشي.
المتداول يستخدمه إزاي؟
لو انت ترند تريدر:
- تستخدمه عشان تقفل/تخفف عند تمدّد مبالغ فيه.
لو انت Counter-Trend:
- يديك سيناريو “فِيد” منطقي بمخاطرة محسوبة.
--------------------------------------------
H) سويپس لليكويديتي + CHoCH + Order Blocks + FVGs
- يوسم مناطق ضرب الستوبات فوق الهاي وتحت اللو (Liquidity Grabs).
- يحدد CHoCH لما الاتجاه يغيّر شخصيته مع فوليوم.
- يرصد Order Blocks أساسية (Bullish / Bearish).
- يظلّل الـ FVGs و يشيلها لما تتعبّى.
المتداول يستخدمه إزاي؟
تجمع بين:
MegaBar + VSA + Fib + VPOC + Liquidity:
- يا إمّا تلحق موجة نظيفة،
- يا إمّا تفِيد Stop Hunt غبي اتكشف على الشارت.
--------------------------------------------
I) داشبورد VSA + Breakout (Table اختياري)
- Table صغيرة فيها:
• حالة VSA
• قوة البريك آوت
• RVOL / Volume
• Spread & Candle Quality
• حالة ATR
• مكان الإغلاق جوّه الشمعة
• وضع VPOC
• نسبة الوقت اللي عدّى من الشمعة
المتداول يستخدمه إزاي؟
قبل ما تدوس Buy / Sell:
- تبص على التابل ثانيتين:
الدنيا شغّالة ولا لأ؟
فيه فوليوم؟ فيه ترند؟ ولا حركة ميتة؟
ده يقلل قرارات “من غير plan”.
3) سيناريو شغل متداول على XAUMO MegaBar VSA
1) اختار الفريم + الجلسة
- 15m أو 1h على XAUUSD.
- ظبّط سيشن لندن/نيويورك زي وقت شغلك الحقيقي.
2) اقرأ الكونتكست
- السوق بيبنِي مراكز؟ بيصفّي؟ ولا نايم؟
- إيه إشارات الـ VSA و Score البريك آوت؟
- فين VPOC / WVPOC من السعر؟
3) دور على MegaBar النشط و خريطة الفيبوناتشي بتاعته
- السعر:
• بيرجّع جوّه Reload Zone؟
• بيكسر البرنچ؟
• ولا داخل على Overextension؟
4) استنَى تأكيد السمارت ماني
- Confluence بين MegaBar الساعة والربع ساعة.
- Breakout Score محترم.
- VSA منطقي (No Demand, Stopping Volume, Spring, …).
- Structure: CHoCH / FVG / Liquidity Sweep في اتجاه الصفقة.
5) نفّذ باستخدام السلم المطبوع على الشارت
- استخدم Entry / SL / TP1–TP4 كـ هيكل أساسي.
- عدّل اللوت / الريسك حسب خطتك انت.
6) الإدارة والخروج
- استعمل ATR + VPOC في Trailing/Lock.
- لما Extensions تبان مبالغ فيها → ركّز على Reverse Fib.
4) المؤشّر ده مناسب لمين؟
- اللي بيتاجر دهب XAUUSD (CFD أو Spot) على 15m و 1h.
- اللي بيحب شغل مؤسّسات: Volume, VPOC, SMC, Fib مش مؤشرات بسيطة.
- اللي عايز Execution Plan جاهز (Entry/SL/TP) بس لسه عنده حريّة تعديل.
- اللي عايز يتعلّم VSA و Smart Money Concepts بشكل تطبيقي على شارت واحد.
5) إخلاء مسؤولية كامل (مهم تقراه)
- المؤشّر ده وكل الكلام اللي حواليه للتعليم بس.
- مش:
• نصيحة استثمارية،
• ولا توصية شراء/بيع،
• ولا خدمة إدارة محافظ،
• ولا سيجنال سيرڤس.
- التداول في الأسواق (خصوصًا المشتقات، الـ CFD، الفيوتشر) فيه مخاطرة عالية جدًا،
وممكن تخسر جزء كبير أو كل رأس مالك.
- أي أداء سابق، باك تست، أو مثال افتراضي → مش ضمان لنتيجة مستقبلية.
- أي نسبة احتمالات، Scores، أو “Quality” بيطلعها المؤشّر:
• دي حسابات كود، مش ضمان ربح،
• مش وعد ولا تعهّد بأي نتيجة.
- انت المسؤول 100% عن:
• حجم العقود اللي بتدخلها،
• الرافعة اللي بتستخدمها،
• أماكن الدخول والخروج،
• وإدارة المخاطرة بتاعتك،
• والتزامك بالقوانين والضرائب في بلدك.
- قبل ما تستخدم المؤشّر على حساب حقيقي:
• جرّب كويس على باك تست و فورورد تست،
• اشتغل فترة على Demo،
• لو محتاج نصيحة مالية شخصية → ارجع لمستشار مالي مرخَّص.
باختصار:
XAUMO MegaBar VSA ده أداة تعليمية وتحليلية قوية تساعدك تفهم حركة الذهب،
مش زرار “اطبع فلوس”.
انت صاحب القرار، وانت صاحب المسؤولية، وانت اللي بتتحمّل أي ربح أو خسارة.

Session Dynamics & Pivot Overlay (Arjo)## **OVERVIEW**
The **Session Dynamics & Pivot Overlay (Arjo)** is a visual analysis tool that displays session-based price ranges, anchored volume-weighted averages, daily pivot levels, and smoothed trend conditions on the chart. It highlights how price interacts with custom sessions, midpoint levels, and dynamic ranges, providing a structured visual layout that helps users observe market behavior over time without implying any form of prediction or trading signal.
## **CONCEPTS**
This indicator incorporates several widely used analytical concepts:
- **Session Ranges:** Identifies user-defined time windows and visually displays their high, low, and midpoint behavior throughout the session.
- **VWAP (Morning Session):** Shows volume-weighted average price calculations for a defined morning period, assisting with visual comparison between price and weighted averages.
- **Daily Pivot Levels:** Displays R1–R2, S1–S2, central pivot, and associated levels derived from prior daily price data.
- **Trend Smoothing:** Uses SuperSmoother filtering and an additional EMA to highlight whether the smoothed trend is rising or falling.
- **EMA + ATR Bands:** Plots a 20-period EMA with upper and lower ATR-derived bands to help visualize short-term price displacement relative to average true range.
All of these elements are presented solely for structural and comparative chart analysis.
## **FEATURES**
- **Custom Session Visualization:** Automatically draws session boxes, capturing the evolving high, low, and midpoint throughout the defined intraday window.
- **Dynamic Midline Calculation:** A midpoint line is updated continuously during the session to visually anchor price within the session’s range.
- **Morning Session VWAP:** Displays a dedicated VWAP line for the morning window with adjustable source and configuration options.
- **Daily Pivot Lines:** Automatically plots pivot, BC/TC, R1–R2, and S1–S2 levels with customizable colors, widths, and line styles.
- **Trend-Responsive Pivot Display:** Optionally toggles visibility of R2 or S2 depending on the direction of the smoothed trend.
- **EMA + ATR Zones:** Renders a 20-EMA and ATR-based support/resistance zone using filled regions for enhanced visual clarity.
- **Full Customization:** Multiple color, transparency, line-style, and display options allow users to adapt the presentation to their charting preferences.
- **Overlay Compatible:** Designed to work directly on price charts without obstructing candles or other overlays.
## **HOW TO USE**
Users can interact with the indicator entirely through the settings panel:
- Adjust session timings to match preferred market hours or custom internal zones.
- Enable or disable the display of pivot levels, VWAP, or the ATR/EMA zone.
- Customize colors and line styles to improve visibility according to the chart background or personal preference.
- Observe how price behaves relative to the session box, midpoint, VWAP, and pivot levels for contextual understanding.
- Utilize the smoothed trend condition to see when the indicator chooses to display certain pivot extensions.
These elements help users interpret chart structure, volatility, and intraday behavior in a visually organized manner.
## **CONCLUSION**
The ** Session Dynamics & Pivot Overlay (Arjo) ** indicator offers a consolidated view of session structure, pivot levels, VWAP, and smoothed trend conditions. Its purpose is to improve visual clarity and assist users in understanding market context without issuing directives or trade suggestions. It functions as an educational tool that enhances chart interpretation and supports structured analysis.
---
## **DISCLAIMER**
This indicator is for educational and visual analysis purposes only. It does not provide trading signals, financial advice, or guaranteed outcomes. Users should conduct their own research and consult a licensed financial professional when necessary. All trading decisions are solely the responsibility of the user.
Happy Trading (Arjo)

Session, Weekly, Daily LevelsScroll down for hungarian description!
Magyar leíráshoz görgess lejjebb!
Overview
This script provides a unified market structure mapping tool that automatically identifies and visualizes key intraday, daily, and weekly reference levels. It helps traders contextualize price action throughout the trading week by marking true session opens, previous day highs/lows, weekly highs/lows, and weekday opens, all with accurate historical anchoring and correct timezone handling.
What This Script Does
1. Intraday Session Opens (Tokyo, London, New York)
- Detects the exact candle where each session opens.
- Draws horizontal rays with labels.
- Automatically clears lines at the start of each new day.
- Uses a custom local-to-exchange timezone conversion system.
2. Weekly Levels
- Last week high and low (precise bar anchoring, not HTF aggregation)
- Current week open (also Monday open)
- Auto-reset on new week
- Levels are always drawn from the true candle where they formed.
3. Previous Day High & Low
- Continuously tracks intraday highs and lows.
- On a new day, stores yesterday’s values and anchors rays to the exact bars.
- Levels remain visible for the full current day and reset the next day.
4. Weekday Opens (Tue–Fri)
- Captures the exact opening price of Tuesday–Friday.
- Monday open = Week open, so it is not shown separately.
- Auto-reset on new week.
Timezone Logic (Original Feature)
The script converts:
local session times → exchange timezone → chart timestamps
It works correctly regardless of chart timezone or instrument exchange location.
Line Drawing Logic
- Finds the exact bar_index where each level forms.
- Draws rays extending to the right.
- Labels are placed ahead of price.
- Safe updating prevents “bar index too far” errors.
How to Use
- Identify daily/weekly structure.
- Track bias relative to session opens.
- Observe reactions around weekday opens.
- Compare price action to last week's range.
Originality
- Custom timezone conversion engine.
- True historical bar anchoring.
- Fully automated weekly/daily structural resets.
- Independent styling for each level type.
- Not a mashup; all components follow one unified logic.
Limitations
- Does not predict trend or direction.
- Structural tool only.
Summary
A precise and reliable market structure tool that unifies weekly, daily, and intraday reference levels with full timezone automation and true-candle anchoring.
MAGYAR LEÍRÁS
--------------
Áttekintés
Ez az indikátor egy összetett piaci szerkezet-feltérképező eszköz, amely automatikusan megjeleníti a legfontosabb intraday, napi és heti referenciaértékeket. A célja, hogy a kereskedő tisztán lássa a piac aktuális környezetét: hol nyíltak a főbb devizapiaci szekciók, hogyan alakult a tegnapi tartomány, hol volt a múlt heti csúcs/mélypont, és hogyan nyitottak az egyes hétköznapok.
Mit tud a script?
1. Szekciónyitások (Tokyo, London, New York)
- Megkeresi a pontos gyertyát, amely a szekciónyitáskori árat tartalmazza.
- Vízszintes vonalat és címkét rajzol.
- Minden nap elején automatikusan törli a korábbi nap szintjeit.
- Egyedi időzóna-konverziós rendszerrel működik (helyi idő → tőzsdei idő → chart idő).
2. Heti szintek
- Múlt heti maximum és minimum (pontos gyertyapontra horgonyozva)
- Aktuális heti nyitóár (egyben a hétfői nyitó is)
- Új hét kezdetekor automatikusan frissül.
- A múlt heti high/low nem fix időpontra, hanem a valódi gyertyára kerül.
3. Előző napi High és Low
- Folyamatosan követi a napi maximumot és minimumot.
- Napváltáskor elmenti és pontos gyertyáról indítja a ray-t.
- A szintek a teljes nap folyamán megmaradnak, majd a következő nap törlődnek.
4. Hétköznapok nyitóárai (Kedd–Péntek)
- A kedd, szerda, csütörtök és péntek nyitóárát rögzíti és megjeleníti.
- A hétfői nyitó a Week Open, ezért külön nem jelenik meg.
- Heti váltáskor automatikusan törlődnek.
Időzóna-kezelés (egyedi megoldás)
A script a felhasználó helyi idejét átszámítja az instrumentum tőzsdei időzónájára, majd a chartra vetíti.
Ez biztosítja, hogy minden szekciónyitás helyesen jelenik meg, bármely chart vagy instrumentum esetén.
Vonalrajzolási logika
- A szintek a valódi bar_index alapján kerülnek rögzítésre.
- Jobbra nyúló ray-eket rajzol.
- A címkék mindig a jobb oldalon, előre helyezve jelennek meg.
- Biztonságos frissítési rendszer akadályozza meg a hibákat (pl. “bar index too far”).
Használat
- Napi/heti szerkezet meghatározása.
- Bias követése a session openekhez viszonyítva.
- Reakciók figyelése a hétköznapok nyitóárai körül.
- Összevetés a múlt heti tartománnyal.
Eredetiség
- Egyedi időzóna-kezelő motor.
- Igazi gyertyapont-alapú horgonyzás.
- Automatikus napi/heti reset.
- Minden szint külön stílusban konfigurálható.
- Nem mashup; egységes rendszer.
Összegzés
Professzionális, pontos eszköz a piaci szerkezet feltérképezésére, amely egyesíti a heti, napi és intraday szinteket, teljes időzóna-automatizálással és gyertyapontra horgonyzott kijelölésekkel.

Discipline Box Trader — by chaitu50cDiscipline Box Trader — by chaitu50c is a rule-based price action tool built around alternating candle structures.
For each session, the indicator detects FIRST key alternating zone, marks it as a gray “Discipline Box”, and then tracks how price breaks and rotates through that zone with clear green/red segments.
The idea is simple:
The script continuously looks for alternating candle sequences:
Red → Green → Red → Green …
or
Green → Red → Green → Red …
When the sequence reaches your minimum required length (Min candles in alternate combo), it:
Finds the highest high and lowest low of that entire alternation combo.
Draws a gray rectangular box from the start of the combo to its end.
This gray region is named the “Discipline Box”.
After this Discipline Box is created:
Upside breakout → close > box high
Downside breakout → close < box low
For example if, Upside Breakout → Green Regime Segment
The gray box is visually closed at the previous bar.
A new green box segment starts from the breakout bar.
Box fill, border, and center line all turn green.
This green segment extends to the right until another breakout flips the regime.
There is a small visible gap between the gray box and the new coloured segment, clearly showing where the breakout actually occurred.
Within the same session, price may:
Break up → green segment.
Later break down through the same band → red segment.
Possibly flip again.
All of this happens inside the one original Discipline Box, giving a clean visual map of who is in control now without creating new zones.
Reset Mode
None
No automatic reset; box can persist across all data.
New Day
At each new trading day:
Current box and center line are closed.
All internal counters reset.
A completely fresh Discipline Box can form for the new day.
Gap Minutes
If time between candles exceeds Gap Threshold (minutes):
Treat this as a session break.
Close the current box and restart detection after the gap.
This ensures clarity and separation between sessions and prevents overlapping “old” structure from dominating new market conditions.
Trading Framework: 2 Trades per Discipline Box
⚠️ This is not financial advice. This is a structured usage idea to support discipline.
A suggested trading framework to pair with this indicator:
Trade 1 — First Breakout Trade
Wait for the first body-based breakout from the Discipline Box:
Upside breakout → consider a single long trade.
Downside breakout → consider a single short trade.
Use the box high, low, and midline as reference points for:
Stop placement, partial exits, or risk-reward zones.
Trade 2 — Opposite Regime Flip
If price later breaks the opposite side of the same box:
Consider exactly one more trade in the new direction (a failed breakout / reversal play).
Example: green regime first, later broken down into red → potential short trade.
After these maximum 2 trades per Discipline Box, you can:
Skip additional trades inside that session’s structure.
Wait patiently for the next session and next Discipline Box to form.
This hard rule helps avoid over-trading, revenge trades, and emotional interference — staying faithful to the “Discipline” theme.
The indicator has a built-in alert condition: Discipline Box Detected
Triggers Whenever a new gray Discipline Box is created (i.e., the first valid alternation zone for that session).
Practical Notes & Disclaimer
The indicator does not tell you when to buy or sell; it simply:
Marks a disciplined structure zone.
Shows live regime shifts (green/red).
Supports a clear “max 2 trades per box” framework.
Use on a demo first, adapt to your style, and always remember:
Your discipline matters more than the indicator.

Reversal SMC Suite Pro by TradeswithBThe Reversal SMC Suite is an intraday Smart Money Concepts toolkit designed to help traders visually analyze structure, imbalances, and displacement during trending or volatile sessions. This script combines multiple SMC elements—reversals, order blocks, FVGs, HTF bias, and pivot-based support/resistance—into one organized framework to support decision-making.
This indicator does not generate buy or sell signals and does not guarantee results. It is strictly a charting and visualization tool intended to help traders study market behavior.
🔍 Key Features
1. Reversal Detection
Swing Failure Pattern (SFP)
Bullish/Bearish Engulfing
Momentum candle detection (ATR-based)
Optional unified “reversal” signal
Visual arrows and reversal blocks
These are designed to highlight potential turning points based on price behavior—not to predict or guarantee outcomes.
2. HTF Trend Filter
Optional higher timeframe EMA/SMA filter
Customizable HTF resolution
Bias modes: Long only / Short only / Both
This helps you align lower-timeframe reversals with broader market context.
3. Dynamic Order Blocks
Automated OB detection (Body, Wick, or Hybrid)
Smart mitigation logic (body-based or wick-based)
Configurable lookback and OB count
Optional ATR body-size filter for OB quality
Real-time mitigation removal
These tools help visualize areas of interest where price previously showed displacement.
4. Fair Value Gaps (FVG)
Automatic gap detection
Optional FVG extension until filled
Per-side max FVG limit
Useful for identifying imbalance zones and measuring how price revisits inefficiencies.
5. Support / Resistance
Pivot-based S/R with left/right bar settings
Auto-drawing with customizable line counts
Optional S/R visibility toggle
🎛 Presets Included
Several visual configurations are included for convenience:
Custom / Manual (default)
Intraday ORB 5–15m (optimized for fast futures charts)
Clean SMC (Trend + OB)
FVG + OB Combo
Presets adjust inputs automatically to give new users cleaner starting points.
🧠 How To Use
This script is meant to be paired with any strategy or workflow that benefits from:
visual structure analysis,
HTF/LTF alignment,
OB + FVG context, or
intraday trend identification.
It does not replace risk management, strategy rules, or trade planning.
⚠️ Important Notes / Disclaimer
This indicator does not generate trading signals.
No part of this script guarantees profitable outcomes.
It is for educational and informational purposes only.
Always perform your own analysis and use proper risk management.
Past market behavior does not guarantee future results.

Renko ScalperWhat it is-
A lightweight Renko Scalper that combines Renko brick direction with an internal EMA trend filter and MACD confirmation to signal high-probability short-term entries. EMAs are used internally (hidden from the chart) so the visual remains uncluttered.
Signals-
Buy arrow: Renko direction turns bullish AND EMA trend up AND MACD histogram positive.
Sell arrow: Renko direction turns bearish AND EMA trend down AND MACD histogram negative.
Consecutive same-direction signals are suppressed (only one arrow per direction until opposite signal).
Visuals-
Buy / Sell arrows (large) above/below bars.
Chart background tints green/red after the respective signal for easy glance recognition.
Inputs:-
Renko Box Size (points)
EMA Fast / EMA Slow
MACD fast/slow/signal lengths
How to use-
Add to chart
Use smaller Renko box sizes for scalping, larger for swing-like entries.
Confirm signal with price action and volume—this indicator is a signal generator, not a full automated system.
Use alerts (built in) to receive Buy / Sell arrow notifications.
Alerts-
Buy Arrow — buySignal
Sell Arrow — sellSignal
Buy Background / Sell Background — background-color state alerts
Recommended settings-
Timeframes: 1m–15m for scalping, 5m for balanced intraday.
Symbols: liquid futures/currency pairs/major crypto.
Disclaimer
This script is educational and not financial advice. Backtest and forward test on a demo account before live use. Past performance is not indicative of future results. Use proper risk management.
