Session Volume Profile – Asia, London, NYSession Volume Profile – Asia, London, New York
Product Description
This tool displays intraday volume distribution for the Asian, London, and New York trading sessions.
It provides a visual breakdown of where trading activity concentrated during each session, helping users study volume structure across global market phases.
What the Tool Shows
1. Session Levels
Each session plots three main reference levels:
Point of Control (POC) — the price level with the highest volume traded during that session
Value Area High (VAH) — upper boundary of the primary volume region
Value Area Low (VAL) — lower boundary of the primary volume region
Each session is assigned its own color for easier differentiation.
2. Session Volume Histogram
A horizontal volume histogram displays how activity is distributed within each session.
Longer bars indicate higher relative volume at that price.
3. Session Highlighting (Optional)
Background shading can be enabled to visually identify the current active session.
4. Session Countdown (Optional)
A small text label shows how much time is left in the current session. This is for chart awareness only.
How to Read the Display (Educational Use Only)
POC is often viewed by many traders as a key reference point when studying intraday balance or activity clusters.
VAH / VAL can help users observe where the majority of volume occurred within a session.
Comparing session profiles may help identify how participation shifts from Asia → London → New York.
Observing how price interacts with these historical volume areas can provide context when studying intraday structure.
This panel does not generate trading signals. It is intended for chart analysis, market study, and understanding how volume distributes across global sessions.
Customization Options
Accessible via Settings → Inputs:
Enable/disable any session
Adjust value area percentage
Modify histogram density
Adjust visual opacity
Toggle countdown timer or session shading
These options allow users to tailor the display to different chart styles and timeframes.
Notes
This tool is for educational and informational purposes only.
It does not provide trading or financial advice.
No signals are produced; all outputs are historical/analytical.
Code is published as protected/closed-source to preserve the structure of the underlying calculations.
Ict

Options Fusion Core - Lite v6Options Fusion Core – Lite v6
A dual-engine oscillator designed to provide clear, confidence-driven market reads. OFC – Lite v6 combines two high-signal components into a single 0–100 panel to help traders interpret momentum strength and liquidity flow at a glance.
Core Components
Momentum Engine (Solid Line)
Above 50: Bullish bias (green shades)
Below 50: Bearish bias (red shades)
Near 20 or 80: Potential exhaustion zones where trends may pause or reverse
Liquidity Gauge (Dotted Line)
Above 55: Strong buying pressure
Below 45: Selling pressure
Around 50: Neutral flow
How to Use (Educational Purpose Only)
Alignment Signals: Watch for Momentum Engine and Liquidity Gauge moving in the same direction.
Example: Momentum >50 and Liquidity >55 → constructive environment
Example: Momentum <50 and Liquidity <45 → weakening conditions
Extremes: Momentum near 20 or 80 indicates potential trend exhaustion. Paired with strong Liquidity changes, these zones may highlight possible reversals or pauses.
Neutral Line (50): Many false moves occur around 50. Wait for a clear break above or below before interpreting as a signal.
Use in Context: Combine with price action, volume, or other indicators for confirmation.
User Inputs
Fast Momentum Length — controls how quickly Momentum reacts
VFI Length — smooths the Liquidity Gauge
VFI Cutoff — adjusts sensitivity to flow spikes
Lite Version:
Oscillator panel only
No automated signals or multi-ticker table
Educational and visualization purposes only
Important Notice
This script is educational and informational only. Not trading, financial, or investment advice.
Calculations are proprietary and protected to safeguard intellectual property.
No repainting; all results reflect real-time calculation.

Gamma Conviction Oscillator LiteGamma Conviction Oscillator Lite
A volume-weighted momentum oscillator designed to help traders visualize conviction in gamma-heavy instruments (SPY, TSLA, NVDA, MSTR, COIN, HOOD, etc.). This LITE edition is fully functional and educational, focusing on reading market momentum without offering trading signals.
Core Features (LITE Version):
Dynamic oscillator panel with volatility-adjusted overbought/oversold levels
Long-term trend filter: 200-period moving average selectable as SMA, EMA, or HMA
Conviction-based coloring system:
Bright Lime → high-conviction oversold (price above long-term MA)
Bright Red → high-conviction overbought (price below long-term MA)
Teal / Maroon → low-conviction extremes (counter-trend)
User Inputs:
Base Oscillator Length, Volatility Smoothing Length, and Sensitivity Factor are adjustable in Settings → Inputs
Long-Term Trend Length and MA Type are selectable for trend confirmation
How to Read Signals (Educational Use Only):
Oscillator Level: Observe the main VWPS line relative to overbought/oversold levels:
Above the red overbought line → price may be stretched
Below the green oversold line → price may be compressed
Trend Context: Compare the oscillator reading to the long-term MA:
Oscillator above oversold + price above MA → potential bullish conviction
Oscillator below overbought + price below MA → potential bearish conviction
Color Coding: The line color communicates conviction strength and trend alignment:
Bright Lime / Bright Red indicate strong alignment with trend extremes
Teal / Maroon indicate weaker, counter-trend extremes
Use the oscillator in conjunction with your own analysis; consider confirming with price action, volume, or other indicators.
LITE Version:
Oscillator panel only
No divergence detection
No multi-ticker gamma table
Important Notice:
This script is educational and informational only. Not trading, financial, or investment advice.
All calculations are proprietary and protected to preserve intellectual property.
No repainting: results reflect real-time calculations.
Source Code:
This script is published as protected/closed-source to safeguard GammaBulldog intellectual property.

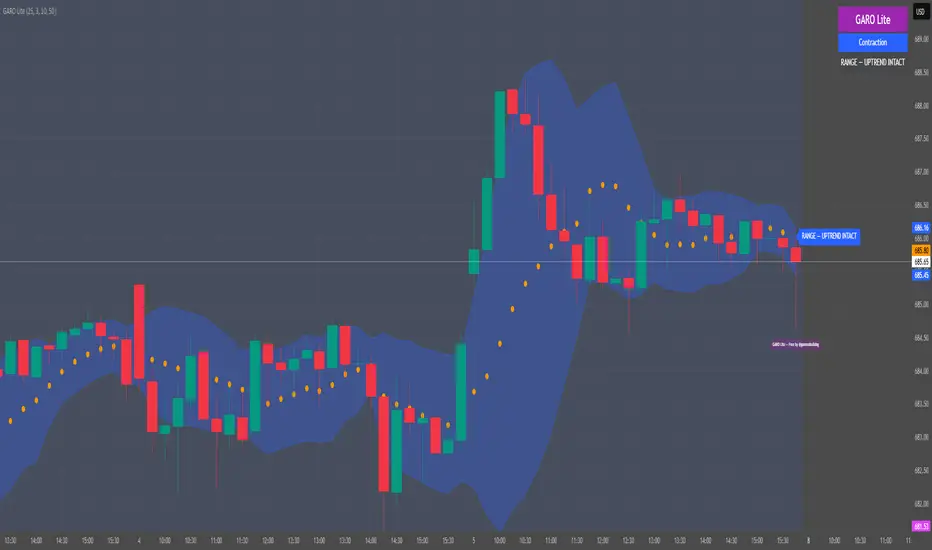
GARO Lite - Free Regime EngineGARO — Gamma Regime Engine
Overview
GARO (Gamma Regime Oscillator) is a visual regime engine that shows market conditions in real-time. This free edition is for educational and charting purposes only.
Key Features
Regime Detection: Highlights Expansion, Contraction, and Spike conditions using trend, volatility, and volume-based calculations.
Core and Bands: Central reference line with upper and lower bands.
Visual Alerts: Orange dots appear under candles during compressions; background colors indicate current regime.
Signal Labels: Labels provide visual guidance based on regime and trend slope.
Gamma Exposure (GEX) Proxy & Zero Gamma Flip: Optional visual overlays for contextual awareness.
User Inputs: Some settings are visible in the input panel but are disabled in this free edition.
How to Use
Regime Colors:
Expansion (green background): Market trending/expanding; core line indicates direction.
Contraction (blue background): Market range-bound; orange dots indicate compression.
Spike (red background): High volatility; visual alert only.
Labels & Signals:
Labels highlight potential regime moves; not trade advice.
Combine colors, core/band positions, and label cues with your own analysis.
Core Line & Bands:
Core line shows central reference per regime.
Upper/lower bands provide context for potential support/resistance zones.
Orange Dots:
Indicate compressions or regime-specific signals; visual only.
Gamma Exposure & Zero Gamma Flip (Optional):
Illustrates potential price sensitivity; charting/educational use only.
Important:
Protected code; underlying calculations are not visible.
For educational and visual guidance only; not financial or trading advice.
Works on any timeframe; free edition gives visual regime insights.
Liquidity Pulse Oscillator LITETitle:
Liquidity Pulse Oscillator LITE
Description:
This indicator provides an observational view of market activity by measuring intra-bar price and volume dynamics. It is fully informational and educational, and does not constitute financial, trading, or investment advice.
Key Features:
Fast and Slow Pulse lines: Dual EMAs of volume-weighted pressure to highlight crossover points.
Histogram: Displays the difference between fast and slow pulses with color-coded bars (green for positive, red for negative).
Scaled 0–100 line: Provides a normalized perspective for easier interpretation of relative activity levels.
EXP/CON markers: Indicate expansions and contractions in observed market activity.
How It Works:
Pressure is calculated as the absolute open-to-close movement divided by the candle range, multiplied by volume. Safeguards handle zero-range bars. The resulting values are smoothed using fast and slow EMAs. Crossovers generate EXP and CON markers, helping users visualize changes in market activity.
Why This Approach:
Traditional volume indicators often overlook intra-bar dynamics and range normalization. This oscillator emphasizes price movement relative to bar range combined with volume, offering an additional perspective on shifts in market activity.
How to Use:
EXP marker + positive histogram: Indicates potential expansion in observed market activity.
CON marker + negative histogram: Indicates potential contraction in observed market activity.
Can be applied on any timeframe to help confirm breakouts, reversals, or shifts in market behavior.
Notes:
For informational and educational purposes only. Not financial advice.

TCT OBIF Detector█ OVERVIEW
The OBIF (Order Block Imbalance Fill) indicator automatically detects and visualizes high-probability trading zones by combining two powerful Smart Money Concepts: Order Blocks and Fair Value Gaps (FVGs).
An OBIF occurs when an Order Block forms immediately before a Fair Value Gap, creating a zone of institutional interest that price often revisits before continuing its move.
█ CONCEPTS
Order Block (OB)
An Order Block is the last opposing candle before a strong directional move. It represents an area where institutional traders likely placed orders.
- Bullish OB: Last bearish candle before an up-move
- Bearish OB: Last bullish candle before a down-move
Fair Value Gap (FVG)
An FVG is a price imbalance created when a candle's body completely gaps past the previous candle's range, leaving an unfilled area.
- Bullish FVG: Gap up where candle .low > candle .high
- Bearish FVG: Gap down where candle .high < candle .low
OBIF Zone
When an Order Block directly precedes an FVG, it creates an OBIF - a confluence zone with higher probability of acting as support/resistance.
█ HOW TO USE
1. Identify the Trend
Use OBIFs in the direction of the higher timeframe trend for best results.
2. Wait for Price to Return
OBIFs act as magnets - price often returns to fill the imbalance and test the order block.
3. Look for Confirmation
When price enters an OBIF zone, look for:
- Rejection wicks
- Engulfing patterns
- Break of structure on lower timeframes
4. Mitigation
Once price fully trades through the OBIF (touches the opposite edge), the zone is considered mitigated and loses its significance.
█ FEATURES
- Automatic Detection — Identifies OBIFs in real-time as they form
- Visual Zones — Clean, non-intrusive boxes that don't obscure price action
- Mitigation Tracking — Zones automatically update when price mitigates them
- Multi-Timeframe Friendly — Works on any timeframe from 1m to Monthly
- Customizable — Adjust colors, opacity, and display preferences
█ SETTINGS
- Lookback Window — How many candles back to search for the Order Block (default: 3)
- Show Bullish/Bearish — Toggle visibility of each type
- Show Mitigated — Display zones that have been mitigated (shown in gray)
- Fill Opacity — Adjust zone transparency (higher = more see-through)
- Border Width — Thickness of zone borders
█ BEST PRACTICES
✓ Use on higher timeframes (1H+) for more reliable zones
✓ Combine with market structure analysis
✓ Look for OBIFs at key support/resistance levels
✓ Use lower timeframe confirmation for entries
✗ Don't trade every OBIF blindly
✗ Avoid OBIFs against the dominant trend
█ CREDITS
The Composite Trader (TCT) methodologies.

Previous Day/Week High and Low • Ahmed SiddiquiThe script shows Previous Day's Candle High and Low & Previous Week's Candle High and Low which updates automatically everyday and every week. There are few more modification will be done in next versions.

Sessions Pro+ (@JP7FX)Sessions Pro Plus (JP7FX)
Sessions Pro Plus marks key trading sessions and gives real time session information. It helps traders track session behaviour without manual work.
Session Info Panel
Shows live updates for Tokyo, Frankfurt, London and New York.
Displays if session highs or lows are intact or taken.
Includes a countdown to the next session start.
Range High and Low Alerts
Alerts trigger when a session high or low is breached.
Useful for monitoring breaks, sweeps and changes in behaviour.
Daily Open Bias
Shows whether price is above or below the daily open.
Helps traders understand directional conditions quickly.
Custom Session Settings
Session times can be adjusted to fit personal trading hours.
Sessions can be renamed and recoloured for clarity.
Webhook and Real Time Alerts
Alerts support webhook integrations for external platforms, including Discord.
Countdown Timers
Displays countdowns to the next session open to help plan ahead.
This indicator is designed for traders who follow session timing, session highs and lows, and daily open behaviour. It aims to simplify chart preparation and reduce the need to track session information manually.

Obsidian Flux Matrix# Obsidian Flux Matrix | JackOfAllTrades
Made with my Senior Level AI Pine Script v6 coding bot for the community!
Narrative Overview
Obsidian Flux Matrix (OFM) is an open-source Pine Script v6 study that fuses social sentiment, higher timeframe trend bias, fair-value-gap detection, liquidity raids, VWAP gravitation, session profiling, and a diagnostic HUD. The layout keeps the obsidian palette so critical overlays stay readable without overwhelming a price chart.
Purpose & Scope
OFM focuses on actionable structure rather than marketing claims. It documents every driver that powers its confluence engine so reviewers understand what triggers each visual.
Core Analytical Pillars
1. Social Pulse Engine
Sentiment Webhook Feed: Accepts normalized scores (-1 to +1). Signals only arm when the EMA-smoothed value exceeds the `sentimentMin` input (0.35 by default).
Volume Confirmation: Requires local volume > 30-bar average × `volSpikeMult` (default 2.0) before sentiment flags.
EMA Cross Validation: Fast EMA 8 crossing above/below slow EMA 21 keeps momentum aligned with flow.
Momentum Alignment: Multi-timeframe momentum composite must agree (positive for longs, negative for shorts).
2. Peer Momentum Heatmap
Multi-Timeframe Blend: RSI + Stoch RSI fetched via request.security() on 1H/4H/1D by default.
Composite Scoring: Each timeframe votes +1/-1/0; totals are clamped between -3 and +3.
Intraday Readability: Configurable band thickness (1-5) so scalpers see context without losing space.
Dynamic Opacity: Stronger agreement boosts column opacity for quick bias checks.
3. Trend & Displacement Framework
Dual EMA Ribbon: Cyan/magenta ribbon highlights immediate posture.
HTF Bias: A higher-timeframe EMA (default 55 on 4H) sets macro direction.
Displacement Score: Body-to-ATR ratio (>1.4 default) detects impulses that seed FVGs or VWAP raids.
ATR Normalization: All thresholds float with volatility so the study adapts to assets and regimes.
4. Intelligent Fair Value Gap (FVG) System
Gap Detection: Three-candle logic (bullish: low > high ; bearish: high < low ) with ATR-sized minimums (0.15 × ATR default).
Overlap Prevention: Price-range checks stop redundant boxes.
Spacing Control: `fvgMinSpacing` (default 5) avoids stacking from the same impulse.
Storage Caps: Max three FVGs per side unless the user widens the limit.
Session Awareness: Kill zone filters keep taps focused on London/NY if desired.
Auto Cleanup: Boxes delete when price closes beyond their invalidation level.
5. VWAP Magnet + Liquidity Raid Engine
Session or Rolling VWAP: Toggle resets to match intraday or rolling preferences.
Equal High/Low Scanner: Looks back 20 bars by default for liquidity pools.
Displacement Filter: ATR multiplier ensures raids represent genuine liquidity sweeps.
Mean Reversion Focus: Signals fire when price displaces back toward VWAP following a raid.
6. Session Range Breakout System
Initial Balance Tracking: First N bars (15 default) define the session box.
Breakout Logic: Requires simultaneous liquidity spikes, nearby FVG activity, and supportive momentum.
Z-Score Volume Filter: >1.5σ by default to filter noisy moves.
7. Lifestyle Liquidity Scanner
Volume Z-Scores: 50-bar baseline highlights statistically significant spikes.
Smart Money Footprints: Bottom-of-chart squares color-code buy vs sell participation.
Panel Memory: HUD logs the last five raid timestamps, direction, and normalized size.
8. Risk Matrix & Diagnostic HUD
HUD Structure: Table in the top-right summarizes HTF bias, sentiment, momentum, range state, liquidity memory, and current risk references.
Signal Tags: Aggregates SPS, FVG, VWAP, Range, and Liquidity states into a compact string.
Risk Metrics: Swing-based stops (5-bar lookback) + ATR targets (1.5× default) keep risk transparent.
Signal Families & Alerts
Social Pulse (SPS): Volume-confirmed sentiment alignment; triangle markers with “SPS”.
Kill-Zone FVG: Session + HTF alignment + FVG tap; arrow markers plus SL/TP labels.
Local FVG: Captures local reversals when HTF bias has not flipped yet.
VWAP Raid: Equal-high/low raids that snap toward VWAP; “VWAP” label markers.
Range Breakout: Initial balance violations with liquidity and imbalance confirmation; circle markers.
Liquidity Spike: Z-score spikes ≥ threshold; square markers along the baseline.
Visual Design & Customization
Theme Palette: Primary background RGB (12,6,24). Accent shading RGB (26,10,48). Long accents RGB (88,174,255). Short accents RGB (219,109,255).
Stylized Candles: Optional overlay using theme colors.
Signal Toggles: Independently enable markers, heatmap, and diagnostics.
Label Spacing: Auto-spacing enforces ≥4-bar gaps to prevent text overlap.
Customization & Workflow Notes
Adjust ATR/FVG thresholds when volatility shifts.
Re-anchor sentiment to your webhook cadence; EMA smoothing (default 5) dampens noise.
Reposition the HUD by editing the `table.new` coordinates.
Use multiples of the chart timeframe for HTF requests to minimize load.
Session inputs accept exchange-local time; align them to your market.
Performance & Compliance
Pure Pine v6: Single-line statements, no `lookahead_on`.
Resource Safe: Arrays trimmed, boxes limited, `request.security` cached.
Repaint Awareness: Signals confirm on close; alerts mirror on-chart logic.
Runtime Safety: Arrays/loops guard against `na`.
Use Cases
Measure when social sentiment aligns with structure.
Plan ICT-style intraday rebalances around session-specific FVG taps.
Fade VWAP raids when displacement shows exhaustion.
Watch initial balance breaks backed by statistical volume.
Keep risk/target references anchored in ATR logic.
Signal Logic Snapshot
Social Pulse Long/Short: `sentimentEMA` gated by `sentimentMin`, `volSpike`, EMA 8/21 cross, and `momoComposite` sign agreement. Keeps hype tied to structural follow-through.
Kill-Zone FVG Long/Short: Requires session filter, HTF EMA bias alignment, and an active FVG tap (`bullFvgTap` / `bearFvgTap`). Labels include swing stops + ATR targets pulled from `swingLookback` and `liqTargetMultiple`.
Local FVG Long/Short: Uses `localBullish` / `localBearish` heuristics (EMA slope, displacement, sequential closes) to surface intraday reversals even when HTF bias has not flipped.
VWAP Raids: Detect equal-high/equal-low sweeps (`raidHigh`, `raidLow`) that revert toward `sessionVwap` or rolling VWAP when displacement exceeds `vwapAlertDisplace`.
Range Breakouts: Combine `rangeComplete`, breakout confirmation, liquidity spikes, and nearby FVG activity for statistically backed initial balance breaks.
Liquidity Spikes: Volume Z-score > `zScoreThreshold` logs direction, size, and timestamp for the HUD and optional review workflows.
Session Logic & VWAP Handling
Kill zone + NY session inputs use TradingView’s session strings; `f_inSession()` drives both visual shading and whether FVG taps are tradeable when `killZoneOnly` is true.
Session VWAP resets using cumulative price × volume sums that restart when the daily timestamp changes; rolling VWAP falls back to `ta.vwap(hlc3)` for instruments where daily resets are less relevant.
Initial balance box (`rangeBars` input) locks once complete, extends forward, and stays on chart to contextualize later liquidity raids or breakouts.
Parameter Reference
Trend: `emaFastLen`, `emaSlowLen`, `htfResolution`, `htfEmaLen`, `showEmaRibbon`, `showHtfBiasLine`.
Momentum: `tf1`, `tf2`, `tf3`, `rsiLen`, `stochLen`, `stochSmooth`, `heatmapHeight`.
Volume/Liquidity: `volLookback`, `volSpikeMult`, `zScoreLen`, `zScoreThreshold`, `equalLookback`.
VWAP & Sessions: `vwapMode`, `showVwapLine`, `vwapAlertDisplace`, `killSession`, `nySession`, `showSessionShade`, `rangeBars`.
FVG/Risk: `fvgMinTicks`, `fvgLookback`, `fvgMinSpacing`, `killZoneOnly`, `liqTargetMultiple`, `swingLookback`.
Visualization Toggles: `showSignalMarkers`, `showHeatmapBand`, `showInfoPanel`, `showStylizedCandles`.
Workflow Recipes
Kill-Zone Continuation: During the defined kill session, look for `killFvgLong` or `killFvgShort` arrows that line up with `sentimentValid` and positive `momoComposite`. Use the HUD’s risk readout to confirm SL/TP distances before entering.
VWAP Raid Fade: Outside kill zone, track `raidToVwapLong/Short`. Confirm the candle body exceeds the displacement multiplier, and price crosses back toward VWAP before considering reversions.
Range Break Monitor: After the initial balance locks, mark `rangeBreakLong/Short` circles only when the momentum band is >0 or <0 respectively and a fresh FVG box sits near price.
Liquidity Spike Review: When the HUD shows “Liquidity” timestamps, hover the plotted squares at chart bottom to see whether spikes were buy/sell oriented and if local FVGs formed immediately after.
Metadata
Author: officialjackofalltrades
Platform: TradingView (Pine Script v6)
Category: Sentiment + Liquidity Intelligence
Hope you Enjoy!

Dual SMT - Standard & Hidden [Pogiest]General
Smart Money Technique (SMT) involves identifying divergences in a correlated asset triad to predict new phases of price, a shift in market sentiment, and also potential trend reversals. An SMT divergence occurs when one or two assets makes a new high or low, but the other asset or assets does not, signaling a potential shift in market direction. A Hidden SMT Divergence occurs when one or two assets’ closing price closes higher or lower than the other one or two assets’ closing price. However, with potential gaps in price, an opening price can also be the extreme when comparing assets for divergences. Hidden SMT divergence compares the candle bodies while a Standard SMT divergence compares the highs and lows. Both types of SMTs are considered to be cracks in correlation and can be used to identify potential new phases of price whether it be a reversal, retracement, consolidation, and continuation.
Note: Credit of concepts/ideas goes to ICT and TraderDaye.
What Makes This Indicator Unique
The indicator has the ability to display Standard SMTs, Hidden SMTs, or both simultaneously in real-time, tick by tick in the time period selected in a correlated asset triad. Toggle modes for each type of SMT will run independently (runs when enabled) and therefore, optimizes performance. Option to select three different tickers in settings instead of limiting analysis to pairs makes this indicator more versatile. In addition, the indicator has “Invert” toggle options to track both Standard and Hidden SMTs for assets with negative correlations.
Instead of confirming SMT by selecting the number of pivots to look back for detection and confirmation, lines will be plotted on the chart on the first tick it detects a divergence. This can help traders anticipate SMTs in advance and give early warnings instead of waiting for a pivot confirmation. Active lines are displayed on the chart when the indicator identifies a divergence from the current time range to the previous time range in a correlated asset triad. These lines will move dynamically tick by tick on the chart and are anchored to the exact high/lows (Standard SMT) or bodies extremes (Hidden SMT). For inverted symbols, the lines will plot at the inverted anchor points. If new extremes are being made, the lines will move dynamically with the current forming candle for visual precision. During the current time period, the indicator continues to scan for new highs/lows as well as scanning the body high/lows while making line adjustments automatically. Lines will get deleted once the SMT becomes invalid.
The indicator is also designed for consecutive time ranges or cycles. Users are able to select the timeframe to monitor divergences which the indicator has multiple options to choose from including the most used timeframes (i.e. Monthly, Weekly, Daily, 6HR, 4HR, 90M, 1HR, 30M, 15M, etc). For example, if the 90m timeframe is selected, then the indicator will scan for divergences at the extremes in the current 90m cycle and compare the extremes to the previous 90m cycle. The indicator is designed to work when viewing lower timeframes while selecting higher timeframe cycles in settings.
There are four separate alert systems included in this indicator consisting of Standard bull/bear and Hidden bull/bear. Indicator is mode-aware and only triggers when alerts are enabled.
Dynamic Capabilities
Active (Real-Time):
For Standard SMT (High/Low), the indicator scans for divergences using the absolute highs and lows of each candle:
• Bull SMT: Compares the lowest points (wicks included).
• Bear SMT: Compares the highest points (wicks included).
In addition to SMT lines being plotted immediately after detection and lines moving dynamically at new high/low extremes, the indicator will remove the SMT automatically at the first tick it detects the divergence becoming invalid (i.e. all assets made a higher high or lower low in two consecutive time periods). Standard SMT labels are displayed as "SMT - TF" and are anchored to the center of the SMT line.
For Hidden SMT (Bodies), the indicator scans for divergences using only the candle body extremes (open/close, ignoring wicks):
• Bull SMT: Compares the lowest body prices (min of open/close) - divergence based on where bodies close, not wicks.
• Bear SMT: Compares the highest body prices (max of open/close) - divergence based on where bodies close, not wicks.
In addition to SMT lines being plotted immediately after detection and lines moving dynamically following the body high/low extremes, the indicator will remove the SMT automatically once the divergence becomes invalid (i.e. all assets made a higher high or lower low with the body extremes in two consecutive time periods). Hidden SMT labels are displayed as "SMT - TF" and are anchored to the center of the SMT line.
Historical (Fixed Plotting):
Once an SMT divergence (Standard or Hidden) was active and the current time range completes, the SMT line will be plotted and fixed on the chart as a historical line as the new time range starts. When the new time range starts, the cycle resets and the indicator scans for a new active SMT line in the current time range compared to the previous time range. Historical lines are stored for Standard SMT (up to 5) and Hidden SMT (up to 5) for the most recent lines.
Inverse SMT lines (Negative Correlation):
Assets with a negative correlation can be selected in settings with the Invert toggle option selected in settings. SMT divergences for both Standard and Hidden SMTs will be plotted on the chart at their respective anchor points from the previous time cycle to the current time cycle. Lines will behave normally as how it functions when the invert toggle is deselected. However, the lines are inverted on the chart with bullish SMT lines at the highs or bearish SMT lines at the lows.
Usage
Traders can use both types of SMT divergences to anticipate potential reversals in points of interest such as higher timeframe swing points, supply/demand zones, higher timeframe imbalances, key levels, etc. This indicator can also be beneficial in identifying cracks in correlation via Hidden SMT when there are no divergences off the highs and lows. SMT divergences (standard and hidden) can be used as a confirmation tool with other confluences to identify trend direction with respect to points of interest, higher timeframe order-flow, lower timeframe order-flow, etc. In addition, having both a Standard SMT and Hidden SMT divergence display could potentially signal a reversal. It is up to the trader to gauge the price action at the time.
Settings
1. Choose up to three different assets to monitor.
Note: If only two are selected, the indicator will only display the two selected and compare the two assets for divergences.
2. Choose up to one timeframe to monitor.
3. Enable/disable Invert mode.
4. For Standard and Hidden SMT: Enable/disable SMT-Active lines, option to change line style, line width, bull SMT line color, bear SMT line color, and bull/bear label text color.
5. For Standard and Hidden SMT: Enable/disable Historical SMT lines, adjust max historical SMT signals to be displayed (up to 5), option to change line style, line width, bull SMT line color, bear SMT line color, and bull/bear label text color.
6. For Standard and Hidden SMT: Show/hide SMT Labels and adjustable label offset.
7. Shared Label Settings: Adjust label size.
8. Enable/disable SMT Active alerts for Standard and Hidden SMT.
Risk Disclaimer
This indicator is for educational and informational purposes only and does not constitute financial advice. All trading and investment decisions remain solely the responsibility of the user.
Trading involves a high degree of risk, and past performance is not indicative of future results.
Always conduct your own research and consult with a qualified financial professional before making any trading decisions.
By using this indicator, users acknowledge they understand these risks and accept full responsibility for their trading decisions and outcomes.

ICT Asian & London Range + First Presented FVGIndicator: ICT Sessions + First Presented FVG
What it does: This tool automates the markup of key ICT (Inner Circle Trader) timeframes and entry signals. It allows you to trade on higher timeframes (like the 5m or 15m) while the script automatically "looks inside" the 1-minute chart to find specific setups for you.
Key Features:
Session Ranges (Asian & London)
Automatically highlights the Asian Session (8 PM - Midnight NY) and London Open (2 AM - 5 AM NY).
Draws a shaded box for the session's High and Low.
New: Extends the High and Low lines to 4:00 PM NY (end of the trading day) so you can use them as liquidity targets.
The "First Presented" FVG (Sniper Logic)
It detects the very first Fair Value Gap (FVG) that forms on the 1-minute chart immediately after a session starts.
It draws this 1-minute gap on your current chart, regardless of what timeframe you are viewing.
The FVG box automatically extends to the end of the trading day (4 PM NY), showing you where price might return to "mitigate" or react later in the day.

5min ORB - HenryJ5min ORB, for ICT trading
Strategy Implementation: The main goal is to identify and visually mark the trading range established during the first 5 minutes of the regular trading session.
Time Definition: It measures the Highest High and Lowest Low recorded from the session open (minute 0) up to the close of the 5th minute.
Visual Marking: It draws two distinct horizontal line segments on the chart:
One line marks the High of the 5-minute Opening Range.
One line marks the Low of the 5-minute Opening Range.
Drawing Window: The lines are intentionally drawn starting from the 6th minute (after the range is fully established) and extend up to the 60th minute of the trading session. This ensures the lines are available to guide trades for the first hour after the opening volatility subsides.
Labeling: It includes a "5min ORB" text label placed near the high line, clearly identifying the range.
BY Henry J

Range Deviations PRO | Trade SymmetryRange Deviations PRO — Extended Session Levels
An enhanced version of the original Range Deviations by @joshuuu, retaining the full core logic while adding a key upgrade:
🔹 All session ranges, midlines, and deviation levels now extend into the next trading session, giving seamless multi-session context.
Supports Asia, CBDR, Flout, ONS, and Custom Sessions — with options for half/full standard deviations, equilibrium, and range boxes exactly as in the original.
Extending these levels helps identify:
• Liquidity sweeps
• Trap moves / false breaks
• Daily high/low projections
• Premium–discount behavior across sessions
Ideal for traders using ICT concepts who want clearer continuation of session structure into the next day.
Credit: Original logic by @joshuuu — enhancements by TradeSymmetry.
Disclaimer: Educational use only. Not financial advice.

NY 8-11 Statistical Bias NQ 【Donkey】This indicator analyzes historical session patterns to predict directional bias during the NY 8:00-11:00 AM trading window for Micro NQ futures.
Simple Logic:
Monitors 3 sessions: Asian (20:00-02:00), London (02:00-08:00), NY (08:00-11:00)
Identifies current pattern based on: ranges, opening positions, and sweep behaviors
Searches database of 2.080 historical sessions for matching patterns
Displays statistical probability: "X% reached HIGH" vs "Y% reached LOW"
Shows expected drawdown levels for risk management
Example: If pattern shows "77% HIGH bias" → historically, 77 out of 100 similar sessions reached London high during NY 8-11 window.
Key Features
✅ Statistical Database:2.080 real sessions analyzed, 236 unique patterns
✅ 4-Level Pattern Matching: Finds best match with minimum 25 occurrences
✅ Live Bias Display: Shows HIGH% vs LOW% probability in real-time table
✅ Risk Management Zones: Visual drawdown levels (50%, 75%, 90%) + stop-loss suggestion
✅ No Repainting: Calculations made in real-time, no look-ahead bias
✅ Session Visualization: Color-coded boxes for Asian/London/NY ranges
How Pattern Matching Works
5 Components Analyzed:
Asian Range: Above/Below average
London Open: Above/Below Asian 50%
London Sweep: H, L, DH (double high→low), DL (double low→high), N (none)
London Range: Above/Below average
NY Open: Above/Below London 50%
Cascade Search (finds best available match):
Level 1: All 5 components (most specific)
Level 2: 4 components (drops London Range)
Level 3: 3 components (core pattern)
Level 4: 2 components (minimal pattern)
Validity: Only displays patterns with ≥25 historical occurrences.
Interpretation
Bias Table Shows:
Pattern match level (1-4) and historical count
Session characteristics (ranges, sweeps, positions)
TOTAL HIGH % = probability of reaching London high
TOTAL LOW % = probability of reaching London low
Bias strength: ⭐⭐⭐ STRONG (≥70%), ⭐⭐ MEDIUM (60-69%), ⭐ WEAK (<60%)
Drawdown Zones (for winning trades):
🟢 Green: 50% of winners stayed within this level
🟡 Yellow: 75% of winners stayed within this level
🟠 Orange: 90% of winners stayed within this level
🔴 Red Line: Suggested stop-loss (95th percentile + buffer)
Settings
Fully Customizable:
Timezone selection (auto-detects sessions correctly)
Minimum session threshold (default: 25)
Toggle boxes, lines, labels, drawdown zones
Complete color customization
Table size and position
Best Use Cases
✅ Optimal Setup:
Instrument: Micro NQ (MNQ) futures
Timeframe: Only 1-minute
Timezone: America/New_York
Historical data: 8+ years loaded
✅ Trading Approach:
Wait for pattern confirmation (≥25 sessions)
Prefer STRONG bias (≥70%) for higher confidence
Use drawdown zones for stop placement
Combine with price action confirmation
Avoid major news events (FOMC, NFP)
⚠️ Required Disclaimers
IMPORTANT RISK WARNINGS:
Past Performance ≠ Future Results: Historical statistics do NOT guarantee future outcomes
Not Financial Advice: Educational tool for statistical analysis only
Risk of Loss: Futures trading involves substantial risk of loss
No Guarantees: Individual trades WILL result in losses regardless of percentages shown
Requires Knowledge: Best for traders familiar with session analysis and risk management
Instrument-Specific: Optimized for Micro NQ - test before using elsewhere
Never risk more than you can afford to lose. Always use proper risk management.

Position Size Calculator + Live R/R Panel — SMC/ICT (@PueblaATH)Position Size + Live R/R Panel — SMC/ICT (@PueblaATH)
Position Size + Live R/R Panel — SMC/ICT (@PueblaATH) is a professional-grade risk management and execution module built for Smart Money Concepts (SMC) and ICT Traders who require accurate, repeatable, institution-style trade planning.
This tool delivers precise position sizing, R:R modeling, leverage and margin projections, fee-adjusted PnL outcomes, and real-time execution metrics—all directly on the chart. Optimized for crypto, forex, and futures, it provides scalpers, day traders, and swing traders with the clarity needed to execute high-quality trades with confidence and consistency.
What the Indicator Does
Institutional Position Sizing Engine
Calculates position size based on account balance, % risk, and SL distance.
Supports custom minimum lot size rounding across crypto, FX, indices, and derivatives.
Intelligent direction logic (Auto / Long / Short) based on SMC/ICT structure.
Advanced Risk/Reward & Profit Modeling
Real-time R:R ratio using actual rounded position size.
Live PnL readout that updates with price movements.
Gross & net profit projections with full fee deduction.
Execution Planning with Draggable Levels
Entry, SL, and TP levels fully draggable for fast scenario modeling.
Automatic projected lines backward/forward with clean label alignment.
TP and SL tags include % movement from Entry, ideal for SMC/ICT journaling.
Precise modeling of real exchange fee structures
Maker fee per side
Taker fee per side
Mixed fee modes (Maker entry, Taker exit, Average, etc.)
Leverage & Margin Forecasting
Margin requirements displayed for 3 customizable leverage settings.
Helps traders understand capital commitment before executing the trade.
Useful for futures, crypto perps, and CFD setups.
Clean HUD Panel for Rapid Decision-Making
A full professional trading panel displays:
Target & actual risk
Position size
Entry / SL / TP
TP/SL percentage distance
Gross profit
Net profit (after fees)
Fees @ TP and @ SL
Live PnL
Margin requirements
Optimized for SMC & ICT Workflows
Perfect for traders using:
Breakers, FVGs, OBs
Liquidity sweeps
Session models
Precision entries (OTE, Displacement, Rebalancing)
Leverage-based execution (crypto perps, futures)
How to Use It
Attach the indicator to your chart.
Set account balance, risk %, fee model, and leverage presets.
Drag Entry, SL, and TP to shape the setup.
View instant calculations of: Position size; R:R; Net PnL after fees; Margin required
Use it as your pre-trade checklist & execution model.
Originality & Credits
This script is an original creation by @PueblaATH, released under the MPL 2.0 license.
It does not copy, modify, or repackage any existing TradingView code.
All logic—including the fee engine, margin calculator, responsive HUD, dynamic risk model, and visual execution system—is authored specifically for this indicator.

Volumetric Inverse Fair Value Gap (IFVG) [Kodexius]The Volumetric Inverse Fair Value Gap (IFVG) indicator detects and visualizes inverse fair value gaps (IFVGs) zones where previous inefficiencies in price (fair value gaps) are later invalidated or “inverted.”
Unlike traditional FVG indicators, this tool integrates volume-based analysis to quantify the bullish, bearish, and overall strength of each inversion. It visually represents these metrics within a dynamically updating box on the chart, giving traders deeper insight into market reactions when liquidity imbalances are filled and reversed.
Features
Inverse fair value gap detection
The script identifies bullish and bearish fair value gaps, stores them as pending zones, and turns them into inverse fair value gaps when price trades back through the gap in the opposite direction. Each valid inversion becomes an active IFVG zone on the chart.
Sensitivity control with ATR filter and strict mode
A minimum gap size based on ATR is used to filter out small and noisy gaps. Strict mode can be enabled so that any wick contact between the relevant candles prevents the gap from being accepted as a fair value gap. This lets you decide how clean and selective the zones should be.
Show Last N Boxes control
The indicator can keep only the most recent N IFVG zones visible. Older zones are removed from the chart once the number of active objects exceeds the user setting. This prevents clutter on higher timeframes or long histories and keeps attention on the most relevant recent zones.
Ghost box for the original gap
When the ghost option is enabled, the script draws a faint box that marks the original fair value gap from which the inverse zone came. This makes it easy to see where the initial imbalance appeared and how price later inverted that area.
Volumetric bull, bear and strength metrics
For each IFVG, the script estimates how much of the bar volume is associated with buying and how much with selling, then computes bull percentage, bear percentage and a strength score that uses a percentile rank of volume. These values are stored with the IFVG object and drive the visualization inside the zone.
Three band visual layout inside each IFVG
Each active IFVG is drawn as a container with three horizontal sections. The top band represents the bull percentage, the middle band the bear percentage and the bottom band the strength metric. The width of each bar reflects its respective value so you can read the structure of the zone at a glance.
Customizable colors and label text
Colors for bull, bear, strength, the empty background area, the ghost box and label text can be adjusted in the inputs. This allows you to match the indicator to different chart themes or highlight specific aspects such as strength or direction.
Automatic invalidation and cleanup
When price clearly closes beyond the IFVG in a way that breaks the logic of that zone, the script marks it as inactive and deletes all boxes and labels linked to it. Only valid and active IFVGs remain on the chart, which keeps the display clean and focused.
Calculations
1. Detecting Fair Value Gaps (FVGs)
A fair value gap is identified when price action leaves an imbalance between candle wicks. Depending on the mode:
Bullish FVG: When low > high
Bearish FVG: When high < low
Optionally, the strict mode ensures wicks do not touch.
The gap’s significance is filtered using the ATR multiplier input to exclude minor noise.
Once detected, FVGs are stored as pending zones until inverted by opposite movement (price crossing through).
bool bull_cond = strict_mode ? (low > high ) : (close > high )
bool bear_cond = strict_mode ? (high < low ) : (close < low )
float gap_size = 0.0
if bull_cond and close > open
gap_size := low - high
if bear_cond and close < open
gap_size := low - high
2. Creating IFVGs (Inversions)
When price later moves through a previous FVG in the opposite direction, an Inverse FVG (IFVG) is created.
For example:
A previous bearish FVG becomes bullish IFVG if price moves upward through it.
A previous bullish FVG becomes bearish IFVG if price moves downward through it.
The IFVG is initialized with structural boundaries (top, bottom) and timestamp metadata to anchor visualization.
if not p.is_bull_gap and close > p.top
inverted := true
to_bull := true
if p.is_bull_gap and close < p.btm
inverted := true
to_bull := false
3. Volume Metrics (Bull, Bear, Strength)
Each IFVG calculates buy and sell volumes from the current bar’s price spread and total volume.
Bull % = proportion of upward (buy) volume
Bear % = proportion of downward (sell) volume
Strength % = normalized percentile rank of total volume
These are obtained through a custom function that estimates directional volume contribution:
calc_metrics(float o, float h, float l, float c, float v) =>
float rng = h - l
float buy_v = 0.0
if rng == 0
buy_v := v * 0.5
else
if c >= o
buy_v := v * ((math.abs(c - o) + (math.min(o, c) - l)) / rng)
else
buy_v := v * ((h - math.max(o, c)) / rng)
float sell_v = v - buy_v
float total = buy_v + sell_v
float p_bull = total > 0 ? buy_v / total : 0
float p_bear = total > 0 ? sell_v / total : 0
float p_str = ta.percentrank(v, 100) / 100.0

ICT Concept MTF Scanner [Elykia]ICT Concept MTF Scanner
Overview
The ICT Concept MTF Scanner is the ultimate productivity dashboard for traders using SMC (Smart Money Concepts) and ICT methodologies.
Stop switching tabs constantly. This indicator allows you to monitor the market structure (Trend, BOS, CHoCH) of 20 different assets simultaneously, each with its own custom timeframe.
It also overlays the structural points and Premium/Discount zones directly on your current chart.
Key Features:
📊 Multi-Asset Dashboard: Monitor up to 20 symbols (Indices, Forex, Crypto, Metals) in a single, fully customizable table.
clock: Individual Timeframes: Unlike standard screeners, you can set a different timeframe for each ticker (e.g., NQ on 15m, ES on 1h, DXY on 4h).
🧠 Auto-Structure Detection:
BOS (Break of Structure): Trend continuation.
CHoCH (Change of Character): Trend reversal signal.
SMS (Shift in Market Structure): Failure swing.
⚖️ Premium & Discount Zones: Automatically calculates buying (Discount) and selling (Premium) zones based on the Active or Previous range.
🔔 Smart Alerts: Get notified on structural changes or when price enters a Premium/Discount zone.
How to use:
1. Ticker Setup: In the settings, select your favorite assets and assign the specific timeframe you want to monitor for each.
2. Sensitivity (Structure): Adjust the "Period" (Pivot Length). A lower value (e.g., 3-5) detects minor structure, while a higher value (e.g., 10-20) reveals the macro trend.
3. Reading the Table:
Teal: Bullish Structure.
Red: Bearish Structure.
Signal: Shows the most recent structural event (BOS or CHoCH).
Disclaimer :
This indicator is for educational and informational purposes only. Past performance does not guarantee future results. Trade at your own risk.

SMT Alert MTF [Elykia]SMT Alert MTF - Smart Money Divergence Scanner
Overview
The SMT Alert MTF is an essential productivity tool for traders applying ICT (Inner Circle Trader) and SMC (Smart Money Concepts).
An SMT divergence ("Smart Money Technique") is one of the most powerful signals to confirm a trend reversal or market manipulation. It occurs when two highly correlated assets (e.g., Nasdaq and S&P500) move out of sync.
Instead of monitoring 3 different charts across 5 different timeframes manually, this indicator scans everything in the background and alerts you the moment a divergence appears.
💎 The Strategy: How to trade SMT?
SMT is not a blind entry signal; it is a confirmation tool.
1. The Context: Wait for price to reach a Key Level (POI, Order Block) or perform a Liquidity Sweep.
2. The Signal (Desynchronization):
Bullish SMT: Asset A makes a Lower Low, but correlated Asset B makes a Higher Low (Refusal to go lower). This indicates institutional accumulation.
Bearish SMT: Asset A makes a Higher High, but correlated Asset B makes a Lower High (Weakness). This indicates distribution.
Execution: Once the SMT alert triggers on your timeframe (e.g., M1 or M5), look for a Change of Character (CHoCH) to enter the trade.
Key Features & Benefits
⚡ Multi-Timeframe Scanner (MTF): Monitor up to 5 timeframes simultaneously (e.g., 1m, 5m, 15m, 1h, 4h) on a single chart.
🔄 Smart Asset Detection: The script automatically recognizes your current chart and selects the relevant comparison assets:
Trading NQ (Nasdaq) -> Compares with ES (S&P500).
Trading 6E (Euro) -> Compares with 6B (British Pound).
Trading Gold -> Compares with Silver.
(You can also manually override with any symbol).
👀 Visual Clarity: A divergence line is drawn directly on price action (Red for Bearish, Blue for Bullish) labeled with the divergent ticker.
🔔 Comprehensive Alerts: Set up specific alerts for each timeframe (e.g., "Alert me only for M5 or M15 SMT").
Recommended Settings
1. Enable M1, M5, and M15 timeframes for intraday scalping.
2. Keep the automatic symbol detection enabled for Indices and Futures.
⚠️ DISCLAIMER
This indicator is for educational purposes only. Trading involves a high level of risk. SMT divergences should be used in confluence with other technical analysis factors. The author is not responsible for any financial losses.

FVG-BPR-Candle Volume-v2 [Elykia]FVG-BPR & Volume Z-Score - SMC Enhanced
This indicator is a complete toolkit for traders using Smart Money Concepts (SMC) and Price Action analysis. It combines three essential elements to identify high-probability zones: Price Inefficiencies (FVG), Balanced Price Ranges (BPR), and Statistical Volume Anomalies (Z-Score).
The goal is simple: Stop trading "blind" levels and start validating every institutional zone with real volume activity.
Key Features
1. 📊 Volume Z-Score (Statistical Analysis):
Colors candles based on volume intensity relative to its historical average (Bollinger/Standard Deviation logic).
Yellow Candles (Z-Score > 2): High volume, significant activity.
Red Candles (Z-Score > 3): Extreme volume, often a sign of "Capitulation" or major impulse.
Circles Option: Displays a circle on extreme candles for enhanced visibility.
2. ⚡ Fair Value Gaps (FVG):
Automatically detects imbalance zones (Buy-side & Sell-side).
Multi-Timeframe (MTF): Ability to display FVGs from a higher timeframe on your current chart (e.g., H1 FVG on M5 chart).
Dynamic Management: Zones automatically delete once filled (mitigated) to keep the chart clean.
3. 🔄 Balanced Price Ranges (BPR):
Identifies zones where a Bullish FVG and a Bearish FVG overlap.
This is a strong institutional signature indicating aggressive re-pricing. BPRs often act as more reliable support/resistance zones than simple FVGs.
💎 Strategy: "Volume-Backed Rebalancing"
This strategy uses the confluence between SMC structure (FVG/BPR) and Volume confirmation.
1. Zone Identification: Wait for price to form a clear BPR or FVG (M15 or H1 recommended).
2. The Retest (Pullback): Wait for price to return to test this zone. Do not enter blindly (Limit Order), wait for the reaction.
3. Volume Confirmation:
Observe the candle colors within the zone.
If price hits the FVG and a Yellow or Red candle (Volume Z-Score) appears rejecting the zone, this is your signal.
This indicates that institutions are actively defending this level.
4. Entry & Exit: Enter at the close of the volume candle. Place Stop Loss below the FVG/BPR. Target the next liquidity pool (Previous High/Low).
⚠️ DISCLAIMER
This script and the strategy described are provided for educational and research purposes only. Trading financial markets (Forex, Crypto, Indices, Futures) involves a high level of risk and may not be suitable for all investors. You may lose all or part of your initial capital.
Past performance is not indicative of future results. The author implies no guarantee of profit or protection from loss. Use this tool at your own risk and always perform your own analysis before taking a position.

DWM HLOC, Mid & WicksSimple, yet effective.
1. Automatically calculate and projects key price levels from a previous period (Yesterday, OR Last Week / Month) onto the current trading session. It acts as an immediate Support & Resistance map based on historical price action.
2. Multi-Timeframe Logic
Modes --
Daily Mode: Projects yesterday's data onto today.
Weekly Mode: Projects last week's data onto the current week.
3. Key Levels Visualized The script calculates seven distinct price levels:
OHLC: Previous Open, High, Low, and Close.
Equilibrium (Mid): The exact 50% mark between the previous High and Low.
Wick Midpoints (New):
Upper Wick 50%: The midpoint between the High and the top of the body.
Lower Wick 50%: The midpoint between the Low and the bottom of the body.
4. Smart "Gap" Visualization The script uses unique starting points to help traders visualize market gaps:
Standard Levels (High, Low, Open, Mids): These lines originate from the Previous Period's Open, showing the full context of the level relative to time.
Close Level: This line originates from the Current Period's Open. This visually highlights the "Gap" (the jump in price between where the market closed previously and where it opened today).
5. Full Customization
Aesthetics: Every line can be individually toggled on/off.
Styling: Users can independently change the color, line style (Solid, Dotted, Dashed), and thickness for every specific level.

Quarterly Theory (Lé Modél) 🧪 [Ultimate +] | cephxsQUARTERLY THEORY (LÉ MODÉL) 🧪
SSMT + Timed Structural Swing Points + Alerts
This is mostly types using voice typing so the punctuation might be off.
This indicator uses public domain information based on a trading system called "Quarterly Theory" by TraderDaye & ICT. All concepts are freely available educational material that's been around for years. I just built a tool to visualize it properly.
WHAT IS THIS?
Alright so basically this is my attempt (pretty good attempt I'd say) at building the ultimate quarterly theory tool. It tracks multiple timeframe cycles (monthly, weekly, daily, 90m, and micro) and detects when correlated assets are diverging from each other at key swing points. That's the SSMT (sequential smt) part otherwise called an Offset Divergence either in an Accumulation/distribution phase of price.
On top of that, it finds timed structural swing points with their exact formation times, detects liquidity purges, and confirms change in state of delivery (CISD) through orderblock reclaims. Everything is wrapped in a pretty comprehensive alert system so you can actually trade off this stuff without staring at charts 24/7.
CORE FEATURES
Multi-Cycle SSMT Detection: tracks divergences across 5 nested cycles - monthly, weekly, daily, 90m, and micro. each cycle has its own visibility gates so you're only seeing what's relevant to your chart timeframe. They are also customizable so you are not restricted to what I think is best; nevertheless, hard gates are put in place to prevent unnecessary data calls too far back into history to allow users of all plans to use without errors (Bar data limits)
Timed Swing Points: every pivot high/low gets timestamped. you'll see exactly when the swing formed - super useful for macro window analysis (those :00-:10 and :50-:00 minute windows).
Liquidity Purges: automatically detects when price sweeps a previous swing high/low and reverses. shows both the sweep level and confirmation.
CISD (Change In State of Delivery): finds the stretch candle at pivots and waits for price to reclaim it. that's your delivery change confirmation.
Auto Asset Detection: just throw it on any chart and it figures out the correlated assets for you. works with indices ( CME_MINI:NQ1! , CME_MINI:ES1! , CBOT_MINI:YM1! ), forex majors ( FOREXCOM:EURUSD , FOREXCOM:GBPUSD ), metals ( FOREXCOM:XAUUSD , FOREXCOM:XAGUSD ), crypto, and more.
Normal + Hidden Divergences: normal divergence is when extremes diverge between assets. hidden divergence uses body closes instead of wicks - sometimes catches moves that normal misses.
Comprehensive Alert System: atomic alerts for individual events, preset combos for multi-confluence setups, and a custom "alert kitchen" to build your own conditions.
Each of these features can be visually disabled individually while the logic is still computed and alerts still function without bother.
THE CYCLES EXPLAINED
quarterly theory breaks time down into nested fractal cycles. each cycle divides into 4 quarters (Q1, Q2, Q3, Q4) where Q2 is typically expansion/displacement:
Monthly Cycle: tracks the 4 weeks of the month. best viewed on 4H charts and above
Weekly Cycle: Mon-Tue-Wed-Thu-Fri as the 5 "quarters". best on 1H charts.
Daily Cycle: the trading day split into 4 sessions (asia, london, ny am, ny pm). best on 15m.
90m Cycle: 6 x 90-minute windows throughout the day. best on 3-5m charts.
Micro Cycle: 22.5-minute quarters within each 90m block. 1m charts only.
Tried to implement a new Quarterly Cycle, will defer that to a later update.
VISIBILITY GATES
the indicator automatically shows/hides cycles based on your chart timeframe. here's how it works:
Auto Mode (recommended):
Micro: 1m only
90m: 3m-5m
Daily: 15m only
Weekly: 1H only
Monthly: 4H only
Extended Mode (more flexibility):
Micro: 1m-3m
90m: 1m-30m
Daily: 5m-1H
Weekly: 15m-4H
Monthly: 4H-1D
you can also set custom ranges or just show everything with "All" mode.
INPUTS BREAKDOWN
Visual Preset
All Features: shows everything - SSMT, time labels, CISD, purges
SSMT + TIME + CISD: hides purge lines for cleaner charts
SSMT + CISD: hides time labels too
SSMT Only: just the divergence lines, nothing else
SSMT Plots (Section 2)
Extreme Detection Mode: "Normal" uses wick extremes, "Hidden" uses body closes, "All" shows both
Per-Cycle Toggles: enable/disable each cycle independently with custom colors
Label Styling: choose between "Cycle + Asset", "Cycle" only, or "Asset" only labels
Pivot Detection (Section 3)
Sensitivity: controls how many bars on each side to confirm a swing (default: 2)
Maximum Points: limits how many pivots are displayed
Pivot Labels (Section 4)
Show Time Labels: displays the exact timestamp of each swing
Key Times Only: only shows labels for swings in macro windows (:00-:10, :24-:36, :50-:59)
Macro Colors: special highlighting for pivots during macro windows
Purge Detection (Section 5-6)
Pending Timeout: how many bars a purge can wait for confirmation before being discarded
Strict Key Time: requires both the sweep AND confirmation to be in key time windows
Dotted Line Offset: how far the confirmation line extends past the reversal candle
CISD Detection (Section 7-8)
Size Filter: filters out tiny orderblocks using ATR-based sizing. options from "Really Small" (shows most) to "Juicy" (only big ones)
Pending Timeout: bars before an unconfirmed CISD expires
Exhaustive Mode: shows all valid CISDs instead of limiting to max count
ALERT SYSTEM
this is where it gets powerful. three tiers of alerts:
Atomic Alerts (individual events):
Swing High/Low formed
Bearish/Bullish Purge confirmed
CISD Confirmed/Pending
Purge + CISD Combo
Preset Combos (multi-confluence):
M/W/D/90/Micro SSMT + CISD: fires when SSMT divergence is active AND CISD confirms in matching direction
Require Matching Purge: adds purge to the combo requirement
Stacked Alerts: triggers when 2+ cycles align simultaneously
Alert Kitchen (custom builder):
build your own combo by selecting:
Which SSMT cycle (with direction: bullish/bearish/any)
Whether CISD is required
Whether matching purge is required
Purge tolerance (how close the purge pivot needs to be)
Session Filter:
all alerts can be filtered to only fire during specific sessions:
Asia: 18:00-00:00 ET
London: 02:00-05:00 ET
NY AM: 08:30-12:00 ET
NY PM: 13:30-16:00 ET
Custom time ranges
AUTO ASSET DETECTION
the indicator uses the AssetCorrelation library to automatically figure out which assets to compare. here's what it supports:
US Indices: CME_MINI:NQ1! , CME_MINI:ES1! , CBOT_MINI:YM1! (or micros MNQ/MES/MYM)
Forex Majors: FOREXCOM:EURUSD , FOREXCOM:GBPUSD vs TVC:DXY
Metals: FOREXCOM:XAUUSD , FOREXCOM:XAGUSD , Copper
Energy: CL (crude), RB (gasoline), HO (heating oil)
Crypto: BTC, ETH, TOTAL3 as triad
EU Indices: GER40, EU50, UK100, ESP35
you can also disable auto mode and manually configure your own asset triads/dyads.
STATUS BAR
optional horizontal bar showing which SSMT cycles are currently active. displays M | W | D | 90m | Micro with color coding:
Blue = bullish divergence active
Red = bearish divergence active
Gray = neutral (no divergence)
Purple = both directions active simultaneously (sandwich)
RECOMMENDED USAGE
start with "Auto" timeframe gating - it shows the right cycles for your chart
focus on cycles that align with your trading style (scalpers: 90m/micro, swing: daily/weekly)
use CISD confirmation before entries - divergence alone isn't enough (at least for me)
Pair with True Opens to align properly (This is a trading model in itself)
set up preset alerts for your main setup (e.g., "D SSMT + CISD" on 15m chart)
filter alerts to your active trading session to reduce noise
TIMEFRAME CHEAT SHEET
1m: Micro cycle + 90m context
3-5m: 90m cycle + Daily context
15m: Daily cycle + Weekly context
1H: Weekly cycle + Monthly context
4H: Monthly cycle only
FAQ
why don't i see any SSMT lines?
check your timeframe gating mode. if you're on a 15m chart with "Auto" mode, you'll only see Daily cycle. switch to "Extended" or "All" to see more cycles.
what's the difference between normal and hidden divergence?
normal uses wick highs/lows, hidden uses body closes. hidden can catch divergences that wicks miss, but it's also noisier.
Why do some CISDs not confirm?
the stretch candle needs to be reclaimed by price within the timeout window. if price never comes back to that level, the CISD expires.
can i use this on stocks?
technically yes, but you'll need to manually configure your asset pairs since auto-detection focuses on futures/forex/crypto.
DISCLAIMER
this is an educational tool, not financial advice. quarterly theory, SSMT, and all related concepts are based on publicly available information from TraderDaye and ICT methodology on X with a touch of my own discoveries too.
past performance doesn't guarantee future results. always use proper risk management and never trade more than you can afford to lose. the indicator is provided as-is with no guarantees.
do your own backtesting before using this in live markets.
CREDITS
Quarterly Theory concepts: TraderDaye & ICT
AssetCorrelation library: fstarcapital
Development: cephxs & fstarcapital community
CHANGELOG
Ultimate +: added Alert Kitchen, stacked cycle alerts, session filtering, status bar, size-filtered CISD
Pro +: added hidden divergences, added sweep detection/plots, auto asset detection, preset combos
Base: initial release with core SSMT and pivot time labels
No form of this Library is to be sold in any capacity as part of any service / indicator on the TradingView Platform or elsewhere by anyone else but me.
Otherwise it is completely free to use in private and public open/closed source indicators.
Sidenote: 3rd upload because I'm trying to get the thumbnail right :(
Made with ❤️ from cephxs

AssetCorrelationLibraryLibrary "AssetCorrelationLibrary™"
detectIndicesFutures(ticker)
Detects Index Futures (NQ/ES/YM/RTY + micro variants)
Parameters:
ticker (string) : The ticker string to check (typically syminfo.ticker)
Returns: AssetPairing with secondary and tertiary assets configured
detectMetalsFutures(ticker)
Detects Metal Futures (GC/SI/HG + micro variants)
Parameters:
ticker (string) : The ticker string to check
Returns: AssetPairing with secondary and tertiary assets configured
detectForexFutures(ticker)
Detects Forex Futures (6E/6B + micro variants)
Parameters:
ticker (string) : The ticker string to check
Returns: AssetPairing with secondary and tertiary assets configured
detectEnergyFutures(ticker)
Detects Energy Futures (CL/RB/HO + micro variants)
Parameters:
ticker (string) : The ticker string to check
Returns: AssetPairing with secondary and tertiary assets configured
detectTreasuryFutures(ticker)
Detects Treasury Futures (ZB/ZF/ZN)
Parameters:
ticker (string) : The ticker string to check
Returns: AssetPairing with secondary and tertiary assets configured
detectForexCFD(ticker, tickerId)
Detects Forex CFD pairs (EUR/GBP/DXY, USD/JPY/CHF triads)
Parameters:
ticker (string) : The ticker string to check
tickerId (string) : The full ticker ID (syminfo.tickerid) for primary asset
Returns: AssetPairing with secondary and tertiary assets configured
detectCrypto(ticker, tickerId)
Detects major Crypto assets (BTC, ETH, SOL, XRP, alts)
Parameters:
ticker (string) : The ticker string to check
tickerId (string) : The full ticker ID for primary asset
Returns: AssetPairing with secondary and tertiary assets configured
detectMetalsCFD(ticker, tickerId)
Detects Metals CFD (XAU/XAG/Copper)
Parameters:
ticker (string) : The ticker string to check
tickerId (string) : The full ticker ID for primary asset
Returns: AssetPairing with secondary and tertiary assets configured
detectIndicesCFD(ticker, tickerId)
Detects Indices CFD (NAS100/SP500/DJ30)
Parameters:
ticker (string) : The ticker string to check
tickerId (string) : The full ticker ID for primary asset
Returns: AssetPairing with secondary and tertiary assets configured
detectEUStocks(ticker, tickerId)
Detects EU Stock Indices (GER40/EU50) - Dyad only
Parameters:
ticker (string) : The ticker string to check
tickerId (string) : The full ticker ID for primary asset
Returns: AssetPairing with secondary asset configured (tertiary empty for dyad)
getDefaultFallback(tickerId)
Returns default fallback assets (chart ticker only, no correlation)
Parameters:
tickerId (string) : The full ticker ID for primary asset
Returns: AssetPairing with chart ticker as primary, empty secondary/tertiary (no correlation)
applySessionModifierWithBackadjust(tickerStr, sessionType)
Applies futures session modifier to ticker WITH back adjustment
Parameters:
tickerStr (string) : The ticker to modify
sessionType (string) : The session type (syminfo.session)
Returns: Modified ticker string with session and backadjustment.on applied
applySessionModifierNoBackadjust(tickerStr, sessionType)
Applies futures session modifier to ticker WITHOUT back adjustment
Parameters:
tickerStr (string) : The ticker to modify
sessionType (string) : The session type (syminfo.session)
Returns: Modified ticker string with session and backadjustment.off applied
isTriadMode(pairing)
Checks if a pairing represents a valid triad (3 assets)
Parameters:
pairing (AssetPairing) : The AssetPairing to check
Returns: True if tertiary is non-empty (triad mode), false for dyad
getAssetTicker(tickerId)
Extracts clean ticker string from full ticker ID
Parameters:
tickerId (string) : The full ticker ID (e.g., "BITGET:BTCUSDT.P")
Returns: Clean ticker string (e.g., "BTCUSDT.P")
resolveTriad(chartTickerId, pairing)
Resolves triad asset assignments with proper inversion flags
Parameters:
chartTickerId (string) : The current chart's ticker ID (syminfo.tickerid)
pairing (AssetPairing) : The detected AssetPairing
Returns: Tuple
resolveDyad(chartTickerId, pairing)
Resolves dyad asset assignment with proper inversion flag
Parameters:
chartTickerId (string) : The current chart's ticker ID
pairing (AssetPairing) : The detected AssetPairing (dyad: tertiary is empty)
Returns: Tuple
resolveAssets(ticker, tickerId, assetType, sessionType, useBackadjust)
Main auto-detection entry point. Detects asset category and returns fully resolved config.
Parameters:
ticker (string) : The ticker string to check (typically syminfo.ticker)
tickerId (string) : The full ticker ID (typically syminfo.tickerid)
assetType (string) : The asset type (typically syminfo.type)
sessionType (string) : The session type for futures (typically syminfo.session)
useBackadjust (bool) : Whether to apply back adjustment for futures session alignment
Returns: AssetConfig with fully resolved assets, inversion flags, and detection status
resolveCurrentChart()
Simplified auto-detection using current chart's syminfo values
Returns: AssetConfig with fully resolved assets, inversion flags, and detection status
AssetPairing
Core asset pairing structure for triad/dyad configurations
Fields:
primary (series string) : The primary (chart) asset ticker ID
secondary (series string) : The secondary correlated asset ticker ID
tertiary (series string) : The tertiary correlated asset ticker ID (empty for dyad)
invertSecondary (series bool) : Whether secondary asset should be inverted for divergence calc
invertTertiary (series bool) : Whether tertiary asset should be inverted for divergence calc
AssetConfig
Full asset resolution result with mode detection and computed values
Fields:
detected (series bool) : Whether auto-detection succeeded
isTriadMode (series bool) : True if triad (3 assets), false if dyad (2 assets)
primary (series string) : The resolved primary asset ticker ID
secondary (series string) : The resolved secondary asset ticker ID
tertiary (series string) : The resolved tertiary asset ticker ID (empty for dyad)
invertSecondary (series bool) : Computed inversion flag for secondary asset
invertTertiary (series bool) : Computed inversion flag for tertiary asset
assetCategory (series string) : String describing the detected asset category
Note to potential users.
I did not really intend to make this public but i have to in order to avoid any potential compliance issues with the TradingView Moderation Team and the House Rules.
However if you are to use this library, you cannot make your code closed source / invite only as it is intellectual property. The only exception to this is if I am credited in the header of your code and i explicitly give permission to do so.
As per the TradingView house rules, you are completely FREE to do with this as you like, provided the script stays private.
Use the @fstarcapital tag to give credits
❤️ from cephxs

Smart Money Setup 08 [TradingFinder] Binary Options Gold Scalper🔵 Introduction
In the Smart Money methodology, the market is understood as a structure driven by liquidity flow. This structure forms through the movement of large orders, the accumulation of liquidity, and the reactions that occur around key price zones. The logic of Smart Money is based on the idea that price movement is not random and usually evolves with the intention of collecting liquidity and creating price inefficiencies known as imbalances.
Within this framework, several important stages including the liquidity sweep, the formation of a point of interest, the appearance of an imbalance and the transition of market structure play major roles and collectively define the broader direction of price.
In many bullish scenarios, the market begins by sweeping sell side liquidity and targeting important lows in order to collect the liquidity resting below them. This liquidity collection often becomes the starting point for creating a point of interest which usually marks the area where Smart Money begins to enter the market.
After price moves away from this point, it breaks a structural high and forms a change of character. This shift marks a transition in the balance of power between buyers and sellers and is considered the first clear signal that the market structure is changing.
After the change of character, new institutional order flow often creates a strong and rapid movement that leaves behind an imbalance. This imbalance is one of the most important elements in Smart Money analysis because price tends to return to this area in order to complete structure and restore balance.
The return into the imbalance becomes meaningful when it occurs together with the liquidity sweep, the presence of a validated point of interest and a confirmed structural transition. These conditions frequently mark the beginning of powerful movements within the Smart Money cycle.
Understanding the sequence of liquidity, point of interest, imbalance, change of character and market structure builds the foundation of Smart Money analysis and provides a clear view of the true direction of institutional strength.
Bullish Setup :
Bearish Setup :
🔵 How to Use
To use this framework effectively, the trader must analyze the market through the principles of Smart Money and observe how liquidity drives price. A trade becomes valid only when several essential components appear together in a clear and consistent order.
These components include the liquidity sweep, the formation of a point of interest, the confirmation of a change of character, the transition of market structure and the return of price into an imbalance. The method is built on the understanding that the market first collects liquidity, then shifts order flow and finally provides an entry opportunity inside an inefficient area or inside a point of interest.
For this reason, the trader must follow the path of liquidity from the moment the sweep occurs, through the point of interest and the change of character and finally into the return of price toward the imbalance. When applied correctly, this approach creates entries that are more precise, more structural and more aligned with the real behavior of the market rather than with superficial signals.
🟣 Long Position
A bullish setup in Smart Money structure begins with a liquidity sweep on the sell side. The market first targets the areas where sell side liquidity is located and collects the stops and resting liquidity under previous lows. This collection is the condition that Smart Money requires to begin creating a new order flow. After this liquidity has been taken, a point of interest forms which is usually the last bearish candle or the effective demand zone that initiated the upward movement.
Price then moves away from the point of interest and breaks a structural high which creates a change of character. This event confirms that the market structure has moved from a bearish state to a bullish one and that buying pressure has taken control of the order flow. Following this shift, a strong upward movement often occurs and creates an imbalance between candles. This imbalance reflects the entrance of strong Smart Money orders and is seen as an important confirmation of bullish strength.
When price returns to this imbalance after the displacement, the market enters a phase where Smart Money aims to complete the corrective movement and continue the upward direction. The reaction inside the imbalance when combined with the liquidity sweep, the confirmed point of interest and the change of character completes the bullish setup and forms a structure that often leads to a continuation of the bullish trend.
🟣 Short Position
A bearish setup follows the same Smart Money logic but in the opposite direction. The market begins by collecting buy side liquidity and targets the highs where buy side liquidity and resting stops are located. This liquidity sweep on the buy side becomes the starting phase for Smart Money to initiate a downward order flow. After the liquidity is collected, a bearish point of interest forms which is usually the last bullish candle or the supply zone that created the initial drop.
Price then moves away from this point and breaks the first structural low. This creates a change of character to the downside which confirms that the market structure has transitioned from bullish to bearish and that selling pressure has gained control. After this shift, a strong downward displacement appears and leaves behind a bearish imbalance that clearly shows the dominance of sellers.
As price returns to this imbalance and corrects the inefficient movement, the bearish setup becomes complete as long as the market structure remains bearish. The combination of the buy side liquidity sweep, the bearish point of interest, the change of character, the imbalance and the corrective return creates the ideal structure that Smart Money uses to continue the downward movement and develop a reliable selling opportunity.
🔵 Settings
🟣 Logic Settings
Pivot Period : Defines how many bars are analyzed to identify swing highs and lows. Higher values detect larger, slower structures, while lower values respond to faster patterns. The default value of 5 offers a balanced sensitivity.
🟣 Alert Settings
Alert : Enables alerts for SMS08.
Message Frequency : Determines the frequency of alerts. Options include 'All' (every function call), 'Once Per Bar' (first call within the bar), and 'Once Per Bar Close' (final script execution of the real-time bar). Default is 'Once per Bar'.
Show Alert Time by Time Zone : Configures the time zone for alert messages. Default is 'UTC'.
🔵 Conclusion
The Smart Money approach demonstrates that price movement is not random or based on surface level patterns. Instead, it develops through a clear cycle of liquidity collection, structural transition and corrective movement toward key price zones. By recognizing events such as the liquidity sweep, the formation of the point of interest, the change of character and the return into the imbalance, the trader gains the ability to understand order flow more accurately and identify the true direction of market structure.
Both bullish and bearish setups show that the alignment of these elements creates a transparent view of institutional behavior and reveals the source of strong movements in the market. When the trader correctly identifies this sequence, entry points become more reliable and more aligned with liquidity flow. The combination of liquidity, structure and imbalance provides a consistent framework that removes guesswork and guides decisions through the real logic of the market.
