TETSU style 2 Black II chobixautoMA3Lines & kumo & ts & tc River TETSU style 2 Black II chobix versionPine Script® göstergesirain98 tarafındanGüncellendi 4
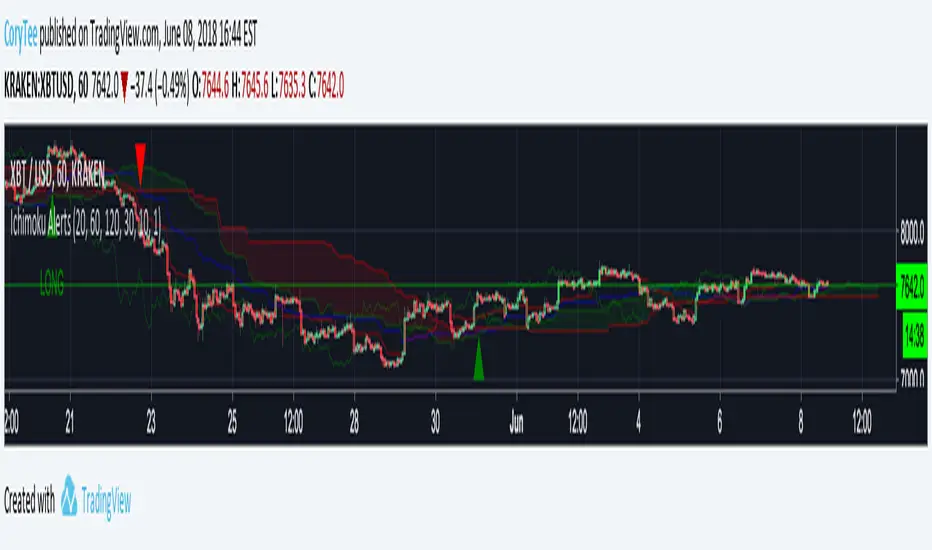
CoryT's Noro's Ichimoku AlertsA few months ago I took Noro's Ichimoku Cloud and used the AV bot template to throw stops on it. I took some code from JustUncleL to make it not so hideous. Trailing Stops are turned off, stop losses are turned off (you really don't need them with this), and this is currently a Long/Short strategy, the Longs Only and Shorts Only options are broken right now, I'm tired and you guys can either fix it yourselves or deal with it like this for now. Hint: If you wanna use this as a long-only strategy just have AV close your buy orders whenever a short is triggered.Pine Script® göstergesiCoryTee tarafındanGüncellendi 22286
CoryT's Noro's IchimokuA few months ago I took Noro's Ichimoku Cloud and used the AV bot template to throw stops on it. I took some code from JustUncleL to make it not so hideous. Trailing Stops are turned off, stop losses are turned off (you really don't need them with this), and this is currently a Long/Short strategy, the Longs Only and Shorts Only options are broken right now, I'm tired and you guys can either fix it yourselves or deal with it like this for now. Hint: If you wanna use this as a long-only strategy just have AV close your buy orders whenever a short is triggered.Pine Script® stratejisiCoryTee tarafındanGüncellendi 33253
Covengers Plumvis 0.1 Plumvis is helpful to Ichimoku based Trading. Red Zone is BUY zone, and Blue Zone is SELL zone. However, ALL Red & Blue Zone aren't BUY & SELL zone. It means "Change color" is important to Buy & SELL Signal. Changing color time is Changing the trends of price. Namely, Red zone is Downtrend of Price, and Blue zone is Uptrend of Price. It is really really useful to Ichimoku based Trading. - Plumvis는 일목균형표의 매매를 도와주는 지표입니다. 빨간색 영역은 매수 영역을 파란색 영역은 매도 영역을 나타냅니다. 그러나 무작정 매수와 매도를 진행할 수는 없습니다. 이 지표를 잘 관찰해보면, 색이 변경되는 영역은 대개 추세 전환의 변곡점이었던 경우가 많습니다. 이를 통해 현재 구역이 상승 추세인지, 매수를 결정해야하는지, 하락 추세인지, 매도를 결정해야하는지, 판단할 수 있습니다. Pine Script® göstergesiSigmaJ tarafından4432
Covengers Ichimoku Cloud Easy 0.1 This is Covengers Ichimoku Cloud's EASY VERSION. This is for you who don't know about Ichimoku, to describe "Time tiktok & Price tiktok Trading". ☆Time tiktok & Price tiktok Trading☆ IF 1. DON'T CARE ABOUT LOWEST PRICE. IF 2. DON'T CARD ABOUT HIGHER PRICE. BUY IF 1. IS "CLOSE" BROKE THROUGH BASE LINE? BUY IF 2. IS "CLOSE " SUPPORTED BY BASE LINE? -> THEN BUY ! At this time, Base line should be STOP LOSS line. SELL IF 1. IS "CLOSE" BROKE THROUGH BASE LINE? SELL IF 2. IS "CLOSE" RESISTED BY BASE LINE? SELL IF 3. IS "CLOSE" BROKE THROUGH ICHIMOKU CLOUD? -> THEN SELL ! Buy conservatively, Sell aggressively. "less LOSS" better than "much PROFIT" - Covengers Ichimoku Cloud의 EASY 버전입니다. 차트를 하나도 모르는 당신에게 임운자재를 설명하기 위해 만들었습니다. ☆임운자재 매매법☆ 절대 조건 1. 바닥에는 관심을 두지 않는다. 절대 조건 2. 천장에는 관심을 두지 않는다. 매수 조건 1. 종가가 기준선을 돌파하였는가? 매수 조건 2. 종가가 기준선의 지지를 받는가? -> 매수 이 때, 손절라인은 기준선이 된다. 매도 조건 1. 종가가 기준선을 돌파하였는가? -> 매도 매도 조건 2. 종가가 기준선의 저항을 받는가? -> 매도 매도 조건 3. 종가가 구름대를 돌파하였는가? -> 매도 매수는 보수적으로, 매도는 공격적으로. 많이 따는 것보다, 잃지 않는 것이 중요하다.Pine Script® göstergesiSigmaJ tarafındanGüncellendi 71
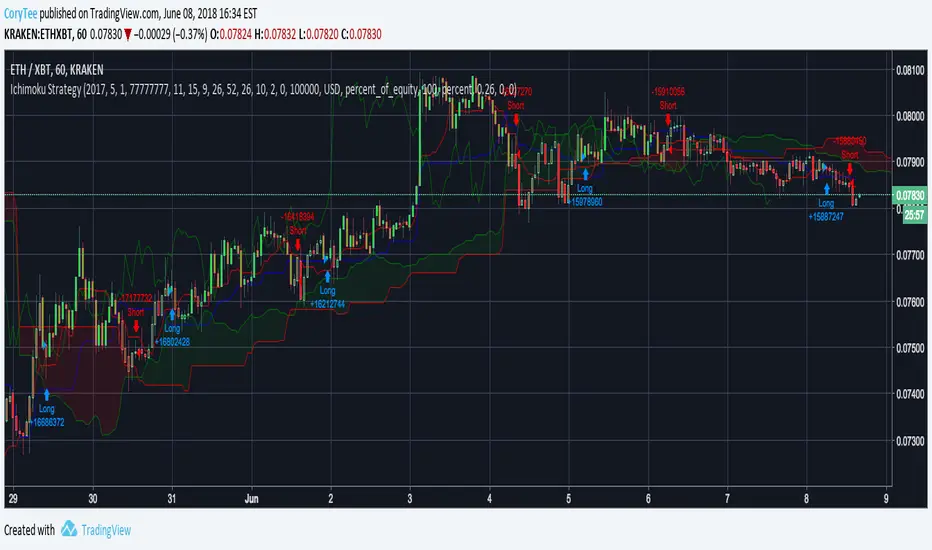
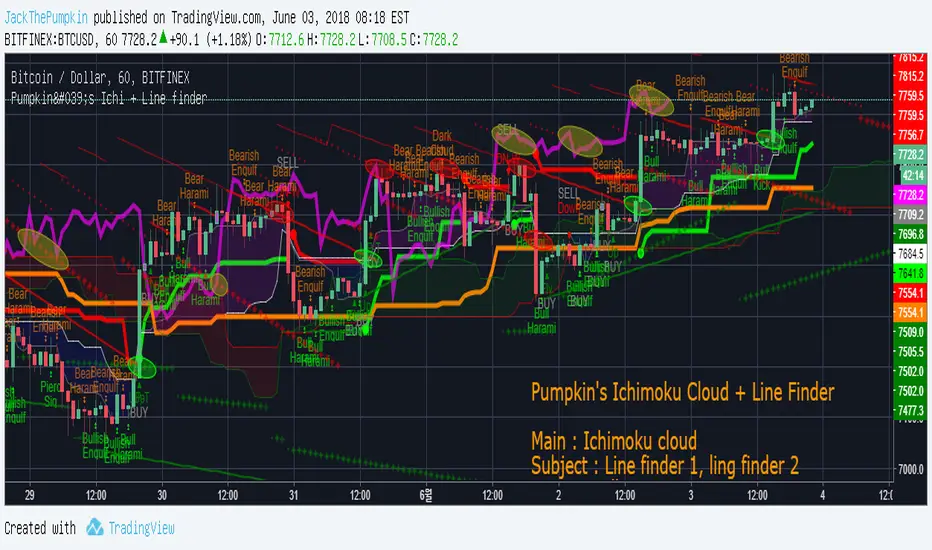
Pumpkin's Ichimoku Cloud & Line FinderMain : Ichimoku Cloud - Tenkan-sen & Kijun-sen Cloud - Senkou Span A & Senkou Span B Cloud - Senkou Span A & Senkou Span B 2nd Cloud Subject : Line Finder - 1st : strong - 2nd : weak ETC - Candle Pattern - ATR line reference : 1. Ichimoku Signal + Candle Color + Candle Pattern by calinh 2. Candlestick Patterns With EMA by rmwaddelljr 3. Trend Line Finder 9000 by spacetrader Pine Script® göstergesiPumpkin_Soup tarafından22140
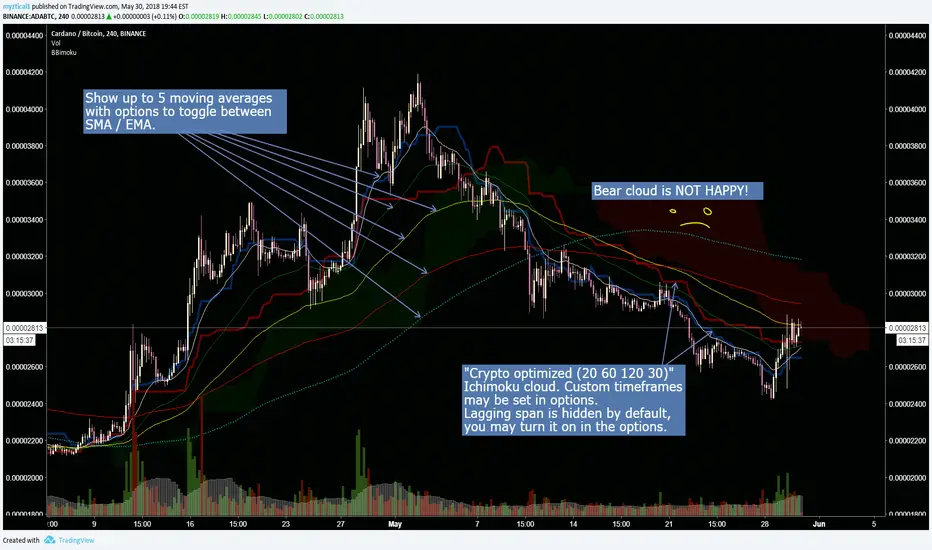
Crypto optimized Ichimoku and 5 variable SMA / EMAThis script has the option for showing up to 5 moving averages with options to toggle between SMA / EMA. Also includes crypto optimized Ichimoku cloud. ********This script was pieced together from various other's contributions from this site, and I cannot remember who the original authors are******* Im just combining them to help others with free accounts and limited indicator availability like myself. I hope this can help someone! Thank you and enjoy.Pine Script® göstergesiBlockchain_Bobby tarafındanGüncellendi 76
Crypto optimized Ichimoku and 5 variable SMA / EMAThis script has the option for showing up to 5 moving averages with options to toggle between SMA / EMA. Also includes crypto optimized Ichimoku cloud. ********This script was pieced together from various other's contributions from this site, and I cannot remember who the original authors are******* Im just combining them to help others with free accounts and limited indicator availability like myself. I hope this can help someone! Thank you and enjoy. Pine Script® göstergesiBlockchain_Bobby tarafındanGüncellendi 27
Ichomoku CloudIchomoku used for filtering and entriesPine Script® stratejisibalboah tarafındanGüncellendi 194
St vwap ichimokuLink for super trend vwap and ichimoku cloudsPine Script® göstergesisoorrya tarafındanGüncellendi 33113
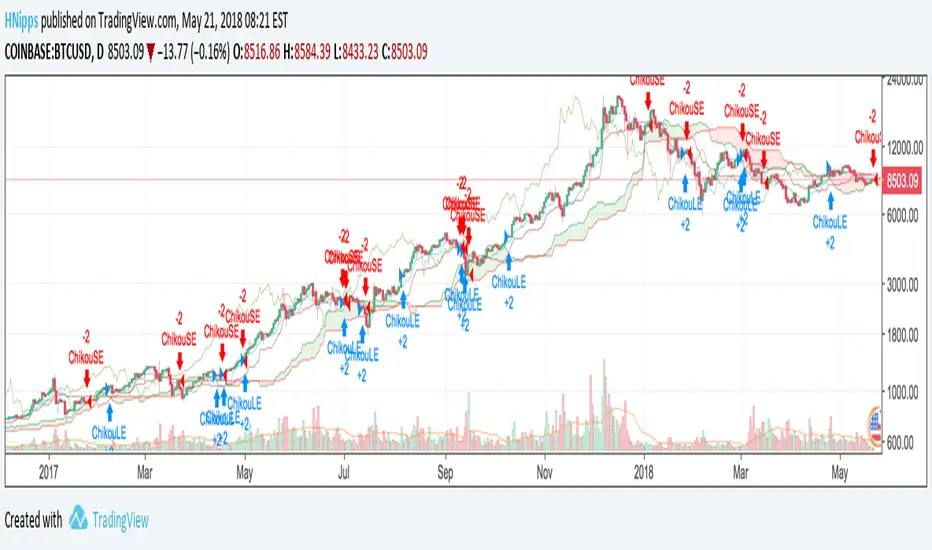
Chikou CrossoverA very simple Ichimoku Cloud strategy. Buy when Chikou Span crosses above price. Sell when Chikou Span crosses below price.Pine Script® stratejisiHNipps tarafından22209
[MS-Altered Study] betaAltered Study - this is beta quality study for internal use only.Pine Script® göstergesiUnknownUnicorn2259351 tarafındanGüncellendi 13
Hao's IchimokuAdd more base line in 33 and 52 periodsPine Script® göstergesinguyenphuhao.it tarafındanGüncellendi 1112
Anaximander Ichimoku CloudIchimoku cloud tweaked for personal usePine Script® göstergesiAnaximander tarafından3
Anaximander Ichimoku CloudIchimoku cloud tweaked for personal usePine Script® göstergesiAnaximander tarafından111
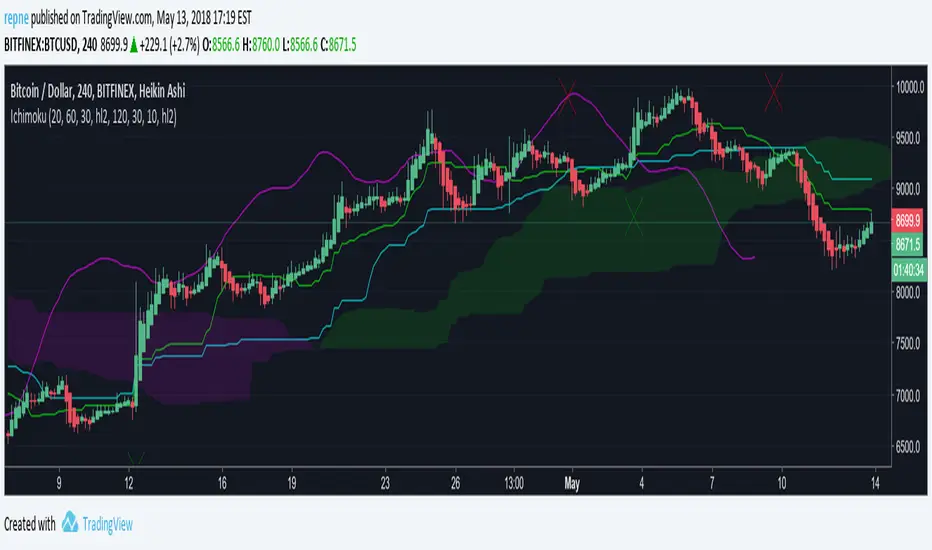
Ichimoku DeluxeClassic Ichimoku Cloud with added configuration and support for Heikin Ashi candles. Smothing of the Chikou Span (Lagging Line) is on by default, the only purpose is to make the chart look cleaner. There's an added moving average (ZLEMA) and bear/bull crossings signals. Defaults are tuned for crypto, in particular BTC.Pine Script® göstergesirepne tarafından37
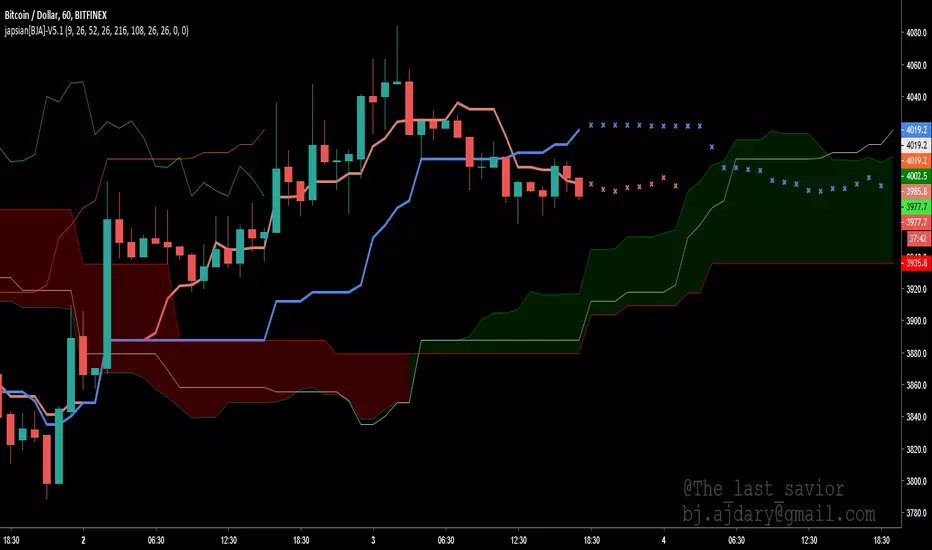
Bijimoku (japsian For tradingview) -- by: Bijan AjdaryThis Indicator(BIJIMOKU) is an updated version of the japsian Indicator, which has been specially designed for Tradingview. You can send your feedback and comments to my email address: bj.ajdary@gmail.com --- Thanks to ChrisPine Script® göstergesisavior144 tarafındanGüncellendi 2121349
Ichimoku Cloud Strategy for Crypto V2.0Version 2.0 This updated strategy uses additional entry/exit rules based on trend. This version will only enter short positions if the trend is bearish. While still agressive on bullish signals, it will close long positions earlier if it detects a false bull signal or keep them open should the trend continue to be bullish. If you prefer a more aggressive strategy check out version 1.0 Do not run this strategy on a timeframe < 1h, best timeframe will be 4h. Happy Trading!! If you find this strategy useful, please consider a donation to: BTC: 1PGuWcQwb4WZyFYX4ehyqcJWcbX42jW7Y6 ETH: 0x912aD30Ff9A49c69D51ECeE5A65A7E7d5321ED0CPine Script® stratejisir0dentZA tarafındanGüncellendi 1182
Ichimoku Cloud Strategy for CryptoVersion 1.0 This strategy uses the Ichimoku Cloud indicators and is based on a bot i developed. The bot has more entry/exit rules which will hopefully be added in the near future. Still a profitable strategy even in it's simplest form. Do not run this strategy on a timeframe < 1h, best timeframe will be 4h Happy Trading!! If you find this strategy useful, please consider a donation to: BTC: 1PGuWcQwb4WZyFYX4ehyqcJWcbX42jW7Y6 ETH: 0x912aD30Ff9A49c69D51ECeE5A65A7E7d5321ED0C Pine Script® stratejisir0dentZA tarafından54