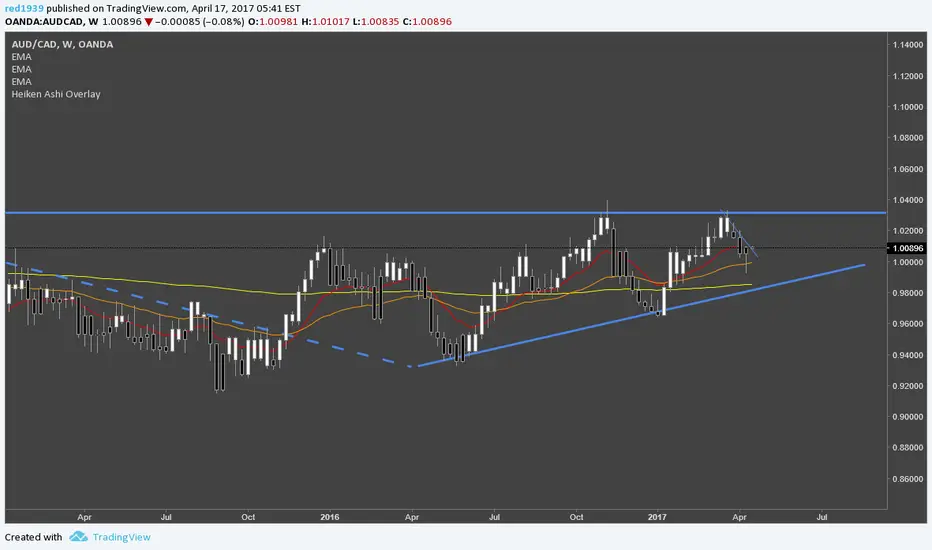
EMA20 MA50 MA200 + T3-CCIEMA20 MA50 MA200 + T3-CCI
This combination of triple Moving Average and CCI is a strategy to be used in conjunction with Harmonical Patterns and Fibonacci Rations .
Heikin Ashi price can be used as the price source for the Moving Averages and the T3-CCI, instead of the real price.
Two instances of the indicator can be spawned to have both the triple MAs and the T3-CCI on the chart (L-Click on the Indicator > Move To > New Pane Below).
Alerts are available to warn of possible opportunities in the markets .
A single alert that can fire on both conditions can be set. It can also be used by other indicators, such as the Risk Management Wrapper .
Additional Technical Analysis is required to confirm the signals before opening a position.
This indicator is an update to MA50 EMA20 MA200 .
Heikinashi

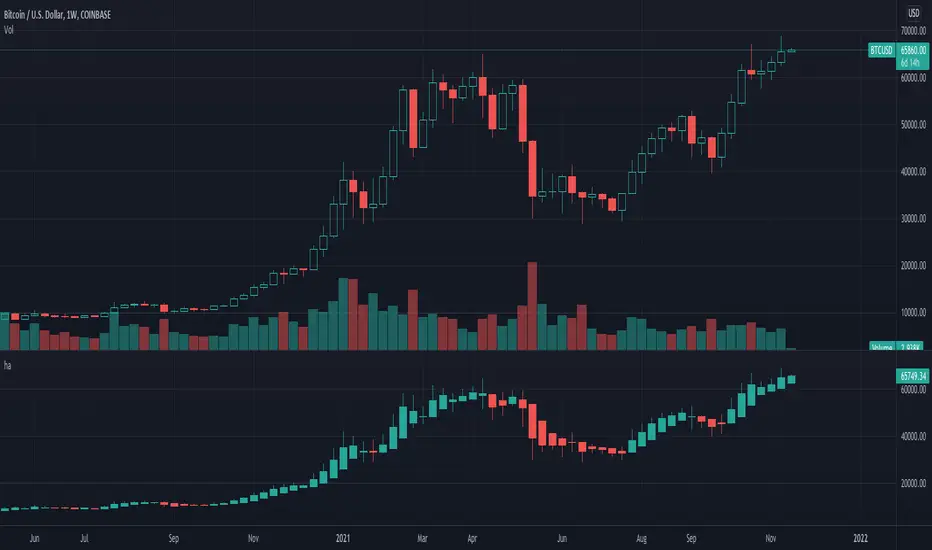
Heiken-Ashi CandlesSimple script to view Heiken-Ashi candles below a normal candles chart.
Could also be useful for using HA calcs in strategy scripts on normal candles chart for proper backtesting.
I adapted this to v4 from original v2 script by @samtsui. If you like please remember to give him a Thumbs Up for his original version! ->
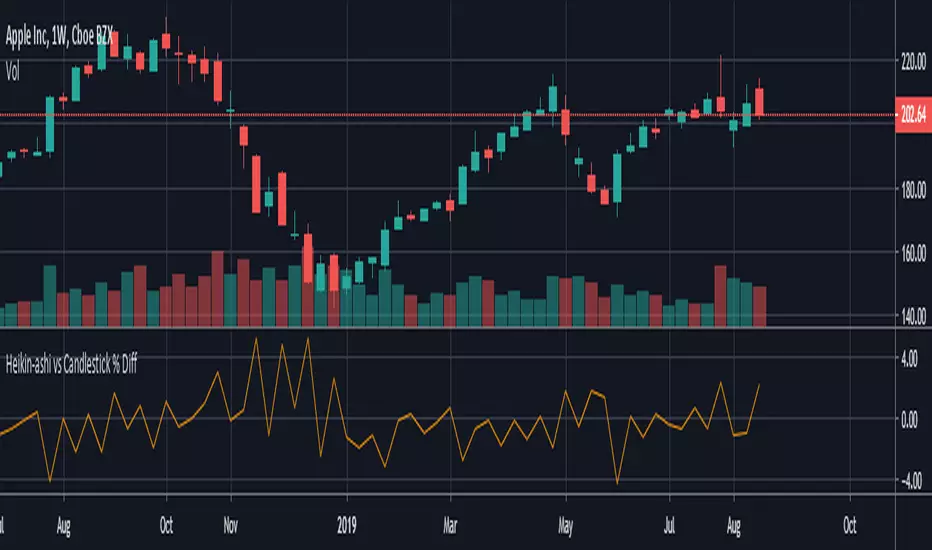
HeikinAshi - Candlestick % Difference This script shows the price difference ( %) between heikin ashi and candlestick for all investment instruments as Close, Open, High and Low. (Switchable )
In this way, you can see which instruments can easily use heikin ashi .
And by taking averages you can find the opportunity to compare which investment tools are more risk-free.
[RESEARCH] Heikin-Ashi Chart IdentifierA deterministic approach to identify Heikin-Ashi chart type.
The script checks the next statements about HA:
HA chart does not have any gaps in a classic sense
Every new HA open price is calculated using a specific recurrence formula. This fact also means that initial HA open price is used to calculate all the next and so on (a construction of Infinite Impulse Response filters)
The script works correctly being applied to other chart types:
Classic Candlestick
Range Bars
Line Break
Traditional Renko
ATR Renko
Traditional Point-and-Figure
ATR Point-and-Figure
Kagi
For special ones: this code allows you to check whether your script is being executed with Heikin-Ashi candles or not inside your script.
Ev sistr 'ta Laou!

Heikin Ashi OscillatorTrigger (Current Period): Heikin Ashi candle heights are plotted to form and oscillator.
Trend (1W): A slower period is also plotted.
When Trend is rising, dips in the Trigger are buying opportunities
When Trend is descending, peaks in the Trigger are selling opportunities

Up Down Alerts with MA Control - v2.0this update is meant for use with regular candles, but it will mimic the color pattern of heikin ashi candles and allow alerts based on the heikin ashi patterns. Also there are alerts for when the price is above a set moving average.
was going to just update the original script but there are a lot of changes to make it smoother etc, original script:
IO_Heikin-Ashi OverlayThis is Traditional Heikin-Ashi bars overlayed with regular candlestick/any chart type
Although HA is available in TradingView by default, this script is to recalculate HA by traditional calculations.
This version REPAINTS!! This is because Traditional HA uses Close Price (which is calculated on the fly).
-- Invsto

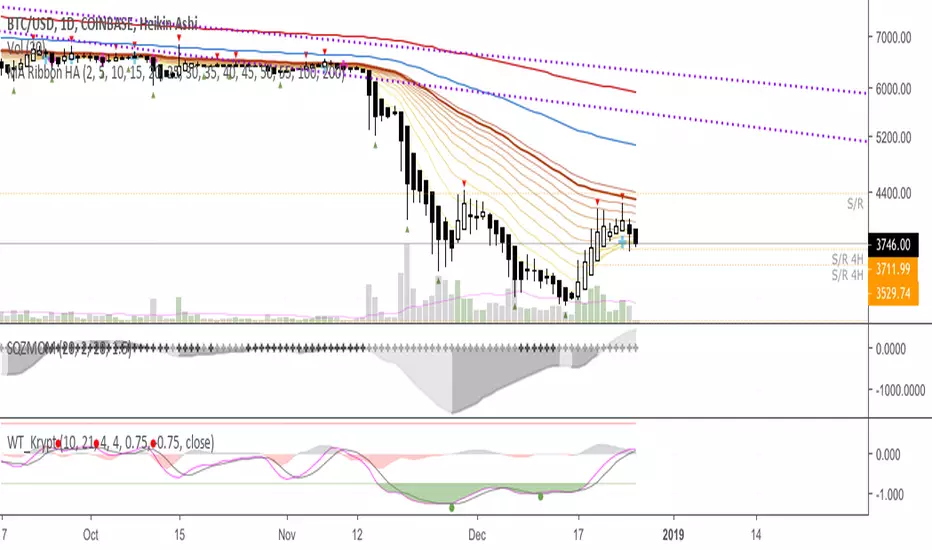
MA Ribbon HA* Inspired by Krypt's and Madrid's Ribbon
* Supplemental to bullish or bearish trend confirmations with Heikin Ashi candles (e.g. 10/20 MA cross)
* Default of: MA 5-55, 100 and 200
* Ability to switch between Simple vs Exponential MAs
You may switch color gradient by using this tool,
www.perbang.dk
Hope this helps. Please do let me know if you know how to script the wishlist below =)
Thanks!
---
Wishlist/to do next:
1. Be able to do this color change on counter-trend by implementing this script from Madrid's:
leadMAColor = change(ma05)>=0 and ma05>ma100 ? lime
: change(ma05)<0 and ma05>ma100 ? maroon
: change(ma05)<=0 and ma05=0 and ma05
change(ma)>=0 and ma05>maRef ? lime
: change(ma)<0 and ma05>maRef ? maroon
: change(ma)<=0 and ma05=0 and ma05
na(src ) ? na : src
...
price = dropn(src, dropCandles)
3. Be able to update line thickness of E/MA 10 & 20, as well as their colors.
4. A way to input two HEX colors and automatically update the ribbon lines to have those color gradient.
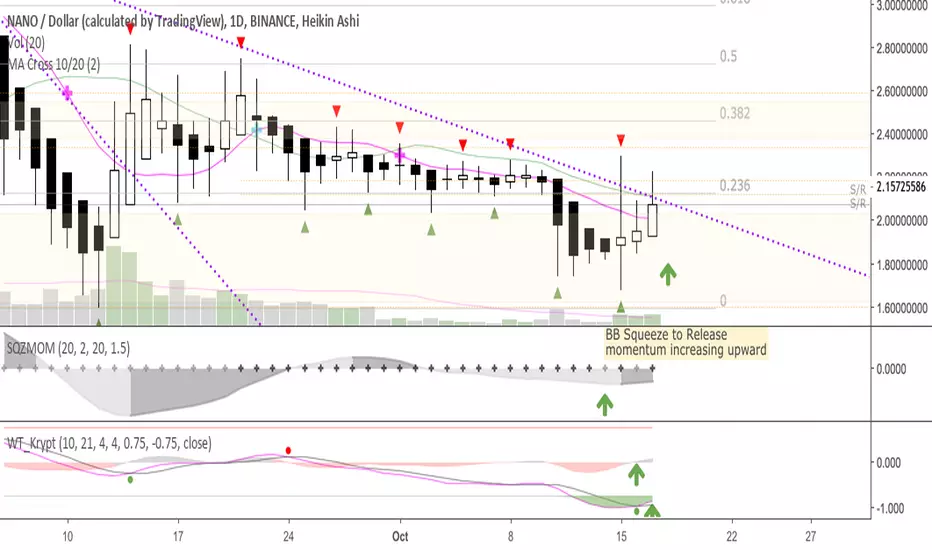
MA Cross 10/20This was originally derived from "MA Cross" indicator, though that one uses 9-21.
Simple 10day and 20day MA crossover indicator
* 10MA crosses from the bottom, goes up and above 20MA—we're bullish, look to long bullish signal candle
* 10MA crosses from the top, goes down and below 20MA—we're bearish, look to short bearish signal candle
Works well w/ Heikin Ashi candles
Kozlod - Heikin-Ashi Bar Color Change AlertsYou can use this script to setup alerts on Heikin-Ashi bar color change.
You have to apply this script to usual candles and not Heikin-Ashi!!!
Background color indicates HA bar color. On change you'll see green/red arrows and alert will be fired.
Also you can find in the code calculations of all HA OHLC values.

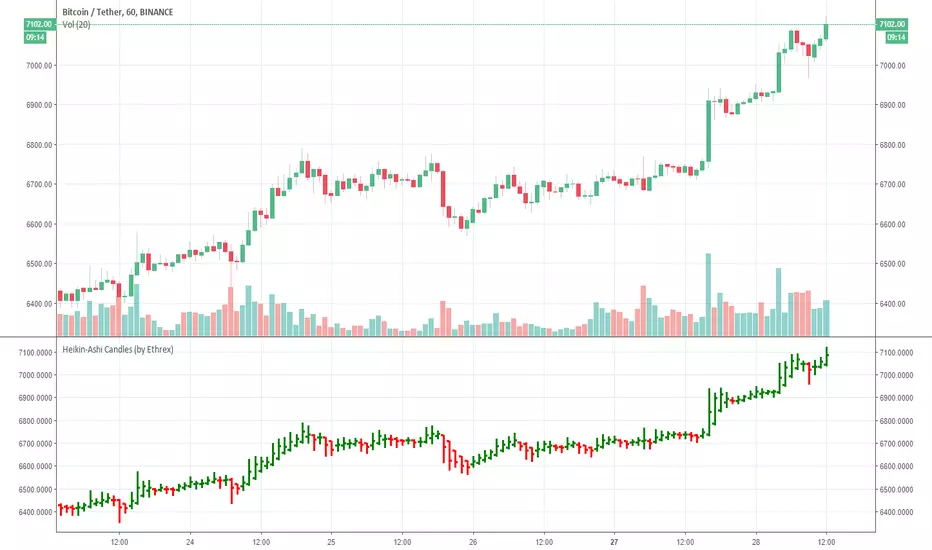
Heikin-Ashi Candles (by Ethrex)Allows to see how Heikin-Ashi candles are computed and see the bars side-by-side with normal prices.
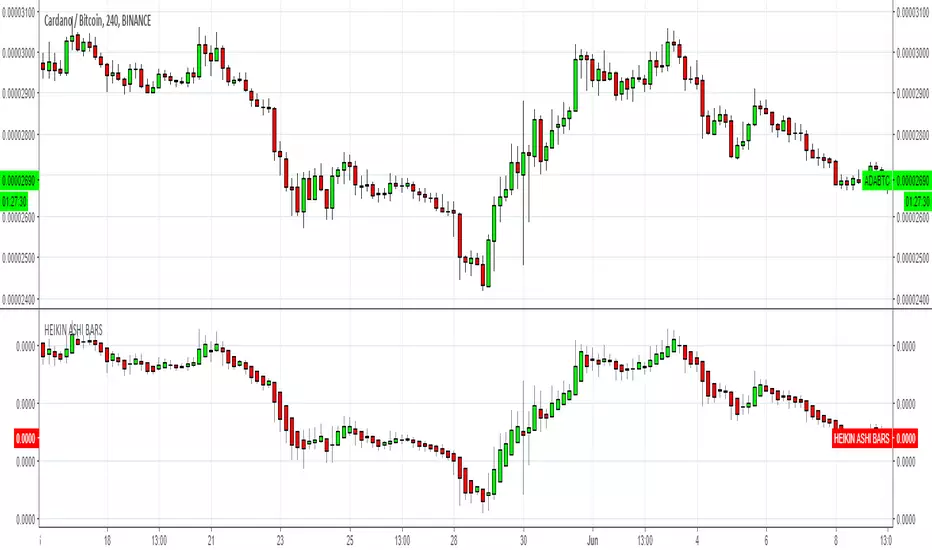
HEIKIN ASHI BARSSimple Heikin Ashi candlebars
Please consider a tip if you find this useful
BTC: 3FiBnveHo3YW6DSiPEmoCFCyCnsrWS3JBR
ETH: 0xac290B4A721f5ef75b0971F1102e01E1942A4578
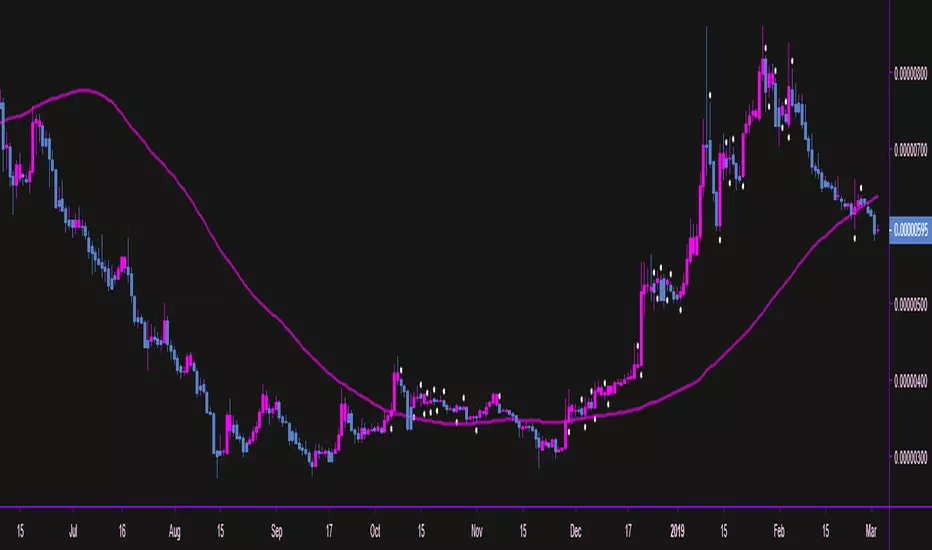
Heikin Ashi Smoothed (yasinipek) by KIVANC fr3762Heikin Ashi Smoothed Strategy
A trend trading forex system composed of the Smoothed Heiken Ashi candlestick indicator and moving averages. It works best on the 1 hour charts and higher time frames.
buy when blue line crosses above red
conversely sell when red line crosses above blue
Author: Yasin İpek @yasinipek83 on twitter / www.yasinipek.com & KıvanÇ @fr3762 on twitter (tweets are only in TURKISH)