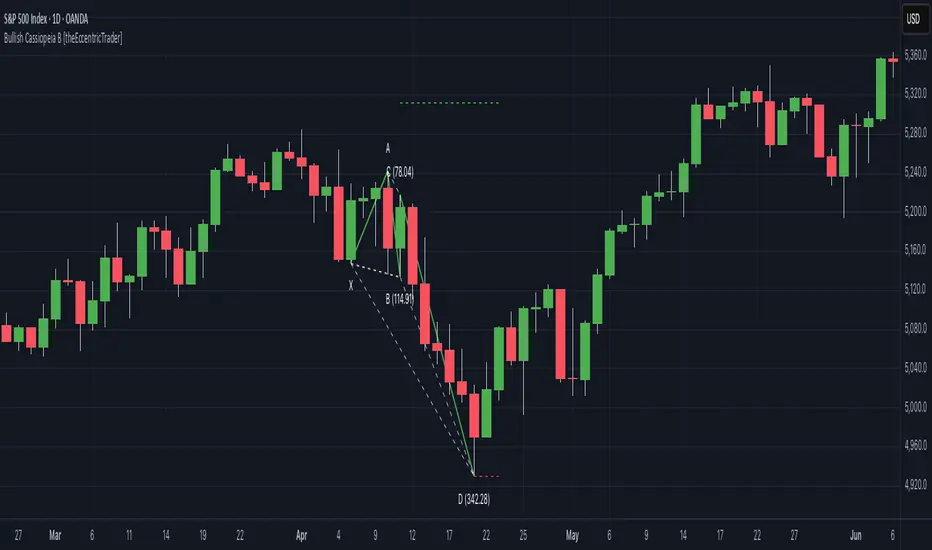
Bullish Cassiopeia C Harmonic Patterns [theEccentricTrader]█ OVERVIEW
This indicator automatically detects and draws bullish Cassiopeia C harmonic patterns and price projections derived from the ranges that constitute the patterns.
Cassiopeia A, B and C harmonic patterns are patterns that I created/discovered myself. They are all inspired by the Cassiopeia constellation and each one is based on different rotations of the constellation as it moves through the sky. The range ratios are also based on the constellation's right ascension and declination listed on Wikipedia:
Right ascension 22h 57m 04.5897s–03h 41m 14.0997s
Declination 77.6923447°–48.6632690°
en.wikipedia.org
I actually developed this idea quite a while ago now but have not felt audacious enough to introduce a new harmonic pattern, let alone 3 at the same time! But I have since been able to run backtests on tick data going back to 2002 across a variety of market and timeframe combinations and have learned that the Cassiopeia patterns can certainly hold their own against the currently known harmonic patterns.
I would also point out that the Cassiopeia constellation does actually look like a harmonic pattern and the Cassiopeia A star is literally the 'strongest source of radio emission in the sky beyond the solar system', so its arguably more of a real harmonic phenomenon than the current patterns.
www.britannica.com
chandra.si.edu
█ CONCEPTS
Green and Red Candles
• A green candle is one that closes with a close price equal to or above the price it opened.
• A red candle is one that closes with a close price that is lower than the price it opened.
Swing Highs and Swing Lows
• A swing high is a green candle or series of consecutive green candles followed by a single red candle to complete the swing and form the peak.
• A swing low is a red candle or series of consecutive red candles followed by a single green candle to complete the swing and form the trough.
Peak and Trough Prices (Basic)
• The peak price of a complete swing high is the high price of either the red candle that completes the swing high or the high price of the preceding green candle, depending on which is higher.
• The trough price of a complete swing low is the low price of either the green candle that completes the swing low or the low price of the preceding red candle, depending on which is lower.
Historic Peaks and Troughs
The current, or most recent, peak and trough occurrences are referred to as occurrence zero. Previous peak and trough occurrences are referred to as historic and ordered numerically from right to left, with the most recent historic peak and trough occurrences being occurrence one.
Range
The range is simply the difference between the current peak and current trough prices, generally expressed in terms of points or pips.
Upper Trends
• A return line uptrend is formed when the current peak price is higher than the preceding peak price.
• A downtrend is formed when the current peak price is lower than the preceding peak price.
• A double-top is formed when the current peak price is equal to the preceding peak price.
Lower Trends
• An uptrend is formed when the current trough price is higher than the preceding trough price.
• A return line downtrend is formed when the current trough price is lower than the preceding trough price.
• A double-bottom is formed when the current trough price is equal to the preceding trough price.
Muti-Part Upper and Lower Trends
• A multi-part return line uptrend begins with the formation of a new return line uptrend and continues until a new downtrend ends the trend.
• A multi-part downtrend begins with the formation of a new downtrend and continues until a new return line uptrend ends the trend.
• A multi-part uptrend begins with the formation of a new uptrend and continues until a new return line downtrend ends the trend.
• A multi-part return line downtrend begins with the formation of a new return line downtrend and continues until a new uptrend ends the trend.
Double Trends
• A double uptrend is formed when the current trough price is higher than the preceding trough price and the current peak price is higher than the preceding peak price.
• A double downtrend is formed when the current peak price is lower than the preceding peak price and the current trough price is lower than the preceding trough price.
Muti-Part Double Trends
• A multi-part double uptrend begins with the formation of a new uptrend that proceeds a new return line uptrend, and continues until a new downtrend or return line downtrend ends the trend.
• A multi-part double downtrend begins with the formation of a new downtrend that proceeds a new return line downtrend, and continues until a new uptrend or return line uptrend ends the trend.
Wave Cycles
A wave cycle is here defined as a complete two-part move between a swing high and a swing low, or a swing low and a swing high. The first swing high or swing low will set the course for the sequence of wave cycles that follow; for example a chart that begins with a swing low will form its first complete wave cycle upon the formation of the first complete swing high and vice versa.
Figure 1.
Retracement and Extension Ratios
Retracement and extension ratios are calculated by dividing the current range by the preceding range and multiplying the answer by 100. Retracement ratios are those that are equal to or below 100% of the preceding range and extension ratios are those that are above 100% of the preceding range.
Fibonacci Retracement and Extension Ratios
The Fibonacci sequence is a series of numbers in which each number is the sum of the two preceding numbers, starting with 0 and 1. For example 0 + 1 = 1, 1 + 1 = 2, 1 + 2 = 3, and so on. Ultimately, we could go on forever but the first few numbers in the sequence are as follows: 0 , 1, 1, 2, 3, 5, 8, 13, 21, 34, 55, 89, 144.
The extension ratios are calculated by dividing each number in the sequence by the number preceding it. For example 0/1 = 0, 1/1 = 1, 2/1 = 2, 3/2 = 1.5, 5/3 = 1.6666..., 8/5 = 1.6, 13/8 = 1.625, 21/13 = 1.6153..., 34/21 = 1.6190..., 55/34 = 1.6176..., 89/55 = 1.6181..., 144/89 = 1.6179..., and so on. The retracement ratios are calculated by inverting this process and dividing each number in the sequence by the number proceeding it. For example 0/1 = 0, 1/1 = 1, 1/2 = 0.5, 2/3 = 0.666..., 3/5 = 0.6, 5/8 = 0.625, 8/13 = 0.6153..., 13/21 = 0.6190..., 21/34 = 0.6176..., 34/55 = 0.6181..., 55/89 = 0.6179..., 89/144 = 0.6180..., and so on.
1.618 is considered to be the 'golden ratio', found in many natural phenomena such as the growth of seashells and the branching of trees. Some now speculate the universe oscillates at a frequency of 0,618 Hz, which could help to explain such phenomena, but this theory has yet to be proven.
Traders and analysts use Fibonacci retracement and extension indicators, consisting of horizontal lines representing different Fibonacci ratios, for identifying potential levels of support and resistance. Fibonacci ranges are typically drawn from left to right, with retracement levels representing ratios inside of the current range and extension levels representing ratios extended outside of the current range. If the current wave cycle ends on a swing low, the Fibonacci range is drawn from peak to trough. If the current wave cycle ends on a swing high the Fibonacci range is drawn from trough to peak.
Harmonic Patterns
The concept of harmonic patterns in trading was first introduced by H.M. Gartley in his book "Profits in the Stock Market", published in 1935. Gartley observed that markets have a tendency to move in repetitive patterns, and he identified several specific patterns that he believed could be used to predict future price movements.
Since then, many other traders and analysts have built upon Gartley's work and developed their own variations of harmonic patterns. One such contributor is Larry Pesavento, who developed his own methods for measuring harmonic patterns using Fibonacci ratios. Pesavento has written several books on the subject of harmonic patterns and Fibonacci ratios in trading. Another notable contributor to harmonic patterns is Scott Carney, who developed his own approach to harmonic trading in the late 1990s and also popularised the use of Fibonacci ratios to measure harmonic patterns. Carney expanded on Gartley's work and also introduced several new harmonic patterns, such as the Shark pattern and the 5-0 pattern.
The bullish and bearish Gartley patterns are the oldest recognized harmonic patterns in trading and all the other harmonic patterns are ultimately modifications of the original Gartley patterns. Gartley patterns are fundamentally composed of 5 points, or 4 waves.
Bullish and Bearish Cassiopeia C Harmonic Patterns
• Bullish Cassiopeia C patterns are fundamentally composed of three troughs and two peaks. The second peak being higher than the first peak. And the third trough being lower than both the first and second troughs, while the second trough is higher than the first.
• Bearish Cassiopeia C patterns are fundamentally composed of three peaks and two troughs. The second trough being lower than the first trough. And the third peak being higher than both the first and second peaks, while the second peak is lower than the first.
The ratio measurements I use to detect the patterns are as follows:
• Wave 1 of the pattern, generally referred to as XA, has no specific ratio requirements.
• Wave 2 of the pattern, generally referred to as AB, should retrace by at least 11.34%, but no further than 22.31% of the range set by wave 1.
• Wave 3 of the pattern, generally referred to as BC, should extend by at least 225.7%, but no further than 341% of the range set by wave 2.
• Wave 4 of the pattern, generally referred to as CD, should retrace by at least 77.69%, but no further than 88.66% of the range set by wave 3.
Measurement Tolerances
In general, tolerance in measurements refers to the allowable variation or deviation from a specific value or dimension. It is the range within which a particular measurement is considered to be acceptable or accurate. In this script I have applied this concept to the measurement of harmonic pattern ratios to increase to the frequency of pattern occurrences.
For example, the AB measurement of Gartley patterns is generally set at around 61.8%, but with such specificity in the measuring requirements the patterns are very rare. We can increase the frequency of pattern occurrences by setting a tolerance. A tolerance of 10% to both downside and upside, which is the default setting for all tolerances, means we would have a tolerable measurement range between 51.8-71.8%, thus increasing the frequency of occurrence.
█ FEATURES
Inputs
• AB Lower Tolerance
• AB Upper Tolerance
• BC Lower Tolerance
• BC Upper Tolerance
• CD Lower Tolerance
• CD Upper Tolerance
• Pattern Color
• Label Color
• Show Projections
• Extend Current Projection Lines
Alerts
Users can set alerts for when the patterns occur.
█ LIMITATIONS
All green and red candle calculations are based on differences between open and close prices, as such I have made no attempt to account for green candles that gap lower and close below the close price of the preceding candle, or red candles that gap higher and close above the close price of the preceding candle. This may cause some unexpected behaviour on some markets and timeframes. I can only recommend using 24-hour markets, if and where possible, as there are far fewer gaps and, generally, more data to work with.
█ NOTES
I know a few people have been requesting a single indicator that contains all my patterns and I definitely hear you on that one. However, I have been very busy working on other projects while trying to trade and be a human at the same time. For now I am going to maintain my original approach of releasing each pattern individually so as to maintain consistency. But I am now also working on getting my some of my libraries ready for public release and in doing so I will finally be able to fit all patterns into one script. I will also be giving my scripts some TLC by making them cleaner once I have the libraries up and running. Please bear with me in the meantime, this may take a while. Cheers!
Harmonik Formasyonlar

Bearish Cassiopeia B Harmonic Patterns [theEccentricTrader]█ OVERVIEW
This indicator automatically detects and draws bearish Cassiopeia B harmonic patterns and price projections derived from the ranges that constitute the patterns.
Cassiopeia A, B and C harmonic patterns are patterns that I created/discovered myself. They are all inspired by the Cassiopeia constellation and each one is based on different rotations of the constellation as it moves through the sky. The range ratios are also based on the constellation's right ascension and declination listed on Wikipedia:
Right ascension 22h 57m 04.5897s–03h 41m 14.0997s
Declination 77.6923447°–48.6632690°
en.wikipedia.org
I actually developed this idea quite a while ago now but have not felt audacious enough to introduce a new harmonic pattern, let alone 3 at the same time! But I have since been able to run backtests on tick data going back to 2002 across a variety of market and timeframe combinations and have learned that the Cassiopeia patterns can certainly hold their own against the currently known harmonic patterns.
I would also point out that the Cassiopeia constellation does actually look like a harmonic pattern and the Cassiopeia A star is literally the 'strongest source of radio emission in the sky beyond the solar system', so its arguably more of a real harmonic phenomenon than the current patterns.
www.britannica.com
chandra.si.edu
█ CONCEPTS
Green and Red Candles
• A green candle is one that closes with a close price equal to or above the price it opened.
• A red candle is one that closes with a close price that is lower than the price it opened.
Swing Highs and Swing Lows
• A swing high is a green candle or series of consecutive green candles followed by a single red candle to complete the swing and form the peak.
• A swing low is a red candle or series of consecutive red candles followed by a single green candle to complete the swing and form the trough.
Peak and Trough Prices (Basic)
• The peak price of a complete swing high is the high price of either the red candle that completes the swing high or the high price of the preceding green candle, depending on which is higher.
• The trough price of a complete swing low is the low price of either the green candle that completes the swing low or the low price of the preceding red candle, depending on which is lower.
Historic Peaks and Troughs
The current, or most recent, peak and trough occurrences are referred to as occurrence zero. Previous peak and trough occurrences are referred to as historic and ordered numerically from right to left, with the most recent historic peak and trough occurrences being occurrence one.
Range
The range is simply the difference between the current peak and current trough prices, generally expressed in terms of points or pips.
Upper Trends
• A return line uptrend is formed when the current peak price is higher than the preceding peak price.
• A downtrend is formed when the current peak price is lower than the preceding peak price.
• A double-top is formed when the current peak price is equal to the preceding peak price.
Lower Trends
• An uptrend is formed when the current trough price is higher than the preceding trough price.
• A return line downtrend is formed when the current trough price is lower than the preceding trough price.
• A double-bottom is formed when the current trough price is equal to the preceding trough price.
Muti-Part Upper and Lower Trends
• A multi-part return line uptrend begins with the formation of a new return line uptrend and continues until a new downtrend ends the trend.
• A multi-part downtrend begins with the formation of a new downtrend and continues until a new return line uptrend ends the trend.
• A multi-part uptrend begins with the formation of a new uptrend and continues until a new return line downtrend ends the trend.
• A multi-part return line downtrend begins with the formation of a new return line downtrend and continues until a new uptrend ends the trend.
Double Trends
• A double uptrend is formed when the current trough price is higher than the preceding trough price and the current peak price is higher than the preceding peak price.
• A double downtrend is formed when the current peak price is lower than the preceding peak price and the current trough price is lower than the preceding trough price.
Muti-Part Double Trends
• A multi-part double uptrend begins with the formation of a new uptrend that proceeds a new return line uptrend, and continues until a new downtrend or return line downtrend ends the trend.
• A multi-part double downtrend begins with the formation of a new downtrend that proceeds a new return line downtrend, and continues until a new uptrend or return line uptrend ends the trend.
Wave Cycles
A wave cycle is here defined as a complete two-part move between a swing high and a swing low, or a swing low and a swing high. The first swing high or swing low will set the course for the sequence of wave cycles that follow; for example a chart that begins with a swing low will form its first complete wave cycle upon the formation of the first complete swing high and vice versa.
Figure 1.
Retracement and Extension Ratios
Retracement and extension ratios are calculated by dividing the current range by the preceding range and multiplying the answer by 100. Retracement ratios are those that are equal to or below 100% of the preceding range and extension ratios are those that are above 100% of the preceding range.
Fibonacci Retracement and Extension Ratios
The Fibonacci sequence is a series of numbers in which each number is the sum of the two preceding numbers, starting with 0 and 1. For example 0 + 1 = 1, 1 + 1 = 2, 1 + 2 = 3, and so on. Ultimately, we could go on forever but the first few numbers in the sequence are as follows: 0 , 1, 1, 2, 3, 5, 8, 13, 21, 34, 55, 89, 144.
The extension ratios are calculated by dividing each number in the sequence by the number preceding it. For example 0/1 = 0, 1/1 = 1, 2/1 = 2, 3/2 = 1.5, 5/3 = 1.6666..., 8/5 = 1.6, 13/8 = 1.625, 21/13 = 1.6153..., 34/21 = 1.6190..., 55/34 = 1.6176..., 89/55 = 1.6181..., 144/89 = 1.6179..., and so on. The retracement ratios are calculated by inverting this process and dividing each number in the sequence by the number proceeding it. For example 0/1 = 0, 1/1 = 1, 1/2 = 0.5, 2/3 = 0.666..., 3/5 = 0.6, 5/8 = 0.625, 8/13 = 0.6153..., 13/21 = 0.6190..., 21/34 = 0.6176..., 34/55 = 0.6181..., 55/89 = 0.6179..., 89/144 = 0.6180..., and so on.
1.618 is considered to be the 'golden ratio', found in many natural phenomena such as the growth of seashells and the branching of trees. Some now speculate the universe oscillates at a frequency of 0,618 Hz, which could help to explain such phenomena, but this theory has yet to be proven.
Traders and analysts use Fibonacci retracement and extension indicators, consisting of horizontal lines representing different Fibonacci ratios, for identifying potential levels of support and resistance. Fibonacci ranges are typically drawn from left to right, with retracement levels representing ratios inside of the current range and extension levels representing ratios extended outside of the current range. If the current wave cycle ends on a swing low, the Fibonacci range is drawn from peak to trough. If the current wave cycle ends on a swing high the Fibonacci range is drawn from trough to peak.
Harmonic Patterns
The concept of harmonic patterns in trading was first introduced by H.M. Gartley in his book "Profits in the Stock Market", published in 1935. Gartley observed that markets have a tendency to move in repetitive patterns, and he identified several specific patterns that he believed could be used to predict future price movements.
Since then, many other traders and analysts have built upon Gartley's work and developed their own variations of harmonic patterns. One such contributor is Larry Pesavento, who developed his own methods for measuring harmonic patterns using Fibonacci ratios. Pesavento has written several books on the subject of harmonic patterns and Fibonacci ratios in trading. Another notable contributor to harmonic patterns is Scott Carney, who developed his own approach to harmonic trading in the late 1990s and also popularised the use of Fibonacci ratios to measure harmonic patterns. Carney expanded on Gartley's work and also introduced several new harmonic patterns, such as the Shark pattern and the 5-0 pattern.
The bullish and bearish Gartley patterns are the oldest recognized harmonic patterns in trading and all the other harmonic patterns are ultimately modifications of the original Gartley patterns. Gartley patterns are fundamentally composed of 5 points, or 4 waves.
Bullish and Bearish Cassiopeia B Harmonic Patterns
• Bullish Cassiopeia B patterns are fundamentally composed of three troughs and two peaks. The second peak being lower than the first peak. And the third trough being lower than both the first and second troughs, while the second trough is also lower than the first.
• Bearish Cassiopeia B patterns are fundamentally composed of three peaks and two troughs. The second trough being higher than the first trough. And the third peak being higher than both the first and second peaks, while the second peak is also higher than the first.
The ratio measurements I use to detect the patterns are as follows:
• Wave 1 of the pattern, generally referred to as XA, has no specific ratio requirements.
• Wave 2 of the pattern, generally referred to as AB, should retrace by at least 11.34%, but no further than 22.31% of the range set by wave 1.
• Wave 3 of the pattern, generally referred to as BC, should extend by at least 225.7%, but no further than 341% of the range set by wave 2.
• Wave 4 of the pattern, generally referred to as CD, should retrace by at least 77.69%, but no further than 88.66% of the range set by wave 3.
Measurement Tolerances
In general, tolerance in measurements refers to the allowable variation or deviation from a specific value or dimension. It is the range within which a particular measurement is considered to be acceptable or accurate. In this script I have applied this concept to the measurement of harmonic pattern ratios to increase to the frequency of pattern occurrences.
For example, the AB measurement of Gartley patterns is generally set at around 61.8%, but with such specificity in the measuring requirements the patterns are very rare. We can increase the frequency of pattern occurrences by setting a tolerance. A tolerance of 10% to both downside and upside, which is the default setting for all tolerances, means we would have a tolerable measurement range between 51.8-71.8%, thus increasing the frequency of occurrence.
█ FEATURES
Inputs
• AB Lower Tolerance
• AB Upper Tolerance
• BC Lower Tolerance
• BC Upper Tolerance
• CD Lower Tolerance
• CD Upper Tolerance
• Pattern Color
• Label Color
• Show Projections
• Extend Current Projection Lines
Alerts
Users can set alerts for when the patterns occur.
█ LIMITATIONS
All green and red candle calculations are based on differences between open and close prices, as such I have made no attempt to account for green candles that gap lower and close below the close price of the preceding candle, or red candles that gap higher and close above the close price of the preceding candle. This may cause some unexpected behaviour on some markets and timeframes. I can only recommend using 24-hour markets, if and where possible, as there are far fewer gaps and, generally, more data to work with.
█ NOTES
I know a few people have been requesting a single indicator that contains all my patterns and I definitely hear you on that one. However, I have been very busy working on other projects while trying to trade and be a human at the same time. For now I am going to maintain my original approach of releasing each pattern individually so as to maintain consistency. But I am now also working on getting my some of my libraries ready for public release and in doing so I will finally be able to fit all patterns into one script. I will also be giving my scripts some TLC by making them cleaner once I have the libraries up and running. Please bear with me in the meantime, this may take a while. Cheers!

Bullish Cassiopeia B Harmonic Patterns [theEccentricTrader]█ OVERVIEW
This indicator automatically detects and draws bullish Cassiopeia B harmonic patterns and price projections derived from the ranges that constitute the patterns.
Cassiopeia A, B and C harmonic patterns are patterns that I created/discovered myself. They are all inspired by the Cassiopeia constellation and each one is based on different rotations of the constellation as it moves through the sky. The range ratios are also based on the constellation's right ascension and declination listed on Wikipedia:
Right ascension 22h 57m 04.5897s–03h 41m 14.0997s
Declination 77.6923447°–48.6632690°
en.wikipedia.org
I actually developed this idea quite a while ago now but have not felt audacious enough to introduce a new harmonic pattern, let alone 3 at the same time! But I have since been able to run backtests on tick data going back to 2002 across a variety of market and timeframe combinations and have learned that the Cassiopeia patterns can certainly hold their own against the currently known harmonic patterns.
I would also point out that the Cassiopeia constellation does actually look like a harmonic pattern and the Cassiopeia A star is literally the 'strongest source of radio emission in the sky beyond the solar system', so its arguably more of a real harmonic phenomenon than the current patterns.
www.britannica.com
chandra.si.edu
█ CONCEPTS
Green and Red Candles
• A green candle is one that closes with a close price equal to or above the price it opened.
• A red candle is one that closes with a close price that is lower than the price it opened.
Swing Highs and Swing Lows
• A swing high is a green candle or series of consecutive green candles followed by a single red candle to complete the swing and form the peak.
• A swing low is a red candle or series of consecutive red candles followed by a single green candle to complete the swing and form the trough.
Peak and Trough Prices (Basic)
• The peak price of a complete swing high is the high price of either the red candle that completes the swing high or the high price of the preceding green candle, depending on which is higher.
• The trough price of a complete swing low is the low price of either the green candle that completes the swing low or the low price of the preceding red candle, depending on which is lower.
Historic Peaks and Troughs
The current, or most recent, peak and trough occurrences are referred to as occurrence zero. Previous peak and trough occurrences are referred to as historic and ordered numerically from right to left, with the most recent historic peak and trough occurrences being occurrence one.
Range
The range is simply the difference between the current peak and current trough prices, generally expressed in terms of points or pips.
Upper Trends
• A return line uptrend is formed when the current peak price is higher than the preceding peak price.
• A downtrend is formed when the current peak price is lower than the preceding peak price.
• A double-top is formed when the current peak price is equal to the preceding peak price.
Lower Trends
• An uptrend is formed when the current trough price is higher than the preceding trough price.
• A return line downtrend is formed when the current trough price is lower than the preceding trough price.
• A double-bottom is formed when the current trough price is equal to the preceding trough price.
Muti-Part Upper and Lower Trends
• A multi-part return line uptrend begins with the formation of a new return line uptrend and continues until a new downtrend ends the trend.
• A multi-part downtrend begins with the formation of a new downtrend and continues until a new return line uptrend ends the trend.
• A multi-part uptrend begins with the formation of a new uptrend and continues until a new return line downtrend ends the trend.
• A multi-part return line downtrend begins with the formation of a new return line downtrend and continues until a new uptrend ends the trend.
Double Trends
• A double uptrend is formed when the current trough price is higher than the preceding trough price and the current peak price is higher than the preceding peak price.
• A double downtrend is formed when the current peak price is lower than the preceding peak price and the current trough price is lower than the preceding trough price.
Muti-Part Double Trends
• A multi-part double uptrend begins with the formation of a new uptrend that proceeds a new return line uptrend, and continues until a new downtrend or return line downtrend ends the trend.
• A multi-part double downtrend begins with the formation of a new downtrend that proceeds a new return line downtrend, and continues until a new uptrend or return line uptrend ends the trend.
Wave Cycles
A wave cycle is here defined as a complete two-part move between a swing high and a swing low, or a swing low and a swing high. The first swing high or swing low will set the course for the sequence of wave cycles that follow; for example a chart that begins with a swing low will form its first complete wave cycle upon the formation of the first complete swing high and vice versa.
Figure 1.
Retracement and Extension Ratios
Retracement and extension ratios are calculated by dividing the current range by the preceding range and multiplying the answer by 100. Retracement ratios are those that are equal to or below 100% of the preceding range and extension ratios are those that are above 100% of the preceding range.
Fibonacci Retracement and Extension Ratios
The Fibonacci sequence is a series of numbers in which each number is the sum of the two preceding numbers, starting with 0 and 1. For example 0 + 1 = 1, 1 + 1 = 2, 1 + 2 = 3, and so on. Ultimately, we could go on forever but the first few numbers in the sequence are as follows: 0 , 1, 1, 2, 3, 5, 8, 13, 21, 34, 55, 89, 144.
The extension ratios are calculated by dividing each number in the sequence by the number preceding it. For example 0/1 = 0, 1/1 = 1, 2/1 = 2, 3/2 = 1.5, 5/3 = 1.6666..., 8/5 = 1.6, 13/8 = 1.625, 21/13 = 1.6153..., 34/21 = 1.6190..., 55/34 = 1.6176..., 89/55 = 1.6181..., 144/89 = 1.6179..., and so on. The retracement ratios are calculated by inverting this process and dividing each number in the sequence by the number proceeding it. For example 0/1 = 0, 1/1 = 1, 1/2 = 0.5, 2/3 = 0.666..., 3/5 = 0.6, 5/8 = 0.625, 8/13 = 0.6153..., 13/21 = 0.6190..., 21/34 = 0.6176..., 34/55 = 0.6181..., 55/89 = 0.6179..., 89/144 = 0.6180..., and so on.
1.618 is considered to be the 'golden ratio', found in many natural phenomena such as the growth of seashells and the branching of trees. Some now speculate the universe oscillates at a frequency of 0,618 Hz, which could help to explain such phenomena, but this theory has yet to be proven.
Traders and analysts use Fibonacci retracement and extension indicators, consisting of horizontal lines representing different Fibonacci ratios, for identifying potential levels of support and resistance. Fibonacci ranges are typically drawn from left to right, with retracement levels representing ratios inside of the current range and extension levels representing ratios extended outside of the current range. If the current wave cycle ends on a swing low, the Fibonacci range is drawn from peak to trough. If the current wave cycle ends on a swing high the Fibonacci range is drawn from trough to peak.
Harmonic Patterns
The concept of harmonic patterns in trading was first introduced by H.M. Gartley in his book "Profits in the Stock Market", published in 1935. Gartley observed that markets have a tendency to move in repetitive patterns, and he identified several specific patterns that he believed could be used to predict future price movements.
Since then, many other traders and analysts have built upon Gartley's work and developed their own variations of harmonic patterns. One such contributor is Larry Pesavento, who developed his own methods for measuring harmonic patterns using Fibonacci ratios. Pesavento has written several books on the subject of harmonic patterns and Fibonacci ratios in trading. Another notable contributor to harmonic patterns is Scott Carney, who developed his own approach to harmonic trading in the late 1990s and also popularised the use of Fibonacci ratios to measure harmonic patterns. Carney expanded on Gartley's work and also introduced several new harmonic patterns, such as the Shark pattern and the 5-0 pattern.
The bullish and bearish Gartley patterns are the oldest recognized harmonic patterns in trading and all the other harmonic patterns are ultimately modifications of the original Gartley patterns. Gartley patterns are fundamentally composed of 5 points, or 4 waves.
Bullish and Bearish Cassiopeia B Harmonic Patterns
• Bullish Cassiopeia B patterns are fundamentally composed of three troughs and two peaks. The second peak being lower than the first peak. And the third trough being lower than both the first and second troughs, while the second trough is also lower than the first.
• Bearish Cassiopeia B patterns are fundamentally composed of three peaks and two troughs. The second trough being higher than the first trough. And the third peak being higher than both the first and second peaks, while the second peak is also higher than the first.
The ratio measurements I use to detect the patterns are as follows:
• Wave 1 of the pattern, generally referred to as XA, has no specific ratio requirements.
• Wave 2 of the pattern, generally referred to as AB, should retrace by at least 11.34%, but no further than 22.31% of the range set by wave 1.
• Wave 3 of the pattern, generally referred to as BC, should extend by at least 225.7%, but no further than 341% of the range set by wave 2.
• Wave 4 of the pattern, generally referred to as CD, should retrace by at least 77.69%, but no further than 88.66% of the range set by wave 3.
Measurement Tolerances
In general, tolerance in measurements refers to the allowable variation or deviation from a specific value or dimension. It is the range within which a particular measurement is considered to be acceptable or accurate. In this script I have applied this concept to the measurement of harmonic pattern ratios to increase to the frequency of pattern occurrences.
For example, the AB measurement of Gartley patterns is generally set at around 61.8%, but with such specificity in the measuring requirements the patterns are very rare. We can increase the frequency of pattern occurrences by setting a tolerance. A tolerance of 10% to both downside and upside, which is the default setting for all tolerances, means we would have a tolerable measurement range between 51.8-71.8%, thus increasing the frequency of occurrence.
█ FEATURES
Inputs
• AB Lower Tolerance
• AB Upper Tolerance
• BC Lower Tolerance
• BC Upper Tolerance
• CD Lower Tolerance
• CD Upper Tolerance
• Pattern Color
• Label Color
• Show Projections
• Extend Current Projection Lines
Alerts
Users can set alerts for when the patterns occur.
█ LIMITATIONS
All green and red candle calculations are based on differences between open and close prices, as such I have made no attempt to account for green candles that gap lower and close below the close price of the preceding candle, or red candles that gap higher and close above the close price of the preceding candle. This may cause some unexpected behaviour on some markets and timeframes. I can only recommend using 24-hour markets, if and where possible, as there are far fewer gaps and, generally, more data to work with.
█ NOTES
I know a few people have been requesting a single indicator that contains all my patterns and I definitely hear you on that one. However, I have been very busy working on other projects while trying to trade and be a human at the same time. For now I am going to maintain my original approach of releasing each pattern individually so as to maintain consistency. But I am now also working on getting my some of my libraries ready for public release and in doing so I will finally be able to fit all patterns into one script. I will also be giving my scripts some TLC by making them cleaner once I have the libraries up and running. Please bear with me in the meantime, this may take a while. Cheers!
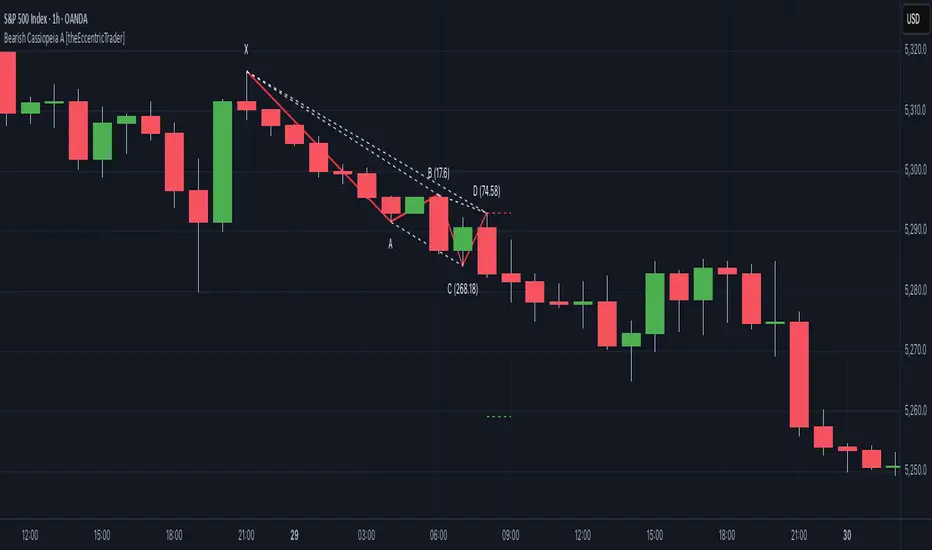
Bearish Cassiopeia A Harmonic Patterns [theEccentricTrader]█ OVERVIEW
This indicator automatically detects and draws bearish Cassiopeia A harmonic patterns and price projections derived from the ranges that constitute the patterns.
Cassiopeia A, B and C harmonic patterns are patterns that I created/discovered myself. They are all inspired by the Cassiopeia constellation and each one is based on different rotations of the constellation as it moves through the sky. The range ratios are also based on the constellation's right ascension and declination listed on Wikipedia:
Right ascension 22h 57m 04.5897s–03h 41m 14.0997s
Declination 77.6923447°–48.6632690°
en.wikipedia.org
I actually developed this idea quite a while ago now but have not felt audacious enough to introduce a new harmonic pattern, let alone 3 at the same time! But I have since been able to run backtests on tick data going back to 2002 across a variety of market and timeframe combinations and have learned that the Cassiopeia patterns can certainly hold their own against the currently known harmonic patterns.
I would also point out that the Cassiopeia constellation does actually look like a harmonic pattern and the Cassiopeia A star is literally the 'strongest source of radio emission in the sky beyond the solar system', so its arguably more of a real harmonic phenomenon than the current patterns.
www.britannica.com
chandra.si.edu
█ CONCEPTS
Green and Red Candles
• A green candle is one that closes with a close price equal to or above the price it opened.
• A red candle is one that closes with a close price that is lower than the price it opened.
Swing Highs and Swing Lows
• A swing high is a green candle or series of consecutive green candles followed by a single red candle to complete the swing and form the peak.
• A swing low is a red candle or series of consecutive red candles followed by a single green candle to complete the swing and form the trough.
Peak and Trough Prices (Basic)
• The peak price of a complete swing high is the high price of either the red candle that completes the swing high or the high price of the preceding green candle, depending on which is higher.
• The trough price of a complete swing low is the low price of either the green candle that completes the swing low or the low price of the preceding red candle, depending on which is lower.
Historic Peaks and Troughs
The current, or most recent, peak and trough occurrences are referred to as occurrence zero. Previous peak and trough occurrences are referred to as historic and ordered numerically from right to left, with the most recent historic peak and trough occurrences being occurrence one.
Range
The range is simply the difference between the current peak and current trough prices, generally expressed in terms of points or pips.
Upper Trends
• A return line uptrend is formed when the current peak price is higher than the preceding peak price.
• A downtrend is formed when the current peak price is lower than the preceding peak price.
• A double-top is formed when the current peak price is equal to the preceding peak price.
Lower Trends
• An uptrend is formed when the current trough price is higher than the preceding trough price.
• A return line downtrend is formed when the current trough price is lower than the preceding trough price.
• A double-bottom is formed when the current trough price is equal to the preceding trough price.
Muti-Part Upper and Lower Trends
• A multi-part return line uptrend begins with the formation of a new return line uptrend and continues until a new downtrend ends the trend.
• A multi-part downtrend begins with the formation of a new downtrend and continues until a new return line uptrend ends the trend.
• A multi-part uptrend begins with the formation of a new uptrend and continues until a new return line downtrend ends the trend.
• A multi-part return line downtrend begins with the formation of a new return line downtrend and continues until a new uptrend ends the trend.
Double Trends
• A double uptrend is formed when the current trough price is higher than the preceding trough price and the current peak price is higher than the preceding peak price.
• A double downtrend is formed when the current peak price is lower than the preceding peak price and the current trough price is lower than the preceding trough price.
Muti-Part Double Trends
• A multi-part double uptrend begins with the formation of a new uptrend that proceeds a new return line uptrend, and continues until a new downtrend or return line downtrend ends the trend.
• A multi-part double downtrend begins with the formation of a new downtrend that proceeds a new return line downtrend, and continues until a new uptrend or return line uptrend ends the trend.
Wave Cycles
A wave cycle is here defined as a complete two-part move between a swing high and a swing low, or a swing low and a swing high. The first swing high or swing low will set the course for the sequence of wave cycles that follow; for example a chart that begins with a swing low will form its first complete wave cycle upon the formation of the first complete swing high and vice versa.
Figure 1.
Retracement and Extension Ratios
Retracement and extension ratios are calculated by dividing the current range by the preceding range and multiplying the answer by 100. Retracement ratios are those that are equal to or below 100% of the preceding range and extension ratios are those that are above 100% of the preceding range.
Fibonacci Retracement and Extension Ratios
The Fibonacci sequence is a series of numbers in which each number is the sum of the two preceding numbers, starting with 0 and 1. For example 0 + 1 = 1, 1 + 1 = 2, 1 + 2 = 3, and so on. Ultimately, we could go on forever but the first few numbers in the sequence are as follows: 0 , 1, 1, 2, 3, 5, 8, 13, 21, 34, 55, 89, 144.
The extension ratios are calculated by dividing each number in the sequence by the number preceding it. For example 0/1 = 0, 1/1 = 1, 2/1 = 2, 3/2 = 1.5, 5/3 = 1.6666..., 8/5 = 1.6, 13/8 = 1.625, 21/13 = 1.6153..., 34/21 = 1.6190..., 55/34 = 1.6176..., 89/55 = 1.6181..., 144/89 = 1.6179..., and so on. The retracement ratios are calculated by inverting this process and dividing each number in the sequence by the number proceeding it. For example 0/1 = 0, 1/1 = 1, 1/2 = 0.5, 2/3 = 0.666..., 3/5 = 0.6, 5/8 = 0.625, 8/13 = 0.6153..., 13/21 = 0.6190..., 21/34 = 0.6176..., 34/55 = 0.6181..., 55/89 = 0.6179..., 89/144 = 0.6180..., and so on.
1.618 is considered to be the 'golden ratio', found in many natural phenomena such as the growth of seashells and the branching of trees. Some now speculate the universe oscillates at a frequency of 0,618 Hz, which could help to explain such phenomena, but this theory has yet to be proven.
Traders and analysts use Fibonacci retracement and extension indicators, consisting of horizontal lines representing different Fibonacci ratios, for identifying potential levels of support and resistance. Fibonacci ranges are typically drawn from left to right, with retracement levels representing ratios inside of the current range and extension levels representing ratios extended outside of the current range. If the current wave cycle ends on a swing low, the Fibonacci range is drawn from peak to trough. If the current wave cycle ends on a swing high the Fibonacci range is drawn from trough to peak.
Harmonic Patterns
The concept of harmonic patterns in trading was first introduced by H.M. Gartley in his book "Profits in the Stock Market", published in 1935. Gartley observed that markets have a tendency to move in repetitive patterns, and he identified several specific patterns that he believed could be used to predict future price movements.
Since then, many other traders and analysts have built upon Gartley's work and developed their own variations of harmonic patterns. One such contributor is Larry Pesavento, who developed his own methods for measuring harmonic patterns using Fibonacci ratios. Pesavento has written several books on the subject of harmonic patterns and Fibonacci ratios in trading. Another notable contributor to harmonic patterns is Scott Carney, who developed his own approach to harmonic trading in the late 1990s and also popularised the use of Fibonacci ratios to measure harmonic patterns. Carney expanded on Gartley's work and also introduced several new harmonic patterns, such as the Shark pattern and the 5-0 pattern.
The bullish and bearish Gartley patterns are the oldest recognized harmonic patterns in trading and all the other harmonic patterns are ultimately modifications of the original Gartley patterns. Gartley patterns are fundamentally composed of 5 points, or 4 waves.
Bullish and Bearish Cassiopeia A Harmonic Patterns
• Bullish Cassiopeia A patterns are fundamentally composed of three troughs and two peaks. The second peak being higher than the first peak. And the third trough being higher than both the first and second troughs, while the second trough is also higher than the first.
• Bearish Cassiopeia A patterns are fundamentally composed of three peaks and two troughs. The second trough being lower than the first trough. And the third peak being lower than both the first and second peaks, while the second peak is also lower than the first.
The ratio measurements I use to detect the patterns are as follows:
• Wave 1 of the pattern, generally referred to as XA, has no specific ratio requirements.
• Wave 2 of the pattern, generally referred to as AB, should retrace by at least 11.34%, but no further than 22.31% of the range set by wave 1.
• Wave 3 of the pattern, generally referred to as BC, should extend by at least 225.7%, but no further than 341% of the range set by wave 2.
• Wave 4 of the pattern, generally referred to as CD, should retrace by at least 77.69%, but no further than 88.66% of the range set by wave 3.
Measurement Tolerances
In general, tolerance in measurements refers to the allowable variation or deviation from a specific value or dimension. It is the range within which a particular measurement is considered to be acceptable or accurate. In this script I have applied this concept to the measurement of harmonic pattern ratios to increase to the frequency of pattern occurrences.
For example, the AB measurement of Gartley patterns is generally set at around 61.8%, but with such specificity in the measuring requirements the patterns are very rare. We can increase the frequency of pattern occurrences by setting a tolerance. A tolerance of 10% to both downside and upside, which is the default setting for all tolerances, means we would have a tolerable measurement range between 51.8-71.8%, thus increasing the frequency of occurrence.
█ FEATURES
Inputs
• AB Lower Tolerance
• AB Upper Tolerance
• BC Lower Tolerance
• BC Upper Tolerance
• CD Lower Tolerance
• CD Upper Tolerance
• Pattern Color
• Label Color
• Show Projections
• Extend Current Projection Lines
Alerts
Users can set alerts for when the patterns occur.
█ LIMITATIONS
All green and red candle calculations are based on differences between open and close prices, as such I have made no attempt to account for green candles that gap lower and close below the close price of the preceding candle, or red candles that gap higher and close above the close price of the preceding candle. This may cause some unexpected behaviour on some markets and timeframes. I can only recommend using 24-hour markets, if and where possible, as there are far fewer gaps and, generally, more data to work with.
█ NOTES
I know a few people have been requesting a single indicator that contains all my patterns and I definitely hear you on that one. However, I have been very busy working on other projects while trying to trade and be a human at the same time. For now I am going to maintain my original approach of releasing each pattern individually so as to maintain consistency. But I am now also working on getting my some of my libraries ready for public release and in doing so I will finally be able to fit all patterns into one script. I will also be giving my scripts some TLC by making them cleaner once I have the libraries up and running. Please bear with me in the meantime, this may take a while. Cheers!
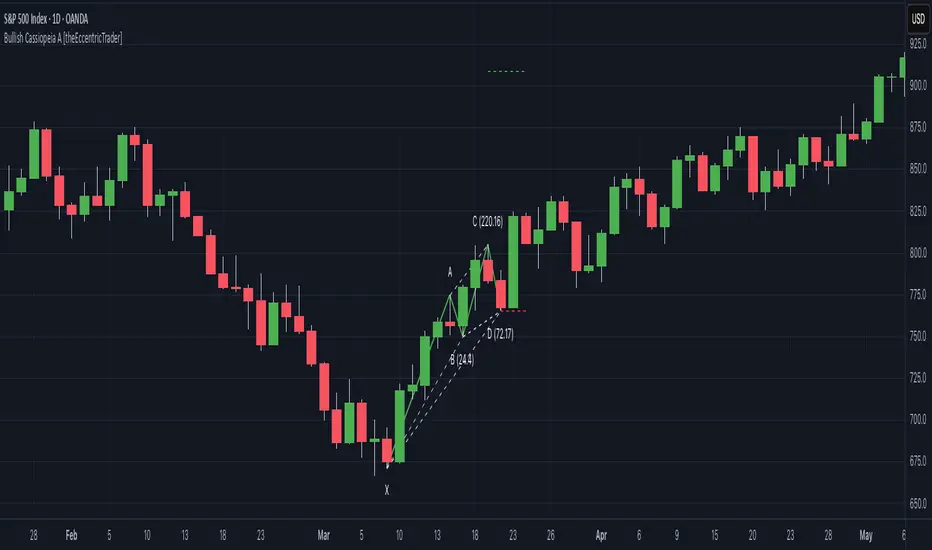
Bullish Cassiopeia A Harmonic Patterns [theEccentricTrader]█ OVERVIEW
This indicator automatically detects and draws bullish Cassiopeia A harmonic patterns and price projections derived from the ranges that constitute the patterns.
Cassiopeia A, B and C harmonic patterns are patterns that I created/discovered myself. They are all inspired by the Cassiopeia constellation and each one is based on different rotations of the constellation as it moves through the sky. The range ratios are also based on the constellation's right ascension and declination listed on Wikipedia:
Right ascension 22h 57m 04.5897s–03h 41m 14.0997s
Declination 77.6923447°–48.6632690°
en.wikipedia.org
I actually developed this idea quite a while ago now but have not felt audacious enough to introduce a new harmonic pattern, let alone 3 at the same time! But I have since been able to run backtests on tick data going back to 2002 across a variety of market and timeframe combinations and have learned that the Cassiopeia patterns can certainly hold their own against the currently known harmonic patterns. As can be seen in the picture above the bullish Cassiopeia A caught the 2009 bear market bottom almost perfectly.
I would also point out that the Cassiopeia constellation does actually look like a harmonic pattern and the Cassiopeia A star is literally the 'strongest source of radio emission in the sky beyond the solar system', so its arguably more of a real harmonic phenomenon than the current patterns.
www.britannica.com
chandra.si.edu
█ CONCEPTS
Green and Red Candles
• A green candle is one that closes with a close price equal to or above the price it opened.
• A red candle is one that closes with a close price that is lower than the price it opened.
Swing Highs and Swing Lows
• A swing high is a green candle or series of consecutive green candles followed by a single red candle to complete the swing and form the peak.
• A swing low is a red candle or series of consecutive red candles followed by a single green candle to complete the swing and form the trough.
Peak and Trough Prices (Basic)
• The peak price of a complete swing high is the high price of either the red candle that completes the swing high or the high price of the preceding green candle, depending on which is higher.
• The trough price of a complete swing low is the low price of either the green candle that completes the swing low or the low price of the preceding red candle, depending on which is lower.
Historic Peaks and Troughs
The current, or most recent, peak and trough occurrences are referred to as occurrence zero. Previous peak and trough occurrences are referred to as historic and ordered numerically from right to left, with the most recent historic peak and trough occurrences being occurrence one.
Range
The range is simply the difference between the current peak and current trough prices, generally expressed in terms of points or pips.
Upper Trends
• A return line uptrend is formed when the current peak price is higher than the preceding peak price.
• A downtrend is formed when the current peak price is lower than the preceding peak price.
• A double-top is formed when the current peak price is equal to the preceding peak price.
Lower Trends
• An uptrend is formed when the current trough price is higher than the preceding trough price.
• A return line downtrend is formed when the current trough price is lower than the preceding trough price.
• A double-bottom is formed when the current trough price is equal to the preceding trough price.
Muti-Part Upper and Lower Trends
• A multi-part return line uptrend begins with the formation of a new return line uptrend and continues until a new downtrend ends the trend.
• A multi-part downtrend begins with the formation of a new downtrend and continues until a new return line uptrend ends the trend.
• A multi-part uptrend begins with the formation of a new uptrend and continues until a new return line downtrend ends the trend.
• A multi-part return line downtrend begins with the formation of a new return line downtrend and continues until a new uptrend ends the trend.
Double Trends
• A double uptrend is formed when the current trough price is higher than the preceding trough price and the current peak price is higher than the preceding peak price.
• A double downtrend is formed when the current peak price is lower than the preceding peak price and the current trough price is lower than the preceding trough price.
Muti-Part Double Trends
• A multi-part double uptrend begins with the formation of a new uptrend that proceeds a new return line uptrend, and continues until a new downtrend or return line downtrend ends the trend.
• A multi-part double downtrend begins with the formation of a new downtrend that proceeds a new return line downtrend, and continues until a new uptrend or return line uptrend ends the trend.
Wave Cycles
A wave cycle is here defined as a complete two-part move between a swing high and a swing low, or a swing low and a swing high. The first swing high or swing low will set the course for the sequence of wave cycles that follow; for example a chart that begins with a swing low will form its first complete wave cycle upon the formation of the first complete swing high and vice versa.
Figure 1.
Retracement and Extension Ratios
Retracement and extension ratios are calculated by dividing the current range by the preceding range and multiplying the answer by 100. Retracement ratios are those that are equal to or below 100% of the preceding range and extension ratios are those that are above 100% of the preceding range.
Fibonacci Retracement and Extension Ratios
The Fibonacci sequence is a series of numbers in which each number is the sum of the two preceding numbers, starting with 0 and 1. For example 0 + 1 = 1, 1 + 1 = 2, 1 + 2 = 3, and so on. Ultimately, we could go on forever but the first few numbers in the sequence are as follows: 0 , 1, 1, 2, 3, 5, 8, 13, 21, 34, 55, 89, 144.
The extension ratios are calculated by dividing each number in the sequence by the number preceding it. For example 0/1 = 0, 1/1 = 1, 2/1 = 2, 3/2 = 1.5, 5/3 = 1.6666..., 8/5 = 1.6, 13/8 = 1.625, 21/13 = 1.6153..., 34/21 = 1.6190..., 55/34 = 1.6176..., 89/55 = 1.6181..., 144/89 = 1.6179..., and so on. The retracement ratios are calculated by inverting this process and dividing each number in the sequence by the number proceeding it. For example 0/1 = 0, 1/1 = 1, 1/2 = 0.5, 2/3 = 0.666..., 3/5 = 0.6, 5/8 = 0.625, 8/13 = 0.6153..., 13/21 = 0.6190..., 21/34 = 0.6176..., 34/55 = 0.6181..., 55/89 = 0.6179..., 89/144 = 0.6180..., and so on.
1.618 is considered to be the 'golden ratio', found in many natural phenomena such as the growth of seashells and the branching of trees. Some now speculate the universe oscillates at a frequency of 0,618 Hz, which could help to explain such phenomena, but this theory has yet to be proven.
Traders and analysts use Fibonacci retracement and extension indicators, consisting of horizontal lines representing different Fibonacci ratios, for identifying potential levels of support and resistance. Fibonacci ranges are typically drawn from left to right, with retracement levels representing ratios inside of the current range and extension levels representing ratios extended outside of the current range. If the current wave cycle ends on a swing low, the Fibonacci range is drawn from peak to trough. If the current wave cycle ends on a swing high the Fibonacci range is drawn from trough to peak.
Harmonic Patterns
The concept of harmonic patterns in trading was first introduced by H.M. Gartley in his book "Profits in the Stock Market", published in 1935. Gartley observed that markets have a tendency to move in repetitive patterns, and he identified several specific patterns that he believed could be used to predict future price movements.
Since then, many other traders and analysts have built upon Gartley's work and developed their own variations of harmonic patterns. One such contributor is Larry Pesavento, who developed his own methods for measuring harmonic patterns using Fibonacci ratios. Pesavento has written several books on the subject of harmonic patterns and Fibonacci ratios in trading. Another notable contributor to harmonic patterns is Scott Carney, who developed his own approach to harmonic trading in the late 1990s and also popularised the use of Fibonacci ratios to measure harmonic patterns. Carney expanded on Gartley's work and also introduced several new harmonic patterns, such as the Shark pattern and the 5-0 pattern.
The bullish and bearish Gartley patterns are the oldest recognized harmonic patterns in trading and all the other harmonic patterns are ultimately modifications of the original Gartley patterns. Gartley patterns are fundamentally composed of 5 points, or 4 waves.
Bullish and Bearish Cassiopeia A Harmonic Patterns
• Bullish Cassiopeia A patterns are fundamentally composed of three troughs and two peaks. The second peak being higher than the first peak. And the third trough being higher than both the first and second troughs, while the second trough is also higher than the first.
• Bearish Cassiopeia A patterns are fundamentally composed of three peaks and two troughs. The second trough being lower than the first trough. And the third peak being lower than both the first and second peaks, while the second peak is also lower than the first.
The ratio measurements I use to detect the patterns are as follows:
• Wave 1 of the pattern, generally referred to as XA, has no specific ratio requirements.
• Wave 2 of the pattern, generally referred to as AB, should retrace by at least 11.34%, but no further than 22.31% of the range set by wave 1.
• Wave 3 of the pattern, generally referred to as BC, should extend by at least 225.7%, but no further than 341% of the range set by wave 2.
• Wave 4 of the pattern, generally referred to as CD, should retrace by at least 77.69%, but no further than 88.66% of the range set by wave 3.
Measurement Tolerances
In general, tolerance in measurements refers to the allowable variation or deviation from a specific value or dimension. It is the range within which a particular measurement is considered to be acceptable or accurate. In this script I have applied this concept to the measurement of harmonic pattern ratios to increase to the frequency of pattern occurrences.
For example, the AB measurement of Gartley patterns is generally set at around 61.8%, but with such specificity in the measuring requirements the patterns are very rare. We can increase the frequency of pattern occurrences by setting a tolerance. A tolerance of 10% to both downside and upside, which is the default setting for all tolerances, means we would have a tolerable measurement range between 51.8-71.8%, thus increasing the frequency of occurrence.
█ FEATURES
Inputs
• AB Lower Tolerance
• AB Upper Tolerance
• BC Lower Tolerance
• BC Upper Tolerance
• CD Lower Tolerance
• CD Upper Tolerance
• Pattern Color
• Label Color
• Show Projections
• Extend Current Projection Lines
Alerts
Users can set alerts for when the patterns occur.
█ LIMITATIONS
All green and red candle calculations are based on differences between open and close prices, as such I have made no attempt to account for green candles that gap lower and close below the close price of the preceding candle, or red candles that gap higher and close above the close price of the preceding candle. This may cause some unexpected behaviour on some markets and timeframes. I can only recommend using 24-hour markets, if and where possible, as there are far fewer gaps and, generally, more data to work with.
█ NOTES
I know a few people have been requesting a single indicator that contains all my patterns and I definitely hear you on that one. However, I have been very busy working on other projects while trying to trade and be a human at the same time. For now I am going to maintain my original approach of releasing each pattern individually so as to maintain consistency. But I am now also working on getting my some of my libraries ready for public release and in doing so I will finally be able to fit all patterns into one script. I will also be giving my scripts some TLC by making them cleaner once I have the libraries up and running. Please bear with me in the meantime, this may take a while. Cheers!
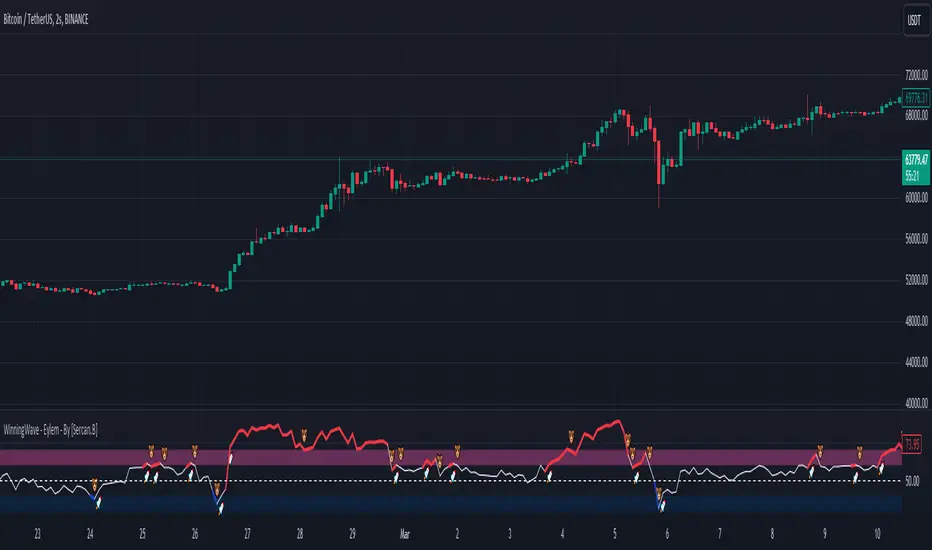
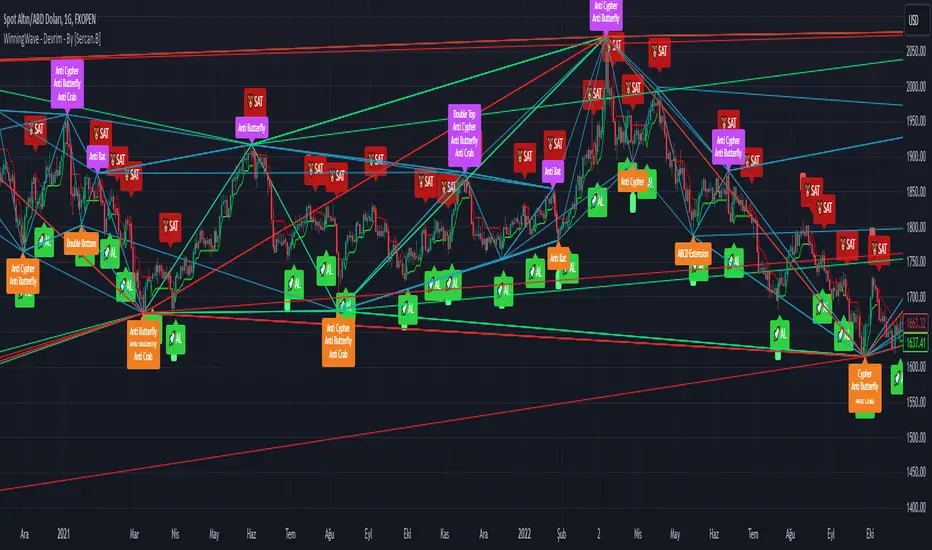
WinningWave - Eylem - By [Sercan.B]"WinningWave - Eylem" is designed as an auxiliary oscillator to the "WinningWave - Devrim" indicator. This specialized tool stands out for its ability to generate buy-sell signals that are compatible with the harmonic formations identified by Devrim. While the primary indicator, Devrim, is utilized to determine harmonic formations and potential trend reversal points in the market, the Eylem indicator provides compatible signals following the formation of these patterns, helping investors to capitalize on these opportunities optimally.
"WinningWave - Eylem" is crafted to predict market momentum and trend reversals based on the formations detected by the Devrim indicator. This synergy offers investors sharp awareness to act when formations are completed and new trends are about to commence.
When used together with Devrim, the Eylem indicator enables investors to analyze market movements from a broader perspective and base their investment decisions on a stronger foundation. In addition to harmonic formations, this auxiliary oscillator, which can adapt to market dynamics, provides investors with a significant tool for determining market entry and exit points. Thus, WinningWave - Eylem enhances Devrim's analytical capabilities, facilitating the process of making informed investments in the financial markets.
Please be aware that using this oscillator alone may lead to financial losses. Remember, it is designed to be an auxiliary oscillator.
Note: In line with my personal impartiality principles, the definition and usage of the indicator were created by analyzing the codes via ChatGPT.
Important note: The indicator is a confirmation oscillator for the buy section. Its function is to confirm the indicator on the main screen.
- As seen in the image, the ''Eylem'' indicator is the auxiliary oscillator of the "Devrim" indicator. Buy and Sell signals have been changed to "Rocket" and "Bear" emojis.
-The Rocket emoji represents the buying areas during the formation periods of harmonic formations.
-The Bear emoji represents the selling areas during the formation periods of harmonic formations.
-Winningwave is the auxiliary oscillator of the Devrim indicator. Its use alone can lead to financial loss.
WinningWave - Devrim - By [Sercan.B]WinningWave - Devrim is an extremely advanced technical analysis tool designed to understand fluctuations in the financial markets and provide investors with reliable buying and selling decisions based on this information. This tool integrates various analysis methods to detect market trends and potential reversal points.
Fundamentally, WinningWave - Devrim deeply examines market movements using ZigZag analyses, harmonic pattern recognition, and various indicators such as RSI. ZigZag analyses filter out the noise of short-term price movements, offering a cleaner view of market trends and identifying significant peaks and troughs. The harmonic pattern recognition feature utilizes the recurring nature of specific price patterns to indicate potential buying and selling areas. These patterns provide clues about the possible future directions of price movements.
The strength of WinningWave - Devrim lies not only in identifying specific patterns and trends but also in presenting this information in a way that can be integrated into investors' strategies. Investors can clearly see when to enter or exit the market, thanks to the visual signals and patterns provided by the indicator.
Moreover, WinningWave - Devrim offers a set of customizable settings according to user preferences. This feature is critical for adapting to different market conditions and investment strategies. For example, an investor can adjust the ATR period, which measures volatility, to receive the most suitable signals for the current market condition.
Thanks to the specially tailored artificial intelligence coding for pattern finding for each time period, it alerts the user as a formation by analyzing the possible start and end areas of Trends specific to time periods. Additionally, a buy and sell signal compatible with harmonic pattern-based trend scanning technique accompanies harmonic formations. The buy or sell signal that comes immediately after the formation is created provides detailed awareness for the user to enter or exit the game.
The option to set separate alerts for the formation of each pattern and for every buy-sell signal frees users from the necessity of monitoring the screen constantly.
Lastly, WinningWave - Devrim offers investors a broad perspective for market analysis. With this tool, investors can identify market trends, potential reversal points, and buying and selling opportunities, optimize risk management, and apply their investment strategies more consciously.
Note: In line with my principle of personal neutrality, the description and usage of the indicator have been written by analyzing the codes through ChatGPT.
- Adhering to buy and sell signals is crucial for securing transactions at points where harmonic patterns form. This importance stems from the fact that the legs of harmonic formations can extend according to Fibonacci values. In other words, a harmonic formation signal does not have to occur immediately when it is received. Therefore, buy and sell signal labels, transformed into signals with settings compatible with formations and based on ATR, aim to minimize the margin of error in transactions.
- Harmonic formations are an analysis method in financial markets that is based on specific mathematical properties and ratios of price movements. These formations rely on mathematical concepts such as the Fibonacci number sequence and are used to predict how price movements may behave in the future. The idea behind harmonic formations is that certain patterns tend to repeat in market price movements. These patterns are used to identify potential buying and selling points.
- Paintings are representative. It was drawn for those who cannot see that zigzag lines and formation labels create mathematics and a formation.
- The Super Trend ATR (Average True Range) is a popular trend-following indicator used in financial markets. This indicator creates a line that moves above or below the price as a function of the Average True Range (ATR), indicating the direction of the trend. The Super Trend is used both to determine the direction of the trend and to identify potential entry and exit points.
The Super Trend indicator is based on two main parameters: a period of the ATR and a multiplier. The indicator measures the volatility of price movements over the specified ATR period and applies a multiplier based on this volatility. Then, this calculated value is placed above or below the price to determine the direction of the trend. If the price is above the line, the market is considered to be in an uptrend, and if below, in a downtrend.
Buy and Sell signals were written in the most compatible way with harmonic formations for the Super Trend ATR and adjusted according to the most accurate areas of Fibonacci values. Thus, if the signal following the formation of harmonic formations is entering an uptrend or downtrend, it helps us find the most suitable entry and exit points.
- Zigzag Indicator
The Zigzag indicator is a tool that filters out minor price fluctuations and noise to better see the direction of price movements. This indicator ignores price movements until they reach a specified percentage change and only connects the movements that exceed this change with a line. As a result, investors can more easily identify the main trends and potential reversal points in the market.
The Zigzag indicator is particularly effective in identifying the maximum and minimum points in the market and when used in conjunction with other technical analysis tools like Fibonacci retracement.
Pivot Points
Pivot points are a type of indicator used to determine the general trend of the market. This calculation is made using the high, low, and closing prices of the previous period. The basic pivot point is calculated by taking the average of these three values. Around this basic pivot point, resistance and support levels are also calculated. Resistance levels represent potential obstacles that the price may encounter moving upwards, while support levels represent potential "floor" areas when the price is moving downwards.
Pivot points are especially useful for daily trading activities because traders can use these points to predict the likely direction of market movements within the day. These points can also serve as potential buying and selling areas.
Both indicators assist investors and traders in analyzing market movements and making decisions, but it is always recommended to use them in conjunction with other analysis methods and consider market conditions.
Price Action Fractal Forecasts [AlgoAlpha]🔮 Price Action Fractal Forecasts - Unleash the Power of Historical Patterns! 🌌✨
Dive into the future with AlgoAlpha's Price Action Fractal Forecasts ! This innovative indicator utilizes the mesmerizing complexity of fractals to predict future price movements, offering traders a unique edge in the market. By analyzing historical price action and identifying repeating patterns, this tool forecasts future price trends, providing visually engaging and actionable insights.
Key Features:
🔄 Flexible Data Series Selection: Choose your preferred data series for precise analysis.
🕰 Flexible Training and Reference Data Windows: Customize the length of training data and reference periods to match your trading style.
📈 Custom Forecast Length: Adjust the forecast horizon to suit your strategic objectives.
🌈 Customizable Visual Elements: Tailor the colors of forecast deviation cones, data reference areas, and more for optimal chart readability.
🔄 Anticipatory and Repetitive Forecast Modes: Select between anticipating future trends or identifying repetitive patterns for forecasts.
🔎 Enhanced Similarity Search: Leverages correlation metrics to find the most similar historical data segments.
📊 Forecast Deviation Cone: Visualize potential price range deviations with adjustable multipliers.
🚀 Quick Guide to Maximizing Your Trading with Price Action Fractal Forecasts:
🛠 Add the Indicator: Search for "Price Action Fractal Forecasts" in TradingView's Indicators & Strategies. Customize settings according to your trading strategy.
📊 Strategic Forecasting: Monitor the forecast deviation cone and forecast directional changes for insights into potential future price movements.
🔔 Alerts for Swift Action: Set up notifications based on forecast changes to stay ahead of market movements without constant monitoring.
Behind the Magic: How It Works
The core of the Price Action Fractal Forecasts lies in its ability to compare current market behavior with historical data to unearth similar patterns. It first establishes a training data window to analyze historical prices. Within this window, it then defines a reference length to identify the most recent price action that will serve as the basis for comparison. The indicator searches through the historical data within the training window to find segments that closely match the recent price action in the reference period.
Depending on whether you choose the anticipatory or repetitive forecast mode, the indicator either looks ahead to predict future prices based on past outcomes following similar patterns or focuses on the repeating patterns within the reference period itself for forecasts. The forecast's direction can be configured to reflect the mean average of forecasted prices or the end-point relative to the start-point of the forecast, offering flexibility in how forecasts are interpreted.
To enhance the comprehensiveness and visualization, the indicator features a forecast deviation cone. This cone represents the potential range of price movements, providing a visual cue for volatility and uncertainty in the forecasted prices. The intensity of this cone can be adjusted to suit individual preferences, offering a visual guide to the level of risk and uncertainty associated with the forecasted price path.
Embrace the fractal magic of markets with AlgoAlpha's Price Action Fractal Forecasts and transform your trading today! 🌟🚀

[strategy][1H] SPY slow stochastics
SPY slow stochastics
Overview
The "SPY Auto RSI Stochastics" strategy is designed to leverage a combination of Relative Strength Index (RSI) and Stochastic indicators to identify potential entry and exit points in trading the SPY $SP:SPX.
The technicals:
A simple yet effective strategy for identifying (reversal) trends on SPY (or any asset).
The logic is as follows:
1. Slow stochastics are effective at predicting momentum. They can also be used to effectively identify reversals.
2. A combination of slow and fast RSI (along with an SMA for the fast RSI) can be used to see potential changes in the directional trend of the underlying asset.
3. In order to reduce noise, a band in the middle of RSI values is ignored; think of this as the price converging and potential explosions (sometimes fake) on either side.
4. Outside this noise band, a crossover of fast RSI on slow RSI indicates an upward trend incoming.
5. A crossunder of fast RSI on slow RSI indicates a downward trend incoming.
Strategy Specific Notes -
1. Load this strategy on SPREADEX:SPX on an hourly chart for the best results.
2. This is a generic strategy, use it on anything - index, stocks, etc. You will need to adjust the parameters for the best results.
3. The RSI Upper defines the cutoff for two things -- threshold for entering a long AND exit signal for short. Likewise for RSI Lower.
4. To have alerts on the strategy, add this to your chart, be content with the backtesting results, select "strategy tester", the alert icon, replace the message body with "{{strategy.order.alert_message}}" without the ".
5. In my experience, the strategy won't be immediately profitable upon a signal but it does get there in the backtested results. Intuitively, this makes sense. Reversals take some time to kick in completely.
Inputs
- **slowRSILength**: Length parameter for the slow RSI calculation.
- **fastRSILength**: Length parameter for the fast RSI calculation.
- **smaRSILength**: Length parameter for the Simple Moving Average (SMA) of the fast RSI.
- **RSIUpperThreshold**: Upper threshold for the RSI, used in exit conditions.
- **RSILowerThreshold**: Lower threshold for the RSI, used in exit conditions.
- **RSIUpperDeadzone**: Upper deadzone threshold for the RSI.
- **RSILowerDeadzone**: Lower deadzone threshold for the RSI.
Strategy Logic
- **RSI Calculation**: The script calculates both slow and fast RSI values based on the provided lengths.
- **Entry Condition**: Entry conditions for long and short positions are based on the crossing of fast RSI over slow RSI and SMA RSI, respectively, along with avoidance of RSI deadzones and validation of trade time.
- **Exit Condition**: Exit conditions for both long and short positions are based on crossing RSI thresholds or opposite entry conditions.
Trade Management
- **Position Entry**: Long and short positions are entered based on predefined entry conditions.
- **Position Exit**: Positions are exited based on predefined exit conditions.
- **Alerts**: The script provides alert messages for entry and exit points.
Plotting
- **Slow RSI**: Plots the slow RSI on the chart.
- **SMA RSI**: Plots the Simple Moving Average of fast RSI on the chart.
Example Usage
The defaults work well for SPY on a 1H timeframe.
If you apply this to anything else DAX, EUSTX50, FTSE, CAC (these are what i have); tweak the input parameters.
Plotting
plot(slowRSI, "Slow RSI", color=color.green) //or fastRSI
plot(smaRSI, "SMA RSI", color=color.white)
Conclusion
The "SPY Auto RSI Stochastics" strategy combines RSI and Stochastic indicators to provide potential trade signals for the SPY ETF. Traders can use this strategy with proper risk management and analysis to enhance their trading decisions.
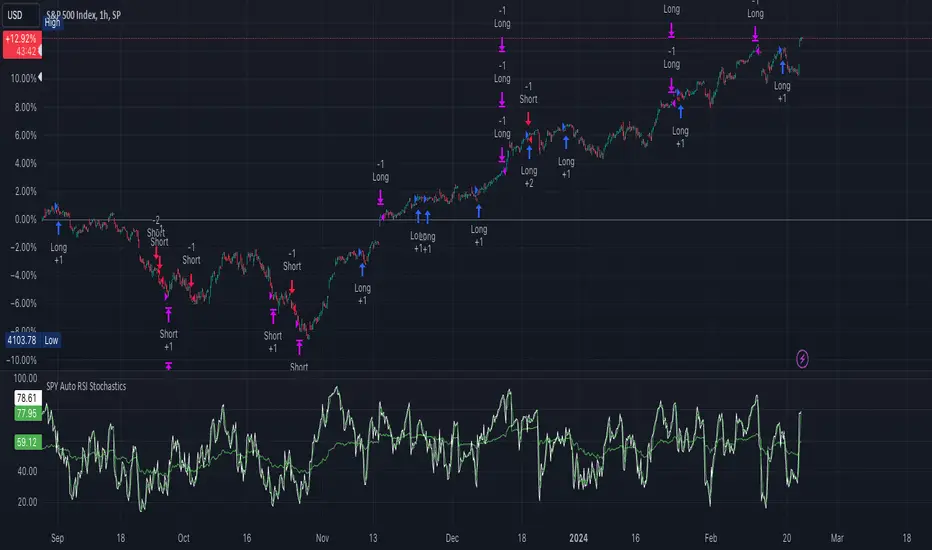
Otekura Range Trade Algorithm [Chain Hood]The Range Trade Algorithm calculates the levels for Monday.
On the chart you will see that the Monday levels will be marked as 1 0 -1.
The M High level calculates Monday's high close and plots it on the screen.
M Low calculates the low close of Monday and plots it on the screen.
The coloured lines on the screen are the points of the range levels formulated with fibonacci values.
The indicator has its own Value table. The prices of the levels are written.
Potential Range breakout targets tell prices at points matching the fibonacci values. These are Take profit or reversal points.
Buy and Sell indicators are determined by the range breakout.
Users can set an alarm on the indicator and receive direct notification with their targets when a new range occurs.
Fib values are multiplied by range values and create an average target according to the price situation. These values represent an area. Breakdown targets show that the target is targeted until the area.
Converging Chart Patterns - Ultimate [Trendoscope®]🎲 Introducing the Converging Chart Patterns Ultimate Indicator
Derived from the comprehensive capabilities of our premium offering, the Auto Chart Patterns - Ultimate , this new indicator focuses exclusively on converging chart patterns. It marks the beginning of a series that, over time, will encompass the full spectrum of chart pattern analysis, ultimately enhancing and expanding beyond the scope of Auto Chart Patterns.
This strategic separation into more focused indicators is designed to cater to traders seeking precision in specific chart pattern categories.
🎲 Leveraging Research and Open-Source Foundations
Our journey to this indicator has been paved by extensive research and the insights gained from our prior works on Chart Patterns, including:
Algorithmic Identification of Chart Patterns
Flag and Pennant Chart Patterns
Trading Converging Chart Patterns
Drawing upon the foundation laid by our publicly shared indicators - Auto Chart Patterns and Flags and Pennants - this tool is the culmination of our efforts to provide traders with a refined method for strategizing around converging patterns. It not only facilitates the development of technical trading strategies but also aids in evaluating their effectiveness through historical performance analysis. The specific patterns addressed by this indicator include:
Rising Wedge (Converging Type)
Falling Wedge (Converging Type)
Converging Triangle
Rising Triangle (Converging Type)
Falling Triangle (Converging Type)
🎲 Chart Pattern Scanning Methodology
The process of identifying converging chart patterns involves several key steps:
Begin by examining each zigzag for the last 5 or 6 pivot points to identify potential trend line pairs.
Determine if these trend lines are converging by projecting them forwards and checking for an intersection within a specified number of bars ahead.
Upon confirming convergence, categorize each pattern based on the directional orientation of its trend lines, as detailed in our article - Algorithmic Identification of Chart Patterns
🎲 Methodology or Trading for Chart Patterns
While traditional views assign specific trading biases to converging patterns (e.g., Rising Wedges as bearish and Falling Wedges as bullish, with Triangles being more versatile), empirical support for these assumptions is limited. Our indicator is designed to empower users to explore and validate various trading hypotheses, including unconventional ones, thereby not confining trading strategies to past market behaviors.
We enable extensive customization for testing different strategies, with the initial setup allowing for both long and short trading scenarios for each identified pattern. Users have the liberty to adjust trading directions and other parameters within the indicator's settings to suit their analytical needs.
This open approach is rooted in the methodology outlined in - Trading Converging Chart Patterns , exemplified by the following process, which users can adapt and refine through our indicator.
🎲 Overview of Indicator Components
The components of our indicator are illustrated in the chart below
Pattern Visualization : This feature dynamically displays the patterns on the chart, focusing on currently active patterns. To maintain clarity and performance, historical patterns are not shown due to the constraints of drawing objects.
Trading Annotations : The indicator marks open trades directly on the chart, accommodating both long and short positions depending on the user's settings and the current status of trades associated with each pattern.
Performance Metrics Table : A comprehensive table presents the back testing results for individual patterns as well as aggregated outcomes. It includes crucial metrics such as win rates and the profit factor based on the set risk-reward ratio, offering users valuable insights into the potential profitability of their configurations and trade strategies.
🎲 Exploring the Indicator's Customization Options
This indicator is rich in settings, offering users the capability to tailor criteria and adapt their trading rules. Each setting is accompanied by detailed tooltips, providing insights into their use. Let's examine each category systematically.
🎯 Zigzag Configuration Options
These settings enable users to adjust the scope of their pattern analysis by varying the zigzag's length and depth.
Length Adjustment : Modifying this parameter changes the scale of detected patterns, with higher values spotting larger formations and lower ones focusing on more compact patterns.
Depth Enhancement : This alters the intricacy of the recursive zigzag analysis, potentially unveiling larger patterns across several levels. Caution is advised, as excessive depth may lead to the indicator exceeding its processing capacity.
🎯 Pattern Scanning Settings
This suite of settings fine-tunes the pattern scanning process, generally calibrated for precise geometric alignment of identified patterns. While most settings may remain as default for routine use, users are encouraged to tweak them, especially the "Last Pivot Direction," to explore various theoretical approaches to pattern trading.
🎯 Trade Configuration Settings
Arguably the most crucial for users, these settings offer complete autonomy in defining trading strategies around converging chart patterns. This includes the flexibility to set entry, stop, and target prices, adjust risk-reward ratios, select the historical depth for back testing, and incorporate filters to steer trade direction.
🎯 Pattern Specific Settings
Here, users can personalize settings for individual patterns or groups, enhancing the specificity of their strategy. Apart from enabling/disabling individual patterns and pattern groups, users can also select pattern specific Last Pivot Direction, Trade Direction Filter and external filters for each pattern.
🎯 Fully Customizable Alerts
Implemented through the alert() function, these alerts bypass the standard template in the alert widget. To counteract this, we've introduced placeholders within the settings to craft detailed alert templates.
Available Categories Include
New - Alerts when a new pattern is identified
Entry - Alerts when an entry condition for configured pattern based trade is met.
Stop - Alerts when a trade that has reached entry gets stopped out without reaching target
Target - Alerts when a trade reaches its target
Invalidation - Alerts when a trade reaches invalidation point before reaching the entry.
Each alert types can have its own template. Customizable templates are very important in using alerts for broker or exchange integration.
Here are some of the placeholders that are defined in the indicator.
{type} - Alert type - new/entry/stop/target/invalid
{pid} - Pattern ID of the pattern belonging to trade. Multiple trades can have same pattern id since a pattern can be traded in both long and short directions.
{tid} - Unique Trade ID for the given trade.
{ticker} - Ticker ID on which the indicator is run
{timeframe} - Chart timeframe on which the indicator is run
{basecurrency} - Base currency of the symbol
{quotecurrency} - Quote currency of the symbol
{pivots} - Pivot values of the pattern
{price} - Current price when the alert is triggered.
{pattern} - Name of the pattern on which the alert is triggered.
{direction} - Direction of the trade.
{entrydirection} - Direction of the entry signal. Used for specific bot integration.
{exitdirection} - Direction of the exit signal. Used for specific bot integration.
{entry} - Entry price of the trade
{stop} - Stop price of the trade
{target} - Target price of the trade
{invalidation} - Invalidation price of the trade
🎯 Display and Stats
These settings are used to control the display options on the chart. Closed trade stats is displayed in a table and printed in the bottom left corner of the chart. This can be customized by using display settings.
Ücretli komut dosyası
Flags and Pennants [Trendoscope®]🎲 An extension to Chart Patterns based on Trend Line Pairs - Flags and Pennants
After exploring Algorithmic Identification and Classification of Chart Patterns and developing Auto Chart Patterns Indicator , we now delve into extensions of these patterns, focusing on Flag and Pennant Chart Patterns. These patterns evolve from basic trend line pair-based structures, often influenced by preceding market impulses.
🎲 Identification rules for the Extension Patterns
🎯 Identify the existence of Base Chart Patterns
Before identifying the flag and pennant patterns, we first need to identify the existence of following base trend line pair based converging or parallel patterns.
Ascending Channel
Descending Channel
Rising Wedge (Contracting)
Falling Wedge (Contracting)
Converging Triangle
Descending Triangle (Contracting)
Ascending Triangle (Contracting)
🎯 Identifying Extension Patterns.
The key to pinpointing these patterns lies in spotting a strong impulsive wave – akin to a flagpole – preceding a base pattern. This setup suggests potential for an extension pattern:
A Bullish Flag emerges from a positive impulse followed by a descending channel or a falling wedge
A Bearish Flag appears after a negative impulse leading to an ascending channel or a rising wedge.
A Bullish Pennant is indicated by a positive thrust preceding a converging triangle or ascending triangle.
A Bearish Pennant follows a negative impulse and a converging or descending triangle.
🎲 Pattern Classifications and Characteristics
🎯 Bullish Flag Pattern
Characteristics of Bullish Flag Pattern are as follows
Starts with a positive impulse wave
Immediately followed by either a short descending channel or a falling wedge
Here is an example of Bullish Flag Pattern
🎯 Bearish Flag Pattern
Characteristics of Bearish Flag Pattern are as follows
Starts with a negative impulse wave
Immediately followed by either a short ascending channel or a rising wedge
Here is an example of Bearish Flag Pattern
🎯 Bullish Pennant Pattern
Characteristics of Bullish Pennant Pattern are as follows
Starts with a positive impulse wave
Immediately followed by either a converging triangle or ascending triangle pattern.
Here is an example of Bullish Pennant Pattern
🎯 Bearish Pennant Pattern
Characteristics of Bearish Pennant Pattern are as follows
Starts with a negative impulse wave
Immediately followed by either a converging triangle or a descending converging triangle pattern.
Here is an example of Bearish Pennant Pattern
🎲 Trading Extension Patterns
In a strong market trend, it's common to see temporary periods of consolidation, forming patterns that either converge or range, often counter to the ongoing trend direction. Such pauses may lay the groundwork for the continuation of the trend post-breakout. The assumption that the trend will resume shapes the underlying bias of Flag and Pennant patterns
It's important, however, not to base decisions solely on past trends. Conducting personal back testing is crucial to ascertain the most effective entry and exit strategies for these patterns. Remember, the behavior of these patterns can vary significantly with the volatility of the asset and the specific timeframe being analyzed.
Approach the interpretation of these patterns with prudence, considering that market dynamics are subject to a wide array of influencing factors that might deviate from expected outcomes. For investors and traders, it's essential to engage in thorough back testing, establishing entry points, stop-loss orders, and target goals that align with your individual trading style and risk appetite. This step is key to assessing the viability of these patterns in line with your personal trading strategies and goals.
It's fairly common to witness a breakout followed by a swift price reversal after these patterns have formed. Additionally, there's room for innovation in trading by going against the bias if the breakout occurs in the opposite direction, specially when the trend before the formation of the pattern is in against the pattern bias.
🎲 Cheat Sheet
🎲 Indicator Settings
Custom Source : Enables users to set custom OHLC - this means, the indicator can also be applied on oscillators and other indicators having OHLC values.
Zigzag Settings : Allows users to enable different zigzag base and set length and depth for each zigzag.
Scanning Settings : Pattern scanning settings set some parameters that define the pattern recognition process.
Display Settings : Determine the display of indicators including colors, lines, labels etc.
Backtest Settings : Allows users to set a predetermined back test bars so that the indicator will not time out while trying to run for all available bars.

Auto Chart Patterns [Trendoscope®]🎲 Introducing our most comprehensive automatic chart pattern recognition indicator.
Last week, we published an idea on how to algorithmically identify and classify chart patterns.
This indicator is nothing but the initial implementation of the idea. Whatever we explained in that publication that users can do manually to identify and classify the pattern, this indicator will do it for them.
🎲 Process of identifying the patterns.
The bulk of the logic is implemented as part of the library - chartpatterns . The indicator is a shell that captures the user inputs and makes use of the library to deliver the outcome.
🎯 Here is the list of steps executed to identify the patterns on the chart.
Derive multi level recursive zigzag for multiple base zigzag length and depth combinations.
For each zigzag and level, check the last 5 pivots or 6 pivots (based on the input setting) for possibility of valid trend line pairs.
If there is a valid trend line pair, then there is pattern.
🎯 Rules for identifying the valid trend line pairs
There should be at least two trend lines that does not intersect between the starting and ending pivots.
The upper trend line should touch all the pivot highs of the last 5 or 6 pivots considered for scanning the patterns
The lower trend line should touch all the pivot lows of the last 5 or 6 pivots considered for scanning the patterns.
None of the candles from starting pivot to ending pivot should fall outside the trend lines (above upper trend line and below lower trend line)
The existence of a valid trend line pair signifies the existence of pattern. What type of pattern it is, to identify that we need to go through the classification rules.
🎲 Process of classification of the patterns.
We need to gather the following information before we classify the pattern.
Direction of upper trend line - rising, falling or flat
Direction of lower trend line - rising, falling or flat
Characteristics of trend line pair - converging, expanding, parallel
🎯 Broader Classifications
Broader classification would include the following types.
🚩 Classification Based on Geometrical Shapes
This includes
Wedges - both trend lines are moving in the same direction. But, the trend lines are either converging or diverging and not parallel to each other.
Triangles - trend lines are moving in different directions. Naturally, they are either converging or diverging.
Channels - Both trend lines are moving in the same direction, and they are parallel to each other within the limits of error.
🚩 Classification Based on Pattern Direction
This includes
Ascending/Rising Patterns - No trend line is moving in the downward direction and at least one trend line is moving upwards
Descending/Falling Patterns - No trend line is moving in the upward direction, and at least one trend line is moving downwards.
Flat - Both Trend Lines are Flat
Bi-Directional - Both trend lines are moving in opposite direction and none of them is flat.
🚩 Classification Based on Formation Dynamics
This includes
Converging Patterns - Trend Lines are converging towards each other
Diverging Patterns - Trend Lines are diverging from each other
Parallel Patterns - Trend Lines are parallel to each others
🎯 Individual Pattern Types
Now we have broader classifications. Let's go through in detail to find out fine-grained classification of each individual patterns.
🚩 Ascending/Uptrend Channel
This pattern belongs to the broader classifications - Ascending Patterns, Parallel Patterns and Channels. The rules for the Ascending/Uptrend Channel pattern are as below
Both trend lines are rising
Trend lines are parallel to each other
🚩 Descending/Downtrend Channel
This pattern belongs to the broader classifications - Descending Patterns, Parallel Patterns and Channels. The rules for the Descending/Downtrend Channel pattern are as below
Both trend lines are falling
Trend lines are parallel to each other
🚩 Ranging Channel
This pattern belongs to the broader classifications - Flat Patterns, Parallel Patterns and Channels. The rules for the Ranging Channel pattern are as below
Both trend lines are flat
Trend lines are parallel to each other
🚩 Rising Wedge - Expanding
This pattern belongs to the broader classifications - Rising Patterns, Diverging Patterns and Wedges. The rules for the Expanding Rising Wedge pattern are as below
Both trend lines are rising
Trend Lines are diverging.
🚩 Rising Wedge - Contracting
This pattern belongs to the broader classifications - Rising Patterns, Converging Patterns and Wedges. The rules for the Contracting Rising Wedge pattern are as below
Both trend lines are rising
Trend Lines are converging.
🚩 Falling Wedge - Expanding
This pattern belongs to the broader classifications - Falling Patterns, Diverging Patterns and Wedges. The rules for the Expanding Falling Wedge pattern are as below
Both trend lines are falling
Trend Lines are diverging.
🚩 Falling Wedge - Contracting
This pattern belongs to the broader classifications - Falling Patterns, Converging Patterns and Wedges. The rules for the Converging Falling Wedge are as below
Both trend lines are falling
Trend Lines are converging.
🚩 Rising/Ascending Triangle - Expanding
This pattern belongs to the broader classifications - Rising Patterns, Diverging Patterns and Triangles. The rules for the Expanding Ascending Triangle pattern are as below
The upper trend line is rising
The lower trend line is flat
Naturally, the trend lines are diverging from each other
🚩 Rising/Ascending Triangle - Contracting
This pattern belongs to the broader classifications - Rising Patterns, Converging Patterns and Triangles. The rules for the Contracting Ascending Triangle pattern are as below
The upper trend line is flat
The lower trend line is rising
Naturally, the trend lines are converging.
🚩 Falling/Descending Triangle - Expanding
This pattern belongs to the broader classifications - Falling Patterns, Diverging Patterns and Triangles. The rules for the Expanding Descending Triangle pattern are as below
The upper trend line is flat
The lower trend line is falling
Naturally, the trend lines are diverging from each other
🚩 Falling/Descending Triangle - Contracting
This pattern belongs to the broader classifications - Falling Patterns, Converging Patterns and Triangles. The rules for the Contracting Descending Triangle pattern are as below
The upper trend line is falling
The lower trend line is flat
Naturally, the trend lines are converging.
🚩 Converging Triangle
This pattern belongs to the broader classifications - Bi-Directional Patterns, Converging Patterns and Triangles. The rules for the Converging Triangle pattern are as below
The upper trend line is falling
The lower trend line is rising
Naturally, the trend lines are converging.
🚩 Diverging Triangle
This pattern belongs to the broader classifications - Bi-Directional Patterns, Diverging Patterns and Triangles. The rules for the Diverging Triangle pattern are as below
The upper trend line is rising
The lower trend line is falling
Naturally, the trend lines are diverging from each other.
🎲 Indicator Settings - Auto Chart Patterns
🎯 Zigzag Settings
Zigzag settings allow users to select the number of zigzag combinations to be used for pattern scanning, and also allows users to set zigzag length and depth combinations.
🎯 Scanning Settings
Number of Pivots - This can be either 5 or 6. Represents the number of pivots used for identification of patterns.
Error Threshold - Error threshold used for initial trend line validation.
Flat Threshold - Flat angle threshold is used to identify the slope and direction of trend lines.
Last Pivot Direction - Filters patterns based on the last pivot direction. The values can be up, down, both, or custom. When custom is selected, then the individual pattern specific last pivot direction setting is used instead of the generic one.
Verify Bar Ratio - Provides option to ignore extreme patterns where the ratios of zigzag lines are not proportionate to each other.
Avoid Overlap - When selected, the patterns that overlap with existing patterns will be ignored while scanning. Meaning, if the new pattern starting point falls between the start and end of an existing pattern, it will be ignored.
🎯 Group Classification Filters
Allows users to enable disable patterns based on group classifications.
🚩 Geometric Shapes Based Classifications
Wedges - Rising Wedge Expanding, Falling Wedge Expanding, Rising Wedge Contracting, Falling Wedge Contracting.
Channels - Ascending Channel, Descending Channel, Ranging Channel
Triangles - Converging Triangle, Diverging Triangle, Ascending Triangle Expanding, Descending Triangle Expanding, Ascending Triangle Contrcting and Descending Triangle Contracting
🚩 Direction Based Classifications
Rising - Rising Wedge Contracting, Rising Wedge Expanding, Ascending Triangle Contracting, Ascending Triangle Expanding and Ascending Channel
Falling - Falling Wedge Contracting, Falling Wedge Expanding, Descending Triangle Contracting, Descending Triangle Expanding and Descending Channel
Flat/Bi-directional - Ranging Channel, Converging Triangle, Diverging Triangle
🚩 Formation Dynamics Based Classifications
Expanding - Rising Wedge Expanding, Falling Wedge Expanding, Ascending Triangle Expanding, Descending Triangle Expanding, Diverging Triangle
Contracting - Rising Wedge Contracting, Falling Wedge Contracting, Ascending Triangle Contracting, Descending Triangle Contracting, Converging Triangle
Parallel - Ascending Channel, Descending Channgel and Ranging Channel
🎯 Individual Pattern Filters
These settings allow users to enable/disable individual patterns and also set last pivot direction filter individually for each pattern. Individual Last Pivot direction filters are only considered if the main "Last Pivot Direction" filter is set to "custom"
🎯 Display Settings
These are the settings that determine the indicator display. The details are provided in the tooltips and are self explanatory.
🎯 Alerts
A basic alert message is enabled upon detection of new pattern on the chart.

Multi-Timeframe Recursive Zigzag [Trendoscope®]🎲 Welcome to the Advanced World of Zigzag Analysis
Embark on a journey through the most comprehensive and feature-rich Zigzag implementation you’ll ever encounter. Our Multi-Timeframe Recursive Zigzag Indicator is not just another tool; it's a groundbreaking advancement in technical analysis.
🎯 Key Features
Multi Time-Frame Support - One of the rare open-source Zigzag indicators with robust multi-timeframe capabilities, this feature sets our tool apart, enabling a broader and more dynamic market analysis.
Innovative Recursive Zigzag Algorithm - At its core is our unique Recursive Zigzag Algorithm, a pioneering development that powers multiple Zigzag levels, offering an intricate view of market movements. This proprietary algorithm is the backbone of our advanced pattern recognition indicators.
Sub-Waves and Micro-Waves Analysis - Dive deeper into market trends with our Sub-Waves and Micro-Waves feature. Sub-Waves reveal the interconnectedness of various Zigzag levels, while Micro-Waves offer insight into the fundamental waves at the base level.
Enhanced Indicator Tracking - Integrate and track your custom indicators or oscillators with the zigzag, capturing their values at each Zigzag level, complete with retracement ratios. This offers a comprehensive view of market dynamics.
Curved Zigzag Visualization - Experience a new way of visualizing market movements with our Curved Zigzag Display, employing Pine Script’s polyline feature for a more intuitive and visually appealing representation.
Built-in Customizable Alerts - Stay ahead with built-in alerts that can be customized via user input settings.
🎯 Practical Applications
Our Zigzag Indicator is designed with an understanding of its inherent nature - the last unconfirmed pivot that consistently repaints. This characteristic, while by design, directs its usage more towards pattern recognition rather than direct identification of market tops and bottoms. Here's how you can leverage the Zigzag Indicator:
Harmonic Patterns - Ideal for those familiar with harmonic patterns, this tool simplifies the manual spotting of complex XABCD, ABC, and ABCD patterns on charts.
Chart Patterns - Effortlessly identify patterns like Double/Triple Taps, Head and Shoulders, Inverse Head and Shoulders, and Cup and Handle patterns with enhanced clarity. Navigate through challenging patterns such as Triangles, Wedges, Flags, and Price Channels, where the Zigzag Indicator adds a layer of precision to your breakout strategy.
Elliott Wave Components - The indicator's detailed pivot highlighting aids in identifying key Elliott Wave components, enhancing your wave analysis and decision-making process.
🎲 Deep Dive into Indicator Features
Join us as we explore the intricate features of our indicator in more detail.
🎯 Multi-Timeframe Capability
Our indicator comes equipped with an input option for selecting the desired resolution. This unique feature allows users to view higher timeframe Zigzag patterns directly on their lower timeframe charts.
🎯 Recursive Multi Level Zigzag
Our advanced recursive approach creates multi-level Zigzags from lower-level data. For instance, the level 0 Zigzag forms the base, calculated from specified length and depth parameters, while level 1 Zigzag is derived using level 0 as its foundation, and so forth.
The indicator not only displays multiple Zigzag levels but also offers settings to emphasize specific levels for more detailed analysis.
🎯 Sub-Components and Micro-Components of Zigzag Wave
Sub-components within a Zigzag wave consist of the previous level's Zigzag pivots. Meanwhile, the micro-components are composed of the base level (Level 0) Zigzag pivots encapsulated within the wave.
🎯 Curved Zigzag
Experience a new perspective with our curved Zigzag display. This innovative feature utilizes the polyline curved option to automatically generate sinusoidal waves based on multiple points.
🎯 Indicator Tracking
Default indicators such as RSI, MFI, and OBV are included, alongside the ability to track one external indicator at each Zigzag pivot.
🎯 Customizable Alerts
Our indicator employs the `alert()` function for alert creation. While this means the absence of a customization text box in the alert settings, we've included a custom text area for users to create their own alert templates.
Template placeholders include:
{alertType} - type of alert. Either Confirmed Pivot Update or Last Pivot Update. Depends on the alert type selected in the inputs.
When Last Pivot Update type is selected, the alerts are triggered whenever there is a new Zigzag Pivot. This may also be a repaint of last unconfirmed pivot.
When Confirmed Pivot Update type is selected, the alerts are triggered only when a pivot becomes a confirmed pivot.
{level} - Zigzag level on which the alert is triggered.
{pivot} - Details of the last pivot or confirmed pivot including price, ratio, indicator values and ratios, subcomponent and micro-component pivots.
🎲 User Settings Overview
🎯 Zigzag and Generic Settings
This involves some generic zigzag calculation settings such as length, depth, and timeframe. And few display options such as theme, Highlight Level and Curved Zigzag. By default, zigzag calculation is done based on the latest real time bar. An option is provided to disable this and use only confirmed bars for the calculation.
Indicator Settings
Allows users to track one or more oscillators or volume indicators. Option to add any indicator via external input is provided.
🎯 Alert Settings
Has input fields required to select and customize alerts.

Divergence Indicator [Trendoscope®]🎲 New Divergence Indicator by Trendoscope
Our latest Divergence Indicator revolutionizes the way traders identify market trends and potential reversals. Built upon the robust foundation of the Zigzag Trend Divergence Detector and inline with our recent implementation of the Divergence Goggles indicator, this tool is designed to be intuitive yet powerful, making it an essential addition to any trader's toolkit.
We received several queries on extending the Divergence Goggles to last N bars instead of using an interactive widget. Though it is possible, we thought the better approach is to enable the indicator to use any oscillator and trend indicator in order to define the divergence.
🎯 Key Features
Flexible Oscillator Integration : Choose from a wide range of built-in oscillators or import your own, including options like the innovative Multiband Oscillator. This versatility extends to using volume indicators like OBV for divergence calculations, broadening the scope of analysis.
Trend Identification Versatility : Utilize built-in methods like Zigzag and MA Difference, or integrate external trend indicators. Our system adapts to various methods, ensuring you have the right tools for precise trend identification.
Customizable Zigzag Sensitivity : Adjust the Zigzag based on your chosen oscillator's sensitivity to ensure divergence lines are accurate and visually coherent.
Repainting vs. Delayed Signals : Tailor the indicator to your strategy by choosing between immediate repainting signals and slightly delayed but more stable signals.
🎯 Understanding Divergence: Key Rules
Bullish Divergence
Happens only in downtrend
Observed on Pivot Lows
Price makes lower low whereas oscillator makes higher low, indicating weakness and possible reversal
Bearish Divergence
Happens only in uptrend
Observed on Pivot Highs
Price makes higher high whereas oscillator makes lower high, indicating weakness and possible reversal
Bullish Hidden Divergence
Happens only in uptrend
Observed on Pivot Lows
Price makes higher low, whereas indicator makes lower low due to price consolidation. In bullish trend, this is considered as bullish as the price gets a breather and get ready to surge further.
Bearish Hidden Divergence
Happens only in downtrend
Observed on Pivot Highs
Price makes lower high whereas oscillator makes higher high due to price consolidation. In bearish trend, this is considered as bearish as the price gets a breather and get ready to fall further.
🎯 Visual Insights: Divergence and Hidden Divergence
For a clearer understanding, refer to our visual guides:
🎲 Using the Divergence Indicator: A Step-by-Step Guide
🎯 Step 1 - Selecting the Oscillator
Customize your analysis by choosing from a variety of oscillators or importing your preferred one. Options are available to select a range of built-in oscillators and the loopback length. However, if the oscillator that user want to use is not in the list, they can simply load the oscillator from the indicator library and use it as an external signal.
In our current example, we are using a custom oscillator called - Multiband Oscillator
This also means, the indicator option is not limited to oscillators. Users can even make use of volume indicators such as OBV for the calculation of divergence.
🎯 Step 2 - Choosing the Trend Identification Method
Select from our built-in methods or integrate an external indicator to accurately identify market trends. Trend is one of the key parameters of divergence type identification. Trend can be identified mathematically by various methods. Some of them are as simple as above or below 200 moving average and some can follow trend based indicators such as supertrend and others can be very complex.
To cater for a wider audience, here too we have provided the option to use an external trend indicator. The simple condition for the external trend indicator is that it should return positive value for uptrend and negative value for downtrend.
Other than that, we also have 2 built in trend identification methods.
Zigzag - The trend is defined by the starting pivot of divergence line. If the starting pivot is Higher High or Higher Low, then it is considered uptrend. And if the starting pivot is either Lower Low or Lower High, then we consider it as downtrend.
MA Difference - In this case, the difference between the moving average of pivots joining the divergence line will determine the trend. It is considered uptrend if the moving average increased from starting pivot to ending pivot of the divergence line, and it is considered downtrend if the moving average decreased from starting pivot to the ending pivot of the divergence line.
🎯 Step 3 - Adjusting Zigzag Sensitivity
Fine-tune the Zigzag to match the oscillator's sensitivity, ensuring divergence lines are accurate and visually coherent.
🎯 Step 4 - Managing Repainting
Understand the implications of repainting in the last pivot of the Zigzag and choose between immediate or delayed signals based on your trading strategy. The last pivot of the zigzag repaint by design. This is not necessarily a bad thing. Users can just choose not to use the last pivot, but instead use the last but one for all the calculations. But, this also means, the signals will be delayed.
Indicator provides option to use repainting signal vs delayed signal. If you select the repaint option, the signals are shown immediately as and when they occur. But, there is a possibility that these signals change when the new price candles change zigzag pivot.
If you chose not to select the repaint option, then the divergence signals may lag by a few bars.
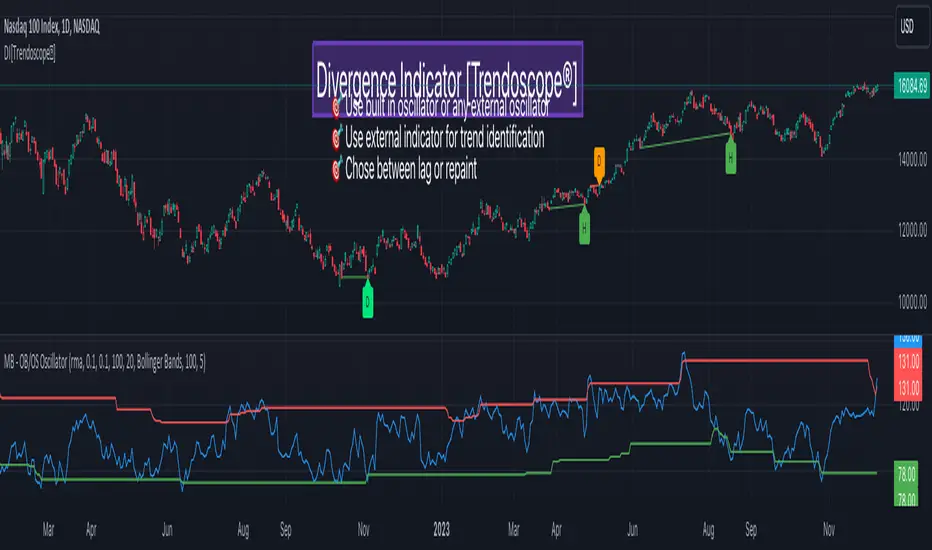
Smart Bullish Pennant PatternDescription:
This script is designed to identify and visualize the Bullish Pennant pattern, a popular continuation pattern used by traders. The script follows a structured approach to identify the underlying bullish trend, the consolidation phase, and finally, the breakout from the pennant, which could signify a potential continuation of the bullish trend.
Here's how the script operates:
Bullish Trend Identification:
The script first identifies a bullish trend based on a user-defined length and a specified Exponential Moving Average (EMA).
A bullish trend is considered to be in place if the closing price is above the trend EMA, and the EMA is rising over the specified length of bars.
Consolidation Phase Detection:
During the bullish trend, the script looks for a consolidation phase, which is identified by comparing the range of the recent bars against the range of the bullish trend.
The consolidation phase is characterized by a narrowing price range, forming the pennant.
Breakout Confirmation:
A breakout from the consolidation is considered confirmed if the closing price breaks above the consolidation high, accompanied by an increase in volume.
The script allows for a one-bar delay in confirmation to avoid false breakout signals.
Price Target Calculation:
Upon a confirmed breakout, the script calculates the price target based on the height of the preceding bullish trend, added to the breakout point.
Visual Aids:
The script plots the consolidation range during the consolidation phase.
A breakout is visually indicated with a triangle above the breakout bar.
The price target is displayed on the chart with a step line.
Alerts:
An alert is triggered upon a confirmed breakout, notifying the trader of the potential bullish continuation.
Labels:
Labels are plotted to indicate the start of the bullish trend and the breakout point.
By employing this script, traders can automate the process of identifying the Bullish Pennant pattern, aiding in timely decision making for potential trade entries and exits.
This script is protected, ensuring its proprietary nature while sharing its utility with the TradingView community.
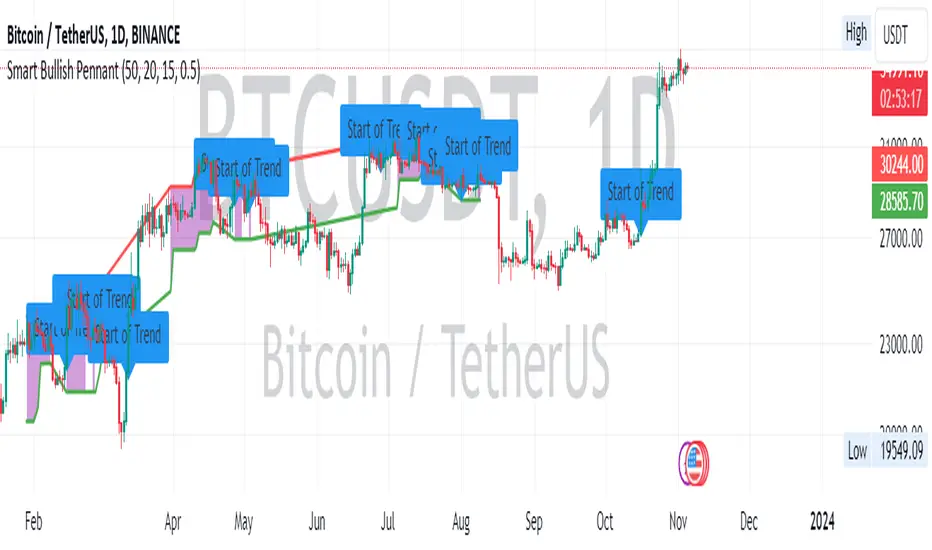
Harmonic PatternsHarmonic Patterns
Harmonic Pattern utilizes the recognition of specific structures that possess distinct and consecutive Fibonacci ratio alignments that quantify and validate harmonic patterns. These patterns calculate the Fibonacci aspects of these price structures to identify highly probable reversal points in the financial markets. This methodology assumes that harmonic patterns, like many patterns and cycles in life, continually repeat.
Input Parameters:
Zigzag Setup:
These group of parameters are used to identify the swing points. The script also draws the Zigzag line and swing labels based on these parameters.
Harmonic Pattern Setup:
Ignore XD leg calculations – Optionally one can choose to ignore the XD leg calculation.
Fixed value leg offset % - Fixed value leg parameters are such parameters where single value Fibonacci value is used. This makes pattern identification very rare. To overcome this one can input % value which would be used to derive the range of Fibonacci numbers for pattern identification. E.g. XD leg in Bat pattern has fixed leg of 88.6%, If we input 5% as fixed value leg offset % then instead of fixed value of 88.6%, script calculates range as 88.6% + 5% (Value 1) and 88.6% - 5% (Value 2) and uses the same for pattern identification.
The script plots a diamond shape label on the last candle of the chart. The label has been enabled with a tooltip which shows number of patterns of each type along with the time where latest pattern is located.
This script covers harmonic patterns listed in the table below. Each harmonic pattern has bullish and bearish variants. All these patterns have 4 legs known as XABCD.
The Patterns have been configured as specified in the table below. Refer to Figure 1 and Figure 2 to understand how to read and interpret the table.
Figure 1
Figure 2

Harmonic Pattern Table Inputs█ OVERVIEW
This indicator was intended as educational purpose only based on Harmonic Pattern Table (Source Code) .
Some user have different ratios in mind, thus I add input to allow user to change those ratios.
█ CREDITS
Scott M Carney, Trading Volume 3: Reaction vs. Reversal
█ CREDITS
1. List Harmonic Patterns.
2. Font size small for mobile app and font size normal for desktop.
3. Font color does automatically change follow dark / light chart theme.
4. Inputs to change ratio values.
█ USAGE / EXAMPLES
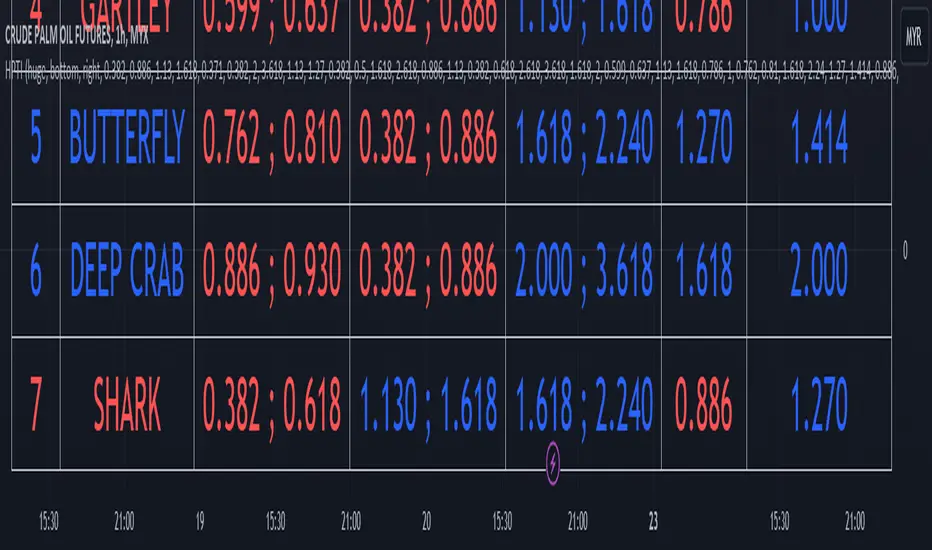
Dynamic Sine Wave The Dynamic Sine Wave is designed to calculate a sine wave that reflects the oscillations between the highest high and lowest low points over a specified period, providing traders with a unique perspective on market trends.
Why a Sine Wave is Relevant:
A sine wave is relevant in this context because it is a mathematical function that represents periodic oscillations, making it suitable for capturing the cyclic nature of price movements in financial markets.
By using a sine wave, this indicator highlights the repetitive patterns of price highs and lows over a specified period, which can assist traders in identifying potential trend reversals or continuations.
The sine wave's amplitude and frequency are adjusted based on the highest high and lowest low points, ensuring that it adapts to market volatility and provides a dynamic representation of price action.
Overall, the "Dynamic Sine Wave" indicator offers a unique perspective on market dynamics, helping traders make informed decisions by visualizing the ebb and flow of prices.

@tk · spectral█ OVERVIEW
This script is an indicator that helps traders to identify the price difference between spot and futures of the current crypto plotted into the chart. It works in both types of markets, when the chart is plotting the crypto in spot market, it will compare with its respective futures ticker and vice-versa. If the current asset isn't a crypt ticker, the indicator will not be plotted into the chart.
█ MOTIVATION
Since crypto's derivative market is based on spot market asset's price, to calculate the arbitrage mechanisms that attempts to balance the asset price, this indicator can help traders to identify some spot and futures price divergence that can create an anomaly of funding rate and can push it to an extreme negative — or positive — rate. So, easing to track the price difference between both markets will bring more evidences to identify an artificial price move, specially in crypto assets with low market cap.
█ CONCEPT
The trading concept to use this indicator is the concept of the arbitrage machamism created by exchanges that calculates the funding rate based on spot and futures price difference that will vary from exchange to exchange. This strategy don't works alone. It needs to be aligned together with others indicators like Exponential Moving Averages, Chart Patterns, Support and Resistance, and so on... Even more confluences that you have, bigger are your chances to increase the probability for a successful trade. So, don't use this indicator alone. Compose a trading strategy and use it to improve your analysis.
█ CUSTOMIZATION
This indicator allows the trader to customize the following settings:
GENERAL
Text size
Changes the font size of price difference table to improve accessibility.
Type: string
Options: `tiny`, `small`, `normal`, `large`.
Default: `small`
Position
Changes the position of price difference table.
Type: string
Options: `top_left`, `top_center`, `top_right`, `middle_left`, `middle_center`, `middle_right`, `bottom_left`, `bottom_center`, `bottom_right`.
Default: `bottom_right`
Pair Quote
The ticker quote symbol that will be used to base the ticker comparison from spot to futures (e.g. BTCUSDT which `USDT` is the quote. ETHBTC which `BTC` is the quote).
Type: string
Default: USDT
Spectrum Color
The color of the spectrum candles. Spectrum candles are the candles of the opposite market. If the current ticker is in the spot market, the spectrum candles will be the price of the futures market.
Type: color
Default: #434651
█ FUNCTIONS
The indicator contains the following functions:
stripStarts(src, str)
Strips a defined pattern from a string.
Parameters:
src: (string) Source string
str: (string) String pattern to be stripped from start of source string.
Returns: (string) Stripped string with matched regex pattern.

ZigZag++ FibonacciAuto Fibonacci tools are powerful ways designed to simplify your technical analysis by automatically drawing Fibonacci retracement and extension levels on your chart. This indicator is built to enhance your trading experience with clearer market moves and informative insights.
You can easily spot your waves and patterns when the percentages are moving with you.
Key Features:
Automated Fibonacci Levels: Plots Fibonacci retracement and extension levels based on recent price movements.
Multi-Timeframe Support: This indicator is your versatile companion, offering multi-timeframe functionality. You can seamlessly track Fibonacci levels across different resolutions, providing a comprehensive view of the market.
Two Types of Fibs: Retracement and Timeframe extension Fibonacci levels. Use retracements to identify potential reversal points and extensions to anticipate price targets, giving you a well-rounded perspective on market movements.
Benefits:
Save Time: No more manual Fibonacci drawing; It does this for you in real-time.
Enhanced Analysis: Gain a deeper understanding of potential support, resistance, and price targets.
User-Friendly: Suitable for traders of all levels, this indicator simplifies complex technical analysis.
For the math lovers
I started creating the ZigZag++ based on the MT4 calculation as I found it better performing than the tradingview inbuilt one. I have revised the calculation couple of times and now the final calculation is simple yet more accurate for my analysis.
First, I observe the market direction for the last Depth setting by comparing the rate at which high values reduce and low values increase. When the number of ticks set by Deviation is crossed and the last cross is more than the Backstep candles, then we have our ZigZag points.
These are the points we use in our Fibonacci calculation.
Checkout ZigLib below to use the same logic in your scripts.
Sample usage
This is a 4 Hour configuration with the default settings.
When the trend reversed, some key points I watch are 0.618 and 0.5. The market retraced back and formed the new point for the next ZigZag line on that level. This market behaviour happens quite often on these Fibonacci points. I would be looking for reversal or a break in this zone to know the next step.
Resources
ZigZag++ Lib by me; for retrieving the line points.
Fibonacci Toolkit by Lux Algo; For drawing the Timeframe Fibs. Very Amazing script.
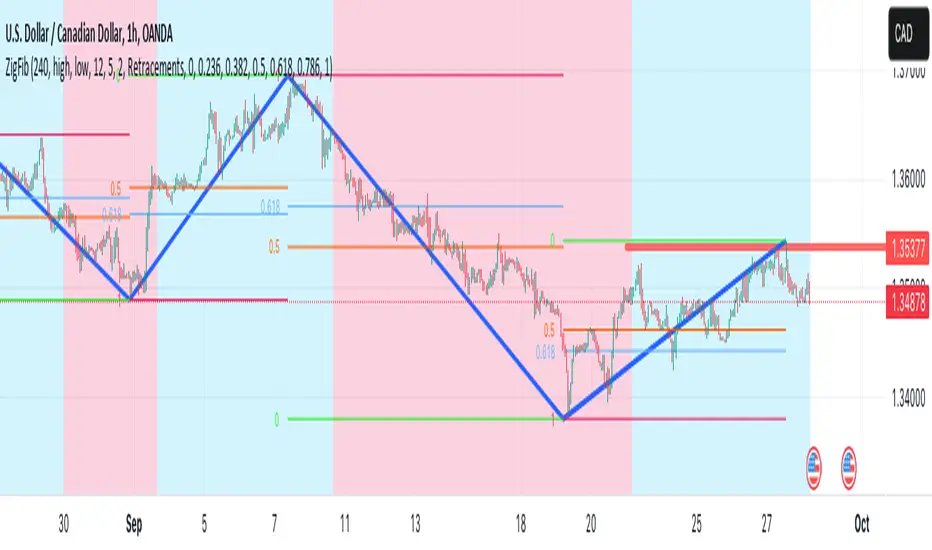
Smart Money Breakouts [ChartPrime]The " Smart Money Breakouts " indicator is designed to identify breakouts based on changes in character (CHOCH) or breaks of structure (BOS) patterns, facilitating automated trading with user-defined Take Profit (TP) level.
the indicator incorporates essential elements such as volume analysis and a data table to assist traders in optimizing their strategies.
🔸 Breakout Detection:
The indicator scans price movements for "Change in Character" (CHOCH) and "Break of Structure" (BOS) patterns, signaling potential breakout opportunities in the market.
🔸User-Defined TP :
Traders can customize the Take Profit (TP) through the indicator settings, with these levels dynamically calculated based on the Average True Range (ATR). This allows for precise risk management and profit targets that adapt to market volatility.
🔸 Volume Analysis and Trade Direction Specific Analysis:
The indicator includes a volume checker that provides valuable insights into the strength of the breakout, taking into account trade direction.
🔸If the volume label is red and the trade is long, it suggests a higher likelihood of hitting the Stop Loss (SL).
🔸If the volume label is green and the trade is long, it indicates a higher probability of hitting the Take Profit (TP).
🔸For short trades, a red volume label suggests a higher likelihood of hitting TP, while a green label suggests a higher likelihood of hitting SL.
🔸A yellow volume label suggests that the volume is inconclusive, neither favoring bullish nor bearish movements.
🔸Data Table:
The indicator features a data table that keeps track of the number of winning and losing trades for specific timeframes or configurations.
This table serves as a valuable tool for traders to analyze performance and discover optimal settings and timeframes.
The "Smart Money Breakouts" indicator provides traders with a comprehensive solution for breakout trading, combining technical analysis of changes in character and breaks of structure, volume insights, and performance tracking while dynamically adjusting TP and SL levels based on market volatility through the ATR.

Trendline Breakouts With Targets [ChartPrime]The Trendline Breakouts With Targets indicator is meticulously crafted to improve trading decision-making by pinpointing trendline breakouts and breakdowns through pivot point analysis.
Here's a comprehensive look at its primary functionalities:
Upon the occurrence of a breakout or breakdown, a signal is meticulously assessed against a false signal condition/filter, after which the indicator promptly generates a trading signal. Additionally, it conducts precise calculations to determine potential target levels and then exhibits them graphically on the price chart.
🔷 Key Features:
🔸 Trendline Drawing: The indicator automatically plots trendlines based on significant pivot points and wick data, visually representing the prevailing trend.
🔸 Breakout and Breakdown Signals : It triggers trading signals when a breakout (price moves above the trendline) or a breakdown (price moves below the trendline) is detected, helping traders identify potential entry points.
🔸 False Breakout/ Breakdown Filter ✔️: To enhance accuracy, the indicator incorporates a filter to reduce false breakout and breakdown signals, helping traders avoid premature entries.
🔸 Target Calculation: The indicator performs target-level calculations, a critical aspect of trade management.
These calculated target levels are visually displayed on the price chart, helping traders set precise profit targets and make well-informed trading decisions.
🔸 Color-Change Labels: The indicator features label color changes to provide quick visual cues. Labels are initially displayed in orange. When a take profit (TP) level is reached, the label changes to green, indicating a successful trade. Conversely, if a stop-loss (SL) level is hit, the label turns red, signaling a losing trade.
🔸 Settings :
This indicator combines technical analysis, trendline identification, breakout/breakdown signals, and risk management tools to assist traders in making more informed and efficient trading decisions. It can be a valuable addition to any trader's toolkit, helping them identify potential trade opportunities and manage risk effectively.
