Golden Zone Structure [Kodexius]Golden Zone Structure is a ZigZag based market structure and Fibonacci tool designed to make swing context easier to read directly on the price chart. It detects meaningful pivot highs and lows, labels the evolving structure (HH, HL, LH, LL, including equal highs and lows), and automatically projects a Fibonacci map across the most recent completed swing.
Instead of forcing you to manually anchor Fib tools after every new leg, the script rebuilds levels each time a fresh pivot is confirmed. This makes it well suited for traders who focus on swing continuation, pullback depth, and reaction zones where liquidity and orderflow often concentrate.
A key emphasis is the Golden Zone highlight. The indicator shades the zone that is most relevant to the current swing context so you can quickly spot where a retracement is approaching a higher probability reaction area, without cluttering the chart with too many permanent objects.
The tool is intentionally visual and configurable. You can choose pivot source (High/Low or Close), adjust swing sensitivity via ZigZag period, switch color themes, and decide how much detail you want on screen (levels, zigzag lines, labels).
Optional trading markers can be enabled for users who want a lightweight “zone interaction” prompt. These markers are not intended as a standalone trading system. They are meant to complement your own confirmation rules (structure alignment, volume, higher timeframe bias, or price action triggers).
🔹Features
🔸 ZigZag Swing Engine
- Uses a configurable ZigZag period to filter noise and confirm swing points only when the lookback logic validates the move.
Supports different pivot sources (High/Low or Close) so you can choose between cleaner structure or more reactive behavior depending on the instrument.
Optional ZigZag leg drawing to visualize swing flow without clutter.
🔸 Market Structure Labels (HH, HL, LH, LL + Equals)
- Automatically labels each confirmed pivot based on how it compares to the prior pivot of the same type.
High side classification: H, HH, LH, EH.
Low side classification: L, HL, LL, EL.
Equal highs and lows help reveal potential liquidity pools and “magnet” areas where price often reacts or breaks with intent.
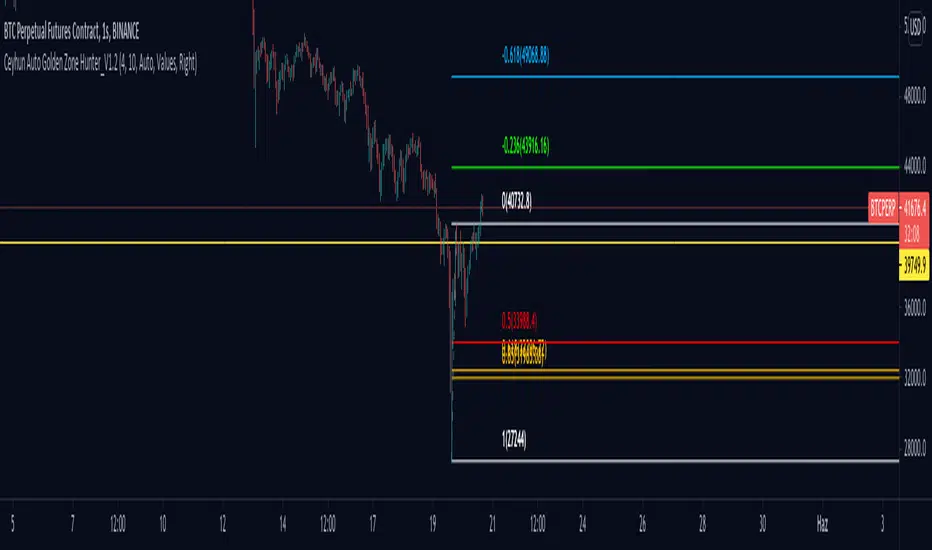
🔸 Auto Fibonacci Map on the Active Swing
- Rebuilds Fibonacci levels every time a new pivot is confirmed, keeping the projection aligned with the most recent completed leg.
Core retracement levels: 0.236, 0.382, 0.500, 0.618, 0.786.
Extension levels: 1.272 and 1.618 for expansion targeting and continuation mapping.
Optional price labels on each level, formatted to tick size so levels remain readable across markets.
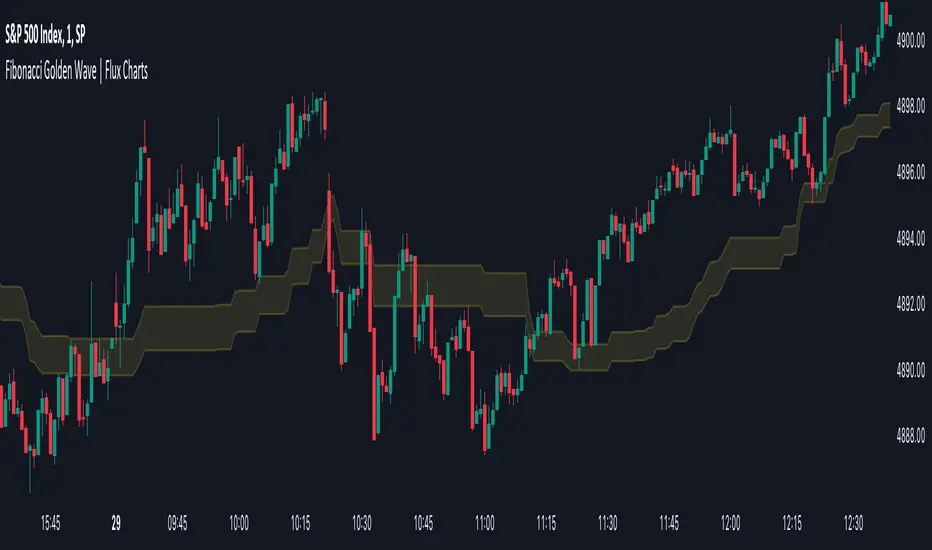
🔸 Golden Zone Highlighting (Context Aware)
- Highlights the most relevant retracement band with a soft fill so you can spot “zone approach” moments at a glance.
The zone selection adapts to swing context, focusing on a different retracement region depending on whether the last confirmed pivot is a peak or a trough.
Adjustable transparency keeps the chart clean while preserving the key reaction area.
🔸 Visual Customization + Themes
- Multiple color themes (Neon, Ocean, Sunset, Monochrome) so the tool fits different chart styles and backgrounds.
Independent toggles for Fib levels, Golden Zone shading, ZigZag lines, and price labels.
Line width controls for better scaling across timeframes.
🔸 Optional Trading Markers + Alerts
- Optional BUY and SELL labels based on zone interaction logic with candle confirmation filters.
ATR based placement offset scaled by sensitivity so labels stay visually separated during volatility.
Built in alert conditions for new pivot highs and new pivot lows so you can monitor structure changes without watching every bar.
▶ Practical Usage Tip
• Use structure labels to define bias (HH + HL for bullish structure, LH + LL for bearish structure).
• Use the Golden Zone as a location filter, then wait for your own trigger (break of minor structure, rejection candle, volume shift, etc.).
• Treat extensions as “map points” not guaranteed targets. They work best when structure supports continuation.
Goldenzone
Macias Golden ZoneThe Macias Golden Zone indicator automatically detects the most recent pivot leg and draws the key Fibonacci retracement band between 0.618 – 0.790, with the 0.706 midline highlighted.
🔑 Features:
• Auto-detects swing legs from pivot highs/lows
• Shaded Golden Zone for easy visualization of prime reaction areas
• Optional 0.706 midline for sniper entries
• Optional 0.079 retrace line for deeper confluence
• Works with wicks (High/Low) or closes
📈 Use it to identify high-probability pullback zones where price often reacts during trending moves.
⚠️ This tool is for educational purposes only. Not financial advice. Always manage risk.
From Christopher Macias and the Golden zone family
Fibonacci Optimal Entry Zone [OTE] (Zeiierman)█ Overview
Fibonacci Optimal Entry Zone (Zeiierman) is a high-precision market structure tool designed to help traders identify ideal entry zones during trending markets. Built on the principles of Smart Money Concepts (SMC) and Fibonacci retracements, this indicator highlights key areas where price is most likely to react — specifically within the "Golden Zone" (between the 50% and 61.8% retracement).
It tracks structural pivot shifts (CHoCH) and dynamically adjusts Fibonacci levels based on real-time swing tracking. Whether you're trading breakouts, pullbacks, or optimal entries, this tool brings unparalleled clarity to structure-based strategies.
Ideal for traders who rely on confluence, this indicator visually synchronizes swing highs/lows, market structure shifts, Fibonacci retracement levels, and trend alignment — all without clutter or lag.
⚪ The Structural Assumption
Price moves in waves, but key retracements often lead to continuation or reversal — especially when aligned with structure breaks and trend shifts.
The Optimal Entry Zone captures this behavior by anchoring Fibonacci levels between recent swing extremes. The most powerful area — the Golden Zone — marks where institutional re-entry is likely, providing traders with a sniper-like roadmap to structure-based entries.
█ How It Works
⚪ Structure Tracking Engine
At its core, the indicator detects pivots and classifies trend direction:
Structure Period – Determines the depth of pivots used to detect swing highs/lows.
CHoCH – Break of structure logic identifies where the trend shifts or continues, marked visually on the chart.
Bullish & Bearish Modes – Independently toggle uptrend and downtrend detection and styling.
⚪ Fibonacci Engine
Upon each confirmed structural shift, Fibonacci retracement levels are projected between swing extremes:
Custom Levels – Choose which retracements (0.50, 0.618, etc.) are shown.
Real-Time Adjustments – When "Swing Tracker" is enabled, levels and labels update dynamically as price forms new swings.
Example:
If you disable the Swing Tracker, the Golden Level is calculated using the most recent confirmed swing high and low.
If you enable the Swing Tracker, the Golden Level is calculated from the latest swing high or low, making it more adaptive as the trend evolves in real time.
█ How to Use
⚪ Structure-Based Entry
Wait for CHoCH events and use the resulting Fibonacci projection to identify entry points. Enter trades as price taps into the Golden Zone, especially when confluence forms with swing structure or order blocks.
⚪ Real-Time Reaction Tracking
Enable Swing Tracker to keep the tool live — constantly updating zones as price shifts. This is especially useful for scalpers or intraday traders who rely on fresh swing zones.
█ Settings
Structure Period – Number of bars used to define swing pivots. Larger values = stronger structure.
Swing Tracker – Auto-updates fib levels as new highs/lows form.
Show Previous Levels – Keep older fib zones on chart or reset with each structure shift.
-----------------
Disclaimer
The content provided in my scripts, indicators, ideas, algorithms, and systems is for educational and informational purposes only. It does not constitute financial advice, investment recommendations, or a solicitation to buy or sell any financial instruments. I will not accept liability for any loss or damage, including without limitation any loss of profit, which may arise directly or indirectly from the use of or reliance on such information.
All investments involve risk, and the past performance of a security, industry, sector, market, financial product, trading strategy, backtest, or individual's trading does not guarantee future results or returns. Investors are fully responsible for any investment decisions they make. Such decisions should be based solely on an evaluation of their financial circumstances, investment objectives, risk tolerance, and liquidity needs.
Fibonacci Golden Wave | Flux Charts💎 GENERAL OVERVIEW
Introducing the new Fibonacci Golden Wave indicator! This indicator plots the Fibonacci golden zone from the last highs / lows instead of the pivots so that the resulting zone is shaped like a "wave". We believe this will help you to see the latest trend of the Fibonacci retracement levels easier. For more information of the working progress of the indicator, check the "How Does It Work" section of the description.
Features of the new Fibonacci Golden Wave Indicator :
Plots Fibonacci Golden Zone Based On Highs / Lows
A Different Approach To Fibonacci Retracement Levels
Customizable Swing Range & Retracement Levels
Customizable Visuals
🚩UNIQUENESS
The Fibonacci Golden Zone is a widely used concept in trading. To achieve the golden zone, the Fibonacci retracement levels are generally placed between pivot high / lows, resulting in a rectangular zone. However, this indicator will place the Fibonacci retracement levels between the last highest / lowest points going back from the current bar, resulting in a "wave" shape. This will help traders understand the latest trend of the Fibonacci golden zone. The ability to change the Fibonacci retracement levels to your liking in the settings is another unique function of this indicator.
📌 HOW DOES IT WORK ?
To calculate the Fibonacci wave, first of all we need to place a line at the lowest low and the highest high of the last 20 bars (can be changed from the settings)
Then, Fibonacci retracement levels are placed between those lines.
For the next step, put two points in the (1.0 - 0.618) = 0.382 and (1.0 - 0.5) = 0.5 (can be changed from the settings) levels of the Fibonacci retracement.
Repeat this step for each bar in the chart, then connect all the points.
Instead of a pivot approach to the Fibonacci retracement levels, this approach will not need a new pivot point to form before calculating the new Fibonacci golden zone, thus indicating the latest trend of the current golden zone.
🚨HOW YOU CAN USE THIS INDICATOR
Fibonacci retracement tool is typically used to find entries after a pullback in an uptrend or downtrend. The Fibonacci Golden Wave can be used in the same way. It can be used to find entries after markets retrace. In this example, the Fibonacci Golden Wave is able to catch 2 pullback opportunities to enter long in the market with the trend.
⚙️SETTINGS
1. General Configuration
Swing Range -> This setting determines how the highest high / lowest low levels are calculated. This essentially means that the script will look back X bars before the current bar in calculation to find the highest / lowest wick points.
2. Golden Zone
Here you can select which range of the Fibonacci retracement levels should be considered as the golden zone. The default value is 0.5 - 0.618.
Golden ZoneIntroducing the "Golden Zone" indicator, a powerful tool that simplifies the Fibonacci indicator by creating a clear Golden Zone to identify potential future price movements. The Golden Zone is a supply or demand zone that corresponds to the 61.8% and 50% Fibonacci retracement levels. These levels are important because they often mark zones where the price reacts, making it an essential area for traders to watch.
The script plots the Fibonacci levels in the background, enabling traders to identify potential support and resistance levels quickly. The Golden Zone is highlighted with a yellow filled area, making it easy to spot on the chart. Traders use this zone to identify areas where the stock price may react, either bouncing off the support level or encountering resistance at the resistance level.
For example, if a stock price is moving up and reaches the Golden Zone, a trader may look for signs of resistance and consider selling the stock if the price begins to move back down. Conversely, if a stock price is moving down and reaches the Golden Zone, a trader may look for signs of support and consider buying the stock if the price begins to move back up.
The "Golden Zone" indicator is highly versatile and can be used in all markets, whether you are a swing trader or a day trader. It can be combined with other strategies, such as an EMA crossover strategy or price action, or as an area of confluence.
In summary, the "Golden Zone" indicator is a must-have tool for traders looking to identify potential price movements and locate key support and resistance levels. Its user-friendly inputs and clear display make it a valuable addition to any trading arsenal.
So, the "Golden Zone" indicator is like a magic tool that helps people who trade in the stock market find valuable things to buy or sell. And with its ability to identify key support and resistance levels, it can help traders make better-informed decisions when buying or selling stocks.
I hope you like it!
Ceyhun Auto Golden Zone Hunter_V1.2Ceyhun Auto Golden Zone Hunter_V1.2 indikatörünü içermektedir güncellemeler için takipte kalın..


