OPEN-SOURCE SCRIPT
Golden Zone
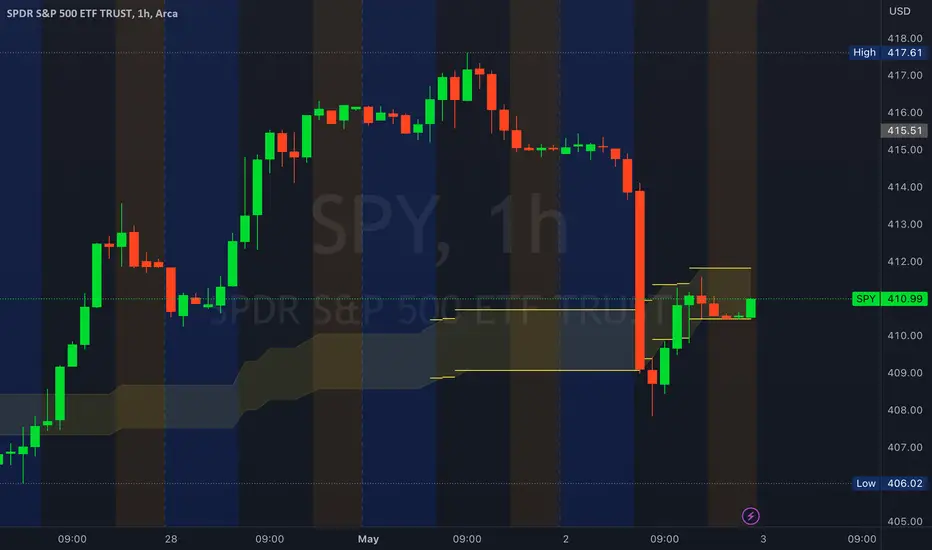
Introducing the "Golden Zone" indicator, a powerful tool that simplifies the Fibonacci indicator by creating a clear Golden Zone to identify potential future price movements. The Golden Zone is a supply or demand zone that corresponds to the 61.8% and 50% Fibonacci retracement levels. These levels are important because they often mark zones where the price reacts, making it an essential area for traders to watch.
The script plots the Fibonacci levels in the background, enabling traders to identify potential support and resistance levels quickly. The Golden Zone is highlighted with a yellow filled area, making it easy to spot on the chart. Traders use this zone to identify areas where the stock price may react, either bouncing off the support level or encountering resistance at the resistance level.
For example, if a stock price is moving up and reaches the Golden Zone, a trader may look for signs of resistance and consider selling the stock if the price begins to move back down. Conversely, if a stock price is moving down and reaches the Golden Zone, a trader may look for signs of support and consider buying the stock if the price begins to move back up.
The "Golden Zone" indicator is highly versatile and can be used in all markets, whether you are a swing trader or a day trader. It can be combined with other strategies, such as an EMA crossover strategy or price action, or as an area of confluence.
In summary, the "Golden Zone" indicator is a must-have tool for traders looking to identify potential price movements and locate key support and resistance levels. Its user-friendly inputs and clear display make it a valuable addition to any trading arsenal.
So, the "Golden Zone" indicator is like a magic tool that helps people who trade in the stock market find valuable things to buy or sell. And with its ability to identify key support and resistance levels, it can help traders make better-informed decisions when buying or selling stocks.
I hope you like it!
Açık kaynak kodlu komut dosyası
Gerçek TradingView ruhuna uygun olarak, bu komut dosyasının oluşturucusu bunu açık kaynaklı hale getirmiştir, böylece yatırımcılar betiğin işlevselliğini inceleyip doğrulayabilir. Yazara saygı! Ücretsiz olarak kullanabilirsiniz, ancak kodu yeniden yayınlamanın Site Kurallarımıza tabi olduğunu unutmayın.
Feragatname
Bilgiler ve yayınlar, TradingView tarafından sağlanan veya onaylanan finansal, yatırım, işlem veya diğer türden tavsiye veya tavsiyeler anlamına gelmez ve teşkil etmez. Kullanım Şartları'nda daha fazlasını okuyun.