GAP Finder with Dollar Difference by RadionovCrypto**GAP UP Detection:**
- The current candle’s low must be higher than the previous candle’s high (high ).
**GAP DOWN Detection:**
- The current candle’s high must be lower than the previous candle’s low (low ).
**Visualization:**
- If a GAP UP is detected, a symbol appears below the candle with the text "GAP UP," and a label displays the dollar difference between the candles.
- If a GAP DOWN is detected, a symbol appears above the candle with the text "GAP DOWN," and a label displays the dollar difference between the candles.
**Explanation:**
- GAP UP is identified when the entire candle (body and wicks) is above the previous candle’s high.
- GAP DOWN is identified when the entire candle (body and wicks) is below the previous candle’s low.
This ensures that only situations where the new candle is completely outside the previous candle are considered as a GAP.
When a GAP is found, a label with the dollar difference between the candles appears on the chart, making it easy to track the gap’s value.
The indicator is particularly useful at the opening of trading sessions in stock markets. It’s optimal to search for GAPs at session transitions on a 5-minute timeframe.
I hope it adds clarity and precision to your trading strategy.
Enjoy trading.
Best regards,
**Radionov Crypto**
---
GAP UP Detection:
Мінімум (low) поточної свічки повинен бути вище за максимум (high ) попередньої свічки.
GAP DOWN Detection:
Максимум (high) поточної свічки повинен бути нижче за мінімум (low ) попередньої свічки.
Візуалізація:
Якщо було знайдено GAP UP, на графіку з'являється символ нижче свічки з текстом "GAP UP" та етикетка з різницею у доларах між цінами свічок.
Якщо було знайдено GAP DOWN, на графіку з'являється символ вище свічки з текстом "GAP DOWN" та етикетка з різницею у доларах між цінами свічок.
Пояснення:
GAP UP визначається, коли ціла свічка (тіло і тінь) знаходиться вище за максимум попередньої свічки.
GAP DOWN визначається, коли ціла свічка (тіло і тінь) знаходиться нижче за мінімум попередньої свічки.
Це забезпечує, що тільки ті випадки, де нова свічка повністю знаходиться поза попередньою свічкою, будуть враховані як GAP.
Якщо було знайдено GAP, на графіку з’являється етикетка з різницею у доларах між свічками, що дозволяє легко відстежувати значення розриву.
Індикатор зручно використовувати на стиках торгівельних сессій на фондових ринках. Оптимально шукати GAP саме на стиках сессій на таймфреймі 5 хвилин.
Сподіваюся, що він додасть до вашої торгівельної стратегії соковитості й точності.
Приємного користування.
Із повагою,
Radionov Crypto
Gap

Fair Value Gap (FVG) Oscillator [UAlgo]The "Fair Value Gap (FVG) Oscillator " is designed to identify and visualize Fair Value Gaps (FVG) within a given lookback period on a trading chart. This indicator helps traders by highlighting areas where price gaps may signify potential trading opportunities, specifically bullish and bearish patterns. By leveraging volume and Average True Range (ATR) data, the FVG Oscillator aims to enhance the accuracy of pattern recognition and provide more reliable signals for trading decisions.
🔶 Identification of Fair Value Gap (FVG)
Fair Value Gaps (FVG) are specific price areas where gaps occur, and they are often considered significant in technical analysis. These gaps can indicate potential future price movements as the market may return to fill these gaps. This indicator identifies two types of FVGs:
Bullish FVG: Occurs when the current low price is higher than the high price two periods ago. This condition suggests a potential upward price movement.
Obtains with:
low > high
Bearish FVG: Occurs when the current high price is lower than the low price two periods ago. This condition suggests a potential downward price movement.
Obtains with:
high < low
The FVG Oscillator not only identifies these gaps but also verifies them using volume and ATR conditions to ensure more reliable trading signals.
🔶 Key Features
Lookback Period: Users can set the lookback period to determine how far back the indicator should search for FVG patterns.
ATR Multiplier: The ATR Multiplier is used to adjust the sensitivity of the ATR-based conditions for verifying FVG patterns.
Volume SMA Period: This setting determines the period for the Simple Moving Average (SMA) of the volume, which helps in identifying high volume conditions.
Why ATR and Volume are Used?
ATR (Average True Range) and volume are integrated into the Fair Value Gap (FVG) Oscillator to enhance the accuracy and reliability of the identified patterns. ATR measures market volatility, helping to filter out insignificant price gaps and focus on impactful ones, ensuring that the signals are relevant and strong. Volume, on the other hand, confirms the strength of price movements. High volume often indicates the sustainability of these movements, reducing the likelihood of false signals. Together, ATR and volume ensure that the detected FVGs are both significant and supported by market activity, providing more trustworthy trading signals.
Normalized Values: The FVG counts are normalized to enhance the visual representation and interpretation of the patterns on the chart.
Visual Customization and Plotting: Users can customize the colors for positive (bullish) and negative (bearish) areas, and choose whether to display these areas on the chart, also plots the bullish and bearish FVG counts, a zero line, and the net value of FVG counts. Additionally, it uses histograms to display the width of verified bullish and bearish patterns.
🔶 Disclaimer:
Use with Caution: This indicator is provided for educational and informational purposes only and should not be considered as financial advice. Users should exercise caution and perform their own analysis before making trading decisions based on the indicator's signals.
Not Financial Advice: The information provided by this indicator does not constitute financial advice, and the creator (UAlgo) shall not be held responsible for any trading losses incurred as a result of using this indicator.
Backtesting Recommended: Traders are encouraged to backtest the indicator thoroughly on historical data before using it in live trading to assess its performance and suitability for their trading strategies.
Risk Management: Trading involves inherent risks, and users should implement proper risk management strategies, including but not limited to stop-loss orders and position sizing, to mitigate potential losses.
No Guarantees: The accuracy and reliability of the indicator's signals cannot be guaranteed, as they are based on historical price data and past performance may not be indicative of future results.

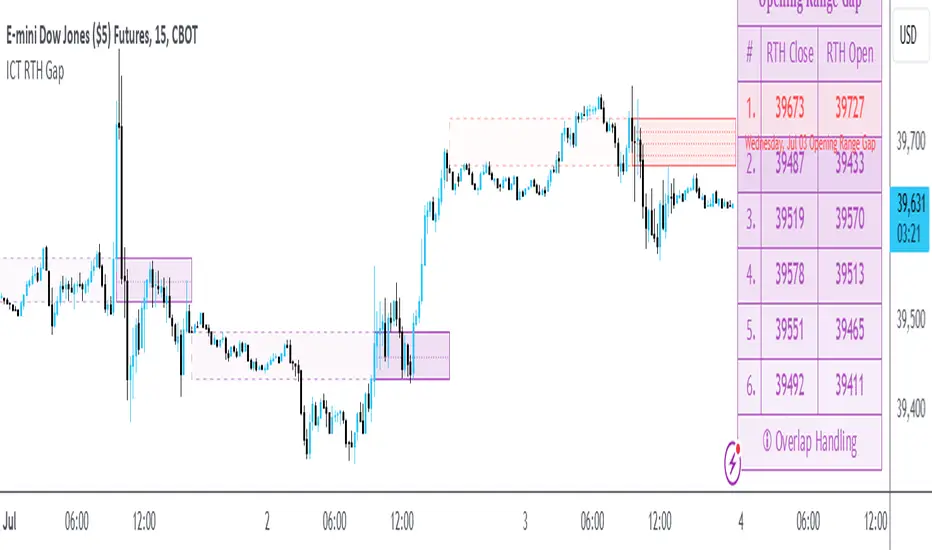
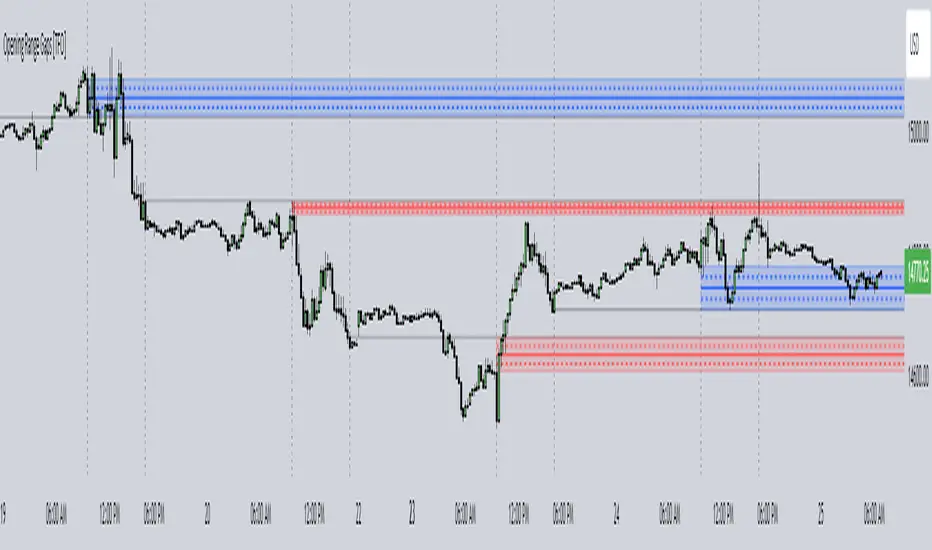
ICT Opening Range GapOpening Range Gap
The Opening Range Gap, also known as the Regular Trading Hours (RTH) Gap, is the distance between the first opening tick of a session and the previous session's close, when looking at a chart's Regular Trading Hours (not to be confused with Electronic Trading Hours). This gap is an important element for Futures Market traders that follow the works of The Inner Circle Trader (ICT). To be more specific, the Opening Range Gap occurs between 4:15pm and 9:30am of the next day.
The Opening Range Gap can be viewed easily when switching the session type to "Regular trading hours".
The image above shows an example of an RTH Gap for Wednesday, June 12, 2024 in CME_MINI:ES1!
How To Use Opening Range Gap
The Opening Range Gap can be used like any other form of a gap by extending it into future price action and looking for it to be filled on the same day or the upcoming days.
Looking for 50% of the gap to be filled as an initial target is one of the methodologies taught by ICT. Additionally, the high and low of the gap (as well as the midpoint) can be used as points of dynamic support & resistance, even if the gap is already filled. Therefore, these gaps do not "expire", and they can be used as key price levels extended through to the end of the week.
Disclaimer
This indicator is mainly intended to work for Futures markets, and specifically the following Index Futures markets: E-mini S&P 500 Futures, E-mini NASDAQ-100 Futures, E-mini DOW Futures.
Given that, the indicator still supports various other markets/assets out-of-the-box, such as other types of Futures Markets, Stocks, Options, and more. The main difference will be that other markets may have RTH Gaps forming at different times, rather than the 4:15pm-9:30am gap that occurs in the Index Futures (Regular trading hours).
Indicator Purpose
While RTH Gaps can be labeled by hand, this indicator allows you to quickly plot multiple RTH Gaps and get a quick glimpse at potential gaps that you may have missed, which could end up being useful in your analysis.
This indicator is 100% custom-built, not using code from any other existing indicators that may plot Opening Range Gaps. The main purpose of this indicator was to overcome many shortcomings from other existing indicators, most notably the problem of displaying RTH Gaps while using ETH as the chart session.
Therefore, this indicator has many UNIQUE features, such as:
Ability to maintain accuracy of the closing/opening prices even when changing chart settings (e.g., toggling ETH/RTH sessions, toggling BACK-ADJUSTMENT on futures contracts, toggling SETTLEMENT prices, etc.).
Draw up to 25 previous Opening Range Gaps, even on ultra-low timeframes like the 1-minute or 1-second chart.
Automatically or manually choose which Opening Range Gaps to hide/show on the chart.
Highly customizable, including a different color scheme to easily distinguish between the Current and Previous RTH Gaps.
Modified price values to correctly display prices that use a format like 109'32 (e.g., Bond Futures or Wheat Futures).
Helpful tooltips to provide more detailed information about the RTH Gaps or about the current Input Settings.
Error Messages
There are some conditions which can cause the script to fail and display an error message (by clicking the red exclamation mark next to the indicator.)
Error messages:
Use a Standard Chart Type : this will occur when using a non-standard chart such as Heikin Ashi, Renko, Point & Figure, etc.
Use a Daily or Lower Timeframe : this error will appear when using a higher timeframe chart like weekly or monthly, because it can clutter the chart since RTH Gaps can form every day.
RTH Gap was not detected : this means that no RTH gap was found, which will occur on markets that don't have the option to toggle between ETH and RTH sessions (e.g., Forex or Crypto).
Exceeded the maximum lookback for Bar Replay mode : when using bar replay mode; this can depend on the amount of historical bars available in different account subscription types.
Unable to Activate Bar Replay mode : if the indicator could not be used in Bar Replay mode.
Restart Bar Replay : if the indicator works in Bar Replay but it detected an error that would cause RTH Gaps to be plotted incorrectly.
This is an example of what a script error would look like.
Indicator Settings
Most settings are self-explanatory or have a tooltip with information on what the setting does, but this section will only briefly cover the available settings.
Extend to End of Day : This setting is enabled by default. It will extend each RTH Gap only up to the end of its day (specifically, to the RTH close of the day). The option can be toggled OFF to automatically extend all RTH Gaps to the right-most candle on the chart.
Previous RTH Gaps : Between 1 and 25 previous RTH Gaps can be displayed. The checkbox can be toggled to quickly hide all previous RTH Gaps (but the same effect would be reached by setting the value to 0).
Hide Current RTH Gap : The Current RTH Gap (most recent one), can be optionally hidden from being plotted.
Beginning Anchor Point : Choose the beginning anchor point for all RTH Gaps. The default is "RTH Close", which means that each gap will be drawn on the chart starting from their previous session's RTH close @ 4:15pm. But it will be a more transparent version of the actual gap; this ghost-like image will extend from 4:15pm all the way up to 9:30am where the gap will then be drawn normally from 9:30am onwards. The other option for this setting is "RTH Open" which means that the gap will be drawn starting from the actual 9:30am opening.
Current RTH Gap Style
These settings are used to customize the visual style of the most recent RTH Gap (also known as the "Current" RTH Gap). Note: the exact same set of settings are available for the Previous RTH Gaps. The text label next to each gap can be optionally hidden to clean the chart a little.
Price Table
These are settings to customize the appearance of the Price Table on the right, including the ability to hide it completely. Note: to actually use the color configurations, you must select "Custom Style" in one of the dropdowns, otherwise it will use "Default Style" which means that the Price Table is automatically styled based on the colors chosen in the Current RTH Gap Style and Previous RTH Gap Style settings.
Overlap Handling
One of 7 available overlap handling options can be used to filter which RTH Gaps are plotted on the chart. By default, the "None" option will be selected, meaning that all valid RTH Gaps are plotted on the chart.
Formatting
Date Format : select the format of the date that is shown next to each RTH Gaps.
Timezone : choose the timezone for the RTH Gap closing/opening date-times that are displayed (only in tooltips when you hover over an RTH Gap label).
RTH Gap Label : choose the details to display next to each gap (e.g., date, or gap number, or both).
Price Format : only two options: Auto/Decimal. "Auto" uses custom processing to allow displaying values such as 109'32 for Bond futures.
Tooltips
The indicator provides additional details about an RTH Gap when you hover over a row in the Price Table.
Note: the same information can be found by hovering over the Text Label that is to the right of each RTH Gap (even when the Text Label is disabled via the Settings).
Overlap Handling
The tooltip next to "Select a Strategy" in the options will provide details on each overlap handling strategy. Additionally, when a strategy is selected, a new row in the Price Table will appear; hovering over that will show details about the currently selected strategy, as well as any suggestions in case the inputs were invalid. When a strategy hides an RTH Gap, the number in the Price Table will be replaced with an "Eye" icon, indicating that it is not currently plotted on the chart.
Available strategies are:
Option 1 (Gradients) : select the percentage opacity to shade RTH Gaps in. The more recent RTH Gaps will be closer to the maximum opacity defined, while the older RTH Gaps will appear more transparent, closer to the minimum opacity defined. Note: only affects previous RTH Gaps, not the current RTH Gap.
Option 2 (Day Extension) : select the number of days to extend each RTH Gap up to. Note: this will override the "Extend to End of Day" setting, regardless whether it is toggled ON or OFF.
Option 3 (Nested Gaps) : hides nested gaps, i.e., RTH Gaps that are enclosed within another RTH Gap. Note: this option is only available when the "Extend to End of Day" setting is disabled .
Option 4 (Intersecting Gaps) : hides intersecting/overlapping gaps, i.e., RTH Gaps that overlap one another (this may also include, but is not limited to, nested gaps). The drop-down next to this option allows choosing the priority of which RTH Gaps to hide first. Note: this option is only available when the "Extend to End of Day" setting is disabled .
Option 5 (Gap Width) : the chart will only show RTH Gaps that have a width/size between the defined parameters.
Option 6 (Close Proximity) : the chart will only show the RTH Gaps that are within a certain range from the market price. This can be useful when plotting multiple RTH Gaps while using auto-scaling on the chart. By only showing nearby RTH Gaps, it will prevent the auto-scaling from having to compress the candles to fit the far-away RTH Gaps onto the screen.
Option 7 (CSV) : this option is used if none of the others suit you well; it allows specifically choosing which RTH Gaps to hide or show on the chart.
This is an example that chooses the Overlap Handling Strategy Option 6. Note that in this example, the tooltip in the price table shows a warning that the Input Number should be increased to plot some RTH Gaps on the chart.
Tips
Chart settings can be toggled to "Scale price chart only" to prevent the auto-scaling of TradingView from compressing the chart if there are RTH Gaps that are far away from the current market action.
If you change a lot of indicator settings such as RTH Gap color schemes, you can save the settings as the Default to prevent your settings from resetting the next time you use the indicator.
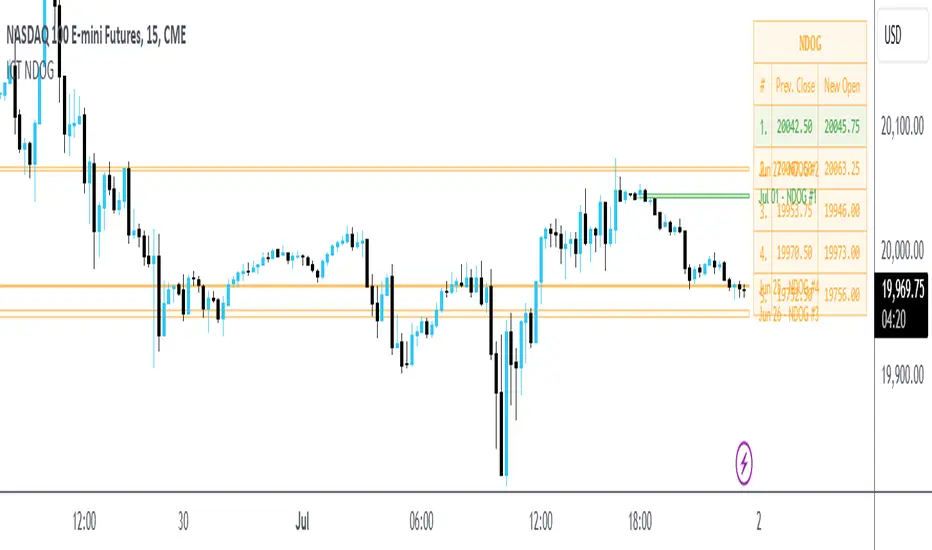
ICT New Day Opening GapNew Day Opening Gap
The New Day Opening Gap (NDOG) is defined by The Inner Circle Trader (ICT) as the separation in time/price that is caused by the 1-hour break that occurs each day in the futures market. The opening price of the gap is the very first tick that occurs at the 6:00pm restart; then we look at the 5:00pm closing price of the previous session. This New Day Opening Gap forms every day from Monday to Friday, but it does not include the gap between Friday's close and Sunday's open (because that is instead referred to as a New Week Opening Gap).
This is an example of a New Day Opening Gap (NDOG) for Wednesday, May 22, 2024 in CME_MINI:ES1!
How To Use NDOG
When an NDOG forms, it can be extended into future price action. One way to use these gaps is to look for it to be filled in by price action. Another usage for these gaps is to look for support & resistance to come in at the high and low of these NDOGs (as well as the midpoint).
Disclaimer
This indicator is mainly intended to work for Futures markets, and specifically the following Index Futures markets: E-mini S&P 500 Futures, E-mini NASDAQ-100 Futures, E-mini DOW Futures.
Given that, the indicator still supports various other markets/assets out-of-the-box, such as other types of Futures Markets, Forex markets, Stocks, Options, and more. The main difference will be that other markets may have NDOGs forming at different times, rather than the 5pm-6pm gap that occurs in the Index Futures.
Indicator Features
This indicator is 100% custom-built, not using code from any other existing NDOG plotting indicators. The purpose of this indicator was to overcome many shortcomings from other existing indicators. Therefore, this indicator has many UNIQUE features, such as:
Ability to maintain accuracy of the closing/opening prices even when changing chart settings (e.g., toggling ETH/RTH sessions, toggling BACK-ADJUSTMENT on futures contracts, toggling SETTLEMENT prices, etc.).
Draw up to 25 previous NDOGs, even on ultra-low timeframes like the 1-minute or 1-second chart.
Automatically or manually choose which NDOGs to hide/show on the chart.
Highly customizable, including a different color scheme to easily distinguish between the Current and Previous NDOGs.
Modified price values to correctly display prices that use a format like 109'32 (e.g., Bond Futures or Wheat Futures).
Helpful tooltips to provide more detailed information about the NDOGs or about the current Input Settings.
Error Messages
There are some conditions which can cause the script to fail and display an error message (by clicking the red exclamation mark next to the indicator.)
Error messages:
Use a Standard Chart Type : this will occur when using a non-standard chart such as Heikin Ashi, Renko, Point & Figure, etc.
Use a Daily or Lower Timeframe : this error will appear when using a higher timeframe chart like weekly or monthly, because it can clutter the chart since NDOGs can form every day.
NDOG was not detected : this means that no NDOG was found, for example if the chart did not have enough bars/candles (e.g., some Options markets).
Exceeded the maximum lookback for Bar Replay mode : when using bar replay mode; this can depend on the amount of historical bars available in different account subscription types.
Unable to Activate Bar Replay mode : if the indicator could not be used in Bar Replay mode.
Restart Bar Replay : if the indicator works in Bar Replay but it detected an error that would cause NDOGs to be plotted incorrectly.
NDOG was not detected. Toggle "Error Handling" Option at your own discretion : this is more of a warning message that will appear when the indicator does not detect any actual gap between the days (e.g., Forex markets where it is continuously traded through each day, without any gap forming in between). But the warning can be dismissed by toggling the checkbox at the bottom of the Indicator's Input Settings.
This is an example of what a script error would look like.
Indicator Settings
Most settings are self-explanatory or have a tooltip with information on what the setting does, so this section will only briefly cover the available settings.
The "Extend to End of Week" option is enabled by default, which will extend each NDOG only up to the end of the week that it belongs to. This option can be toggled OFF to automatically extend all NDOGs to the right-most candle on the chart.
Previous NDOGs: Between 1 and 25 previous NDOGs can be displayed. The checkbox can be toggled to quickly hide all previous NDOGs (but the same effect would be reached by setting the value to 0).
Hide Current NDOG: the current NDOG (colored in Green in the example above), can be optionally hidden from being plotted.
These settings are used to customize the visual style of the most recent NDOG (also known as the "Current" NDOG). Note: the exact same set of settings are available for the Previous NDOGs. The text next to each NDOG can be optionally hidden to clean the chart a little.
These are settings to customize the appearance of the Price Table on the right, including the ability to hide it completely.
One of 7 available overlap handling options can be used to filter which NDOGs are plotted on the chart. By default, the "None" option will be selected, meaning that all valid NDOGs are plotted on the chart.
Date Format : select the format of the date that is shown next to each NDOG.
Timezone : choose the timezone for the NDOG closing/opening date-times that are displayed (only in tooltips when you hover over an NDOG label).
NDOG Label : choose the details to display next to each NDOG (e.g., date, or NDOG number, or both).
Price Format : only two options: Auto/Decimal. "Auto" uses custom processing to allow displaying values such as 109'32 for Bond futures.
This option can be toggled to allow displaying NDOGs for markets that may not have an actual gap between days, such as Forex markets, or BTC/USD (which is traded 24/7). Note: this option must be used at your own discretion because the opening/closing times for the NDOGs are not guaranteed to be accurate.
Tooltips
The indicator provides additional details about an NDOG when you hover over a row in the Price Table.
Note: the same information can be found by hovering over the Text Label that is to the right of each NDOG.
Overlap Handling
The tooltip next to "Select a Strategy" in the options will provide details on each overlap handling strategy. Additionally, when a strategy is selected, a new row in the Price Table will appear; hovering over that will show details about the currently selected strategy, as well as any suggestions in case the inputs were invalid. When a strategy hides an NDOG, the number in the Price Table will be replaced with an "Eye" icon, indicating that it is not currently plotted on the chart.
Available strategies are:
Option 1 (Gradients) : select the percentage opacity to shade NDOGs in. The more recent NDOGs will be closer to the maximum opacity defined, while the older NDOGs will appear more transparent, closer to the minimum opacity defined. Note: only affects previous NDOGs, not the current NDOG.
Option 2 (Week Extension) : select the number of weeks to extend each NDOG up to. Note: this will override the "Extend to End of Week" setting, regardless whether it is toggled ON or OFF.
Option 3 (Nested Gaps) : hides nested gaps, i.e., NDOGs that are enclosed within another NDOG. Note: this option is only available when the "Extend to End of Week" setting is disabled .
Option 4 (Intersecting Gaps) : hides intersecting/overlapping gaps, i.e., NDOGs that overlap one another (this may also include, but is not limited to, nested gaps). The drop-down next to this option allows choosing the priority of which NDOGs to hide first. Note: this option is only available when the "Extend to End of Week" setting is disabled .
Option 5 (Gap Width) : the chart will only show NDOGs that have a width between the defined parameters. This can be useful to filter out NDOGs that are deemed "insignificant". For example, the Inner Circle Trader will generally filter out of his analysis any NDOGs that are less than a point (4 ticks) for Index futures.
Option 6 (Close Proximity) : the chart will only show the NDOGs that are within a certain range from the market price. This can be useful when plotting multiple NDOGs while using auto-scaling on the chart. By only showing nearby NDOGs, it will prevent the auto-scaling from having to compress the candles to fit the far-away NDOGs onto the screen.
Option 7 (CSV) : this option is used if none of the others suit you well; it allows specifically choosing which NDOGs to hide or show on the chart.
This is an example that chooses the Overlap Handling Strategy Option 6. Note that in this example, the tooltip in the price table shows a warning that the Input Number should be increased to plot some NDOGs on the chart.
Tips
Chart settings can be toggled to "Scale price chart only" to prevent the auto-scaling of TradingView from compressing the chart if there are NDOGs that are far away from the current market action.
If you change a lot of indicator settings such as NDOG color schemes, you can save the settings as the Default to prevent your settings from resetting the next time you use the indicator.
lib_session_gapsLibrary "lib_session_gaps"
simple lib to calculate the gaps between sessions
time_gap()
calculates the time gap between this and previous session (in case of irregular end of previous session, considering extended sessions)
Returns: the time gap between this and previous session in ms (time - time_close )
bar_gap()
calculates the bars missing between this and previous session (in case of irregular end of previous session, considering extended sessions)
Returns: the bars virtually missing between this and previous session (time gap / bar size in ms)
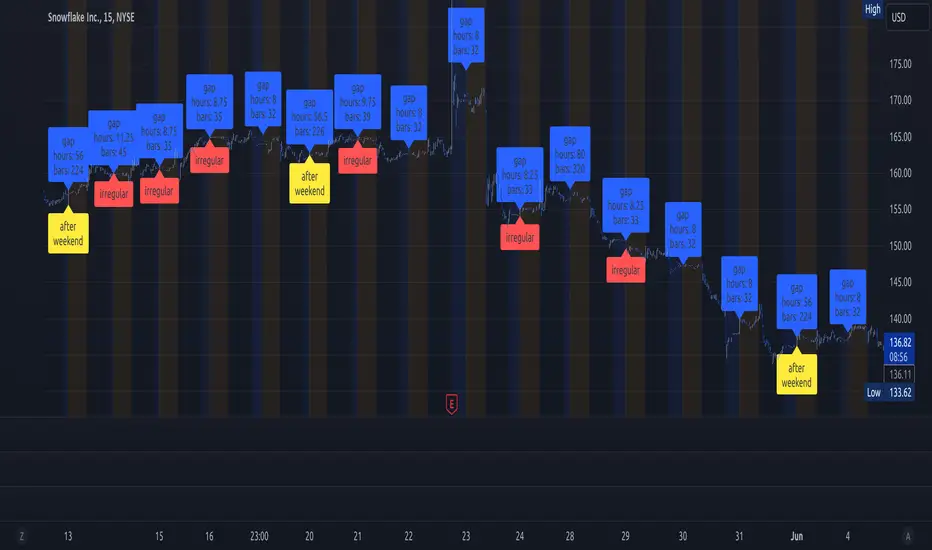
Gap Finder by DarkoexeThis indicator plots labels that indicate gaps whenever the open price and the previous bar close price have a significant gap.
To determine the size the gap has to be before it is labeled at a specific point in time on the chart. The gap needs to be larger or equal to a factor of an ATR value. For example, if the ATR gap factor is 0.25, the gap between the open and the previous close price must be greater than 0.25*ATR of the ATR length specified for the gap to be plotted on the chart.
Note: If you don't know what the ATR or average true range is, search for "ATR" in indicators. It is one of Trading View's most fundamental indicators.

Precise Gap FinderPrecise Gap Finder
This indicator identifies Fair Value Gaps (FVGs) in price action and it is perfect for traders looking to exploit price imbalances and capitalize on trading opportunities.
How It Works:
The Precise Gap Finder detects Fair Value Gaps by analyzing three consecutive candles. A gap is identified when the middle candle’s price range (open to close) is not overlapped by the high and low prices of the surrounding candles. This indicates a price imbalance, which can be a strong signal for potential market moves.
How to Use for Trading:
Identify Entry Points: Use the highlighted Fair Value Gaps to spot potential entry points. An upward FVG can indicate a potential buying opportunity, while a downward FVG can signal a potential selling opportunity.
Confirm Trends: Combine the FVG signals with other technical indicators to confirm trends and enhance the accuracy of your trades.
Risk Management: Use FVGs to identify potential stop-loss and take-profit levels. Gaps can serve as natural support and resistance levels.
Backtesting: Analyze historical data to understand how FVGs have impacted price movements in the past, helping you refine your trading strategy

ICT New Week Opening GapDisplay the Current New Week Opening Gap (NWOG) on your Futures Market charts.
Disclaimer: this indicator is completely built from scratch, which is why not many features are added yet.
This indicator is 100% UNIQUE in the way that the NWOG remains accurately drawn on the chart, regardless of which chart settings are modified (for example, Settlement-as-Close, RTH/ETH, Back-Adjustment, etc.), unlike other NWOG plotting indicators.
Additionally, the NWOG can be plotted on a large variety of timeframes, from the Weekly chart, all the way down to the 1-second chart.
The NWOG is defined as Friday's closing price (e.g., at 4:59pm New York Time for ES1!) and Sunday's opening price (e.g., at 6:00pm New York Time for ES1!) on a new week.
This indicator draws a Box at these levels and extends it out in time to the most recent bar so that it can be visualized how price reacts to and gyrates around these levels.
Basically, the Box that is drawn on the chart by this indicator can be used as dynamic support & resistance levels. The actual price levels are shown at the top-right of the chart in a small table, for anyone wanting to remove the indicator and draw the levels themselves.
Only the current week's opening price and the previous week's closing price will be drawn on the chart.
The indicator settings are only used to change the visuals such as box colors and text colors/size. The actual calculations are performed as mentioned above and cannot be changed by the Style/Settings Input.
Note: it is recommended to toggle ON the " Scale Price Chart Only " chart option if using auto-scaling on charts because TradingView by default will force indicator drawings to display on the chart area even if an NWOG is far away from the current price action.
This is a bare bones indicator (1st version) that will only draw the current NWOG. Future updates will add support for displaying historical NWOGs.
For support of additional markets or indicator settings/features, please leave a comment on this script.

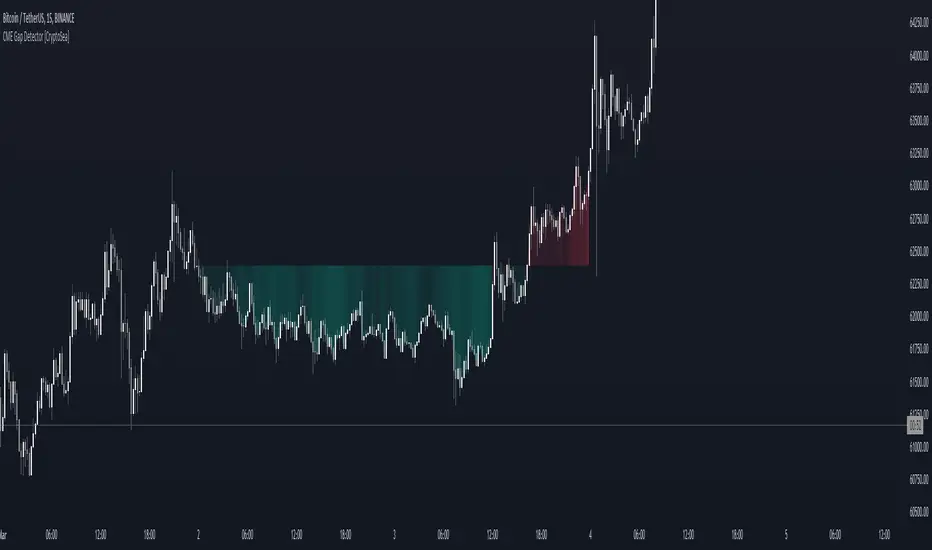
CME Gap Oscillator [CryptoSea]Introducing the CME Gap Oscillator , a pioneering tool designed to illuminate the significance of market gaps through the lens of the Chicago Mercantile Exchange (CME). By leveraging gap sizes in relation to the Average True Range (ATR), this indicator offers a unique perspective on market dynamics, particularly around the critical weekly close periods.
Key Features
Gap Measurement : At its core, the CME Oscillator quantifies the size of weekend gaps in the context of the market's volatility, using the ATR to standardize this measurement.
Dynamic Levels : Incorporating a dynamic extreme level calculation, the tool adapts to current market conditions, providing real-time insights into significant gap sizes and their implications.
Band Analysis : Through the introduction of upper and lower bands, based on standard deviations, traders can visually assess the oscillator's position relative to typical market ranges.
Enhanced Insights : A built-in table tracks the frequency of the oscillator's breaches beyond these bands within the latest CME week, offering a snapshot of recent market extremities.
Settings & Customisation
ATR-Based Measurement : Choose to measure gap sizes directly or in terms of ATR for a volatility-adjusted view.
Band Period Adjustability : Tailor the oscillator's sensitivity by modifying the band calculation period.
Dynamic Level Multipliers : Adjust the multiplier for dynamic levels to suit your analysis needs.
Visual Preferences : Customise the oscillator, bands, and table visuals, including color schemes and line styles.
In the example below, it demonstrates that the CME will want to return to the 0 value, this would be considered a reset or gap fill.
Application & Strategy
Deploy the CME Oscillator to enhance your market analysis
Market Sentiment : Gauge weekend market sentiment shifts through gap analysis, refining your strategy for the week ahead.
Volatility Insights : Use the oscillator's ATR-based measurements to understand the volatility context of gaps, aiding in risk management.
Trend Identification : Identify potential trend continuations or reversals based on the frequency and magnitude of gaps exceeding dynamic levels.
The CME Oscillator stands out as a strategic tool for traders focusing on gap analysis and volatility assessment. By offering a detailed breakdown of market gaps in relation to volatility, it empowers users with actionable insights, enabling more informed trading decisions across a range of markets and timeframes.

CME Gap Detector [CryptoSea]The CME Gap Indicator , is a tool designed to identify and visualize potential price gaps in the cryptocurrency market, particularly focusing on gaps that occur during the weekend trading sessions. By highlighting these gaps, traders can gain insights into potential market movements and anticipate price behavior.
Key Features
Gap Identification: The indicator identifies gaps in price between the Friday close and the subsequent opening price on Monday. It plots these gaps on the chart, allowing traders to easily visualize and analyze their significance.
Weekend Price Comparison: It compares the closing price on Friday with the opening price on Monday to determine whether a gap exists and its magnitude.
Customizable Visualization: Traders have the option to customize the visualization of the gaps, including the color scheme for better clarity and visibility on the chart.
Neutral Candle Color Option: Users can choose to display neutral candle colors, enhancing the readability of the chart and reducing visual clutter.
How it Works
Data Fetching and Calculation: The indicator fetches the daily close price and calculates whether a gap exists between the Friday close and the subsequent Monday opening price.
Plotting: It plots the current price and the previous Friday's close on the chart, making it easy for traders to compare and analyze.
Gradient Fill: The indicator incorporates a gradient fill feature to visually represent the magnitude of the gap, providing additional insights into market sentiment.
Weekend Line Logic: It includes logic to identify Sunday bars and mark them on the chart, aiding traders in distinguishing weekend trading sessions.
Application
Gap Trading Strategy: Traders can use the identified gaps as potential entry or exit points in their trading strategies, considering the tendency of price to fill gaps over time.
Market Sentiment Analysis: Analyzing the presence and size of weekend gaps can provide valuable insights into market sentiment and participant behavior.
Risk Management: Understanding the existence and significance of gaps can help traders manage their risk exposure and make informed decisions.
The CME Gap indicator offers traders a valuable tool for analyzing weekend price gaps in the cryptocurrency market, empowering them to make informed trading decisions and capitalize on market opportunities.
FVG Breakaway/3rd Candle (Arjo) [MK]Simple script to identify FVGs (Fair Value Gaps) on the current chart timeframe. The script differs from other FVG indicators on the Tradingview platform by using Arjos 3rd candle rule to identify which gaps are 'Breakway Gaps' and which Gaps are likely to be returned to.
NOTE: As with all 'trading rules' this theory is not 100% accurate.
default settings:
Breakaway Gaps = YELLOW
Gaps that price may return to = GREEN
Mitigated Gaps = 100% TRANSPARENT
What is a FVG:
A FVG is a price area defined by a 3 candle pattern. For a bullish FVG, the low of the 3rd candle must be higher than the high of the 1st candle. This then leaves an area that is drawn as in the example below:
A bearish FVG is defined by the high of the 3rd candle being lower than the low of the 1st candle, as shown in the example below:
FVGs can act like magnets where price will either retrace to or reach for, therefore they can be used as entry points and also for take profit target levels.
If for example, a trader would like to use an FVG for an entry, it would be useful to know which FVGs are more likely for price to re-enter and which FVG will be left un-touched. FVGs that are likely to be left un-touched by price are called 'Breakaway Gaps'.
How do we define a 'Breakaway Gap':
First we identify FVGs using the rules stated above, then we look to see where the 3rd candle closed in relation to the 2nd candle. For a bullish 'Breakaway Gap' we want to see the 3rd candle close above the high of the 2nd candle. An example of a bullish Breakaway Gap is shown in the example below:
A bearish 'Breakaway Gap' is defined by the close of the 3rd candle being lower than the low of the 2nd candle. An example is shown below:
How do we define an FVG that price may return to:
Any gap that does not meet the above rules for a 'Breakway Gap' is therefore considered an FVG that price may return to. So for a bullish FVG that price may return to we would look to see if the close of the 3rd candle is above the high of the 2nd candle. If it is not above the high of the 2nd candle then it more likely that price will retrace into the FVG before continuing higher. An example is shown below:
A bearish gap that price may return to is defined by the close of the 3rd candle not being lower than the low of the 2nd candle. An example is shown below:
The indicator is based on the teachings of 'Arjo'. Note: breakaway gaps will only remain 'breakaway' until a liquidity level is reached. Breakaways therefore do not remain 'breakaway' forever. Users of the indicators must fully comprehend this theory before using the indicator with live markets.
Users of the script should be fully aware of this concept and also have conducted thorough backtesting using a large data set before using this indicator with live accounts.

Gap Removal IndicatorThis gap indicator shows the price of your chosen instrument as if no gaps had occurred overnight. It can be especially useful on highly-volatile exchange-listed instruments that track other 24/7 assets, because the normal candlestick chart of these instruments will create a large amount of noise that may decrease the accuracy of your indicators or make the trend harder to see.
Gaps are determined with the following code:
daychange = ta.change(dayofmonth)
gapup = daychange and open > math.max(open,close)
gapdown = daychange and open < math.min(open,close)
Whereas the gap value is determined by taking the overnight difference in prices:
downgap_change = math.min(open,close) - open
upgap_change = open - math.max(open,close)
The gap changes are cumulatively added and subtracted from the initial closing price to create the gap-adjusted price. The price will depend on how many bars your subscription allows, so pay more attention to the relative differences and/or trend than the cumulative gap-adjusted price itself.
The gap indicator comes pre-built with normal candlestick and Heikin-Ashi candle types, and four indicators (two EMAs, Bollinger bands, and a supertrend). All elements are configurable.

Opening Range Gaps [TFO]This indicator displays Opening Range Gaps with an adjustable time window. Its intention is to capture the discrepancy between the close price of previous and new Real Trading Hours (RTH) sessions, i.e. yesterday's close compared to today's open. A gap will be drawn from this area with a solid line denoting its midpoint, and dashed lines denoting the upper and lower quartiles of its range. Its color is determined by whether the new session open price is above or below the previous session close.
The Gap Session parameter allows users to define the specific time window for which to capture the "gap" in price. Using U.S. index futures as an example, we can use 16:00 - 09:30 (EST) to capture the discrepancy between the previous day's close price and the current day's open price. However, this parameter is left as adjustable for users that may want to observe different markets or simply experiment with different time windows.
Show Session Delineations will draw vertical timestamps denoting the start and end times of the provided Gap Session. Track Start Price serves as a visual aid to track the initial price of the Gap Session until its end price is validated, for easy visual verification of a gap's upper and lower bounds. With both options turned off, the indicator will only display the gap boxes and lines, as shown here:
Extend Boxes will draw all gaps with an indefinite extension to the right. This can get messy with a large number of boxes, which is why we have a Keep Last parameter to limit how many sessions' drawings should be stored. Any drawings that were made beyond this number of sessions in the past will automatically be deleted.
The Timeframe Limit will dictate that the indicator as a whole will only draw objects on timeframes less than or equal to this timeframe, determined by the user. In some cases this may help users avoid resolution errors which may arise from using timeframes that are too large for a given session. For example, if a user wanted to track a Gap Session of 16:15-09:30, the Timeframe Limit should be set to 15 minutes because the close price at 16:15 cannot be observed on a 30 minute chart (or greater).
Gap Statistics (Zeiierman)█ Overview
The Gap Statistics (Zeiierman) indicator is crafted to monitor, analyze, and visually present price gaps on a trading chart. Price gaps are areas on a chart where the price jumps up or down from the previous close to the next open, creating a "gap" in the normal price pattern. This script delivers an extensive range of statistics related to these gaps, encompassing their size, direction (whether bullish or bearish), frequency of getting filled, as well as the average number of bars it takes for a gap to be filled. The indicator also visually represents the gaps, making it easier for traders to spot and analyze them.
█ How It Works
Gap Identification: The script identifies gaps by comparing the open price of a bar to the close price of the previous bar. If there is a discrepancy between the two, it is recognized as a gap.
Gap Classification: Once a gap is identified, it is classified based on its size (as a percentage of the previous close price) and direction (bullish or bearish). The gap is then added to a specific category based on its size.
Gap Tracking: The script keeps track of all identified gaps using arrays and user-defined types, storing details like their size, direction, and whether they have been filled.
Gap Filling: The script continuously monitors the price to check if any previously identified gaps get filled. A gap is considered filled if the price moves back into the gap area.
Statistics and Alerts: The script calculates various statistics like the total number of gaps, the number of filled gaps, the average number of bars it takes for a gap to fill, and the percentage of gaps that get filled. It also generates alerts when a new gap is identified or an existing gap gets filled.
█ How to Use
Gaps are often classified into four main types:
Common Gaps: These are not associated with any major news and are likely to get filled quickly.
Breakaway Gaps: These occur at the end of a price pattern and signal the beginning of a new trend.
Runaway Gaps: Also known as continuation gaps, these occur in the middle of a trend and signal a surge in interest in the stock.
Exhaustion Gaps: These occur near the end of a price pattern and signal a final attempt to hit new highs or lows.
The Gap Statistics (Zeiierman) indicator enhances a trader's ability to use gaps in their trading strategy in several ways:
Statistical Analysis: Traders get comprehensive statistics on gaps, such as their size, direction, and how often they get filled.
Performance Tracking: The indicator tracks how many bars it typically takes for a gap to fill, providing traders with an average timeframe for gap closure.
█ Settings
Display Gaps: Choose to display "All Gaps," "Active Gaps," or "None."
Show Gap Size: Toggle on/off the display of the gap size.
-----------------
Disclaimer
The information contained in my Scripts/Indicators/Ideas/Algos/Systems does not constitute financial advice or a solicitation to buy or sell any securities of any type. I will not accept liability for any loss or damage, including without limitation any loss of profit, which may arise directly or indirectly from the use of or reliance on such information.
All investments involve risk, and the past performance of a security, industry, sector, market, financial product, trading strategy, backtest, or individual's trading does not guarantee future results or returns. Investors are fully responsible for any investment decisions they make. Such decisions should be based solely on an evaluation of their financial circumstances, investment objectives, risk tolerance, and liquidity needs.
My Scripts/Indicators/Ideas/Algos/Systems are only for educational purposes!

itradesize /\ Model x RTH Gap
I’m happy to announce my model and sharing it with you as an indicator.
About the model
The model is based on a range from 18:00 until 1:30. If you are keen you probably know that it's something that based on a bit of Daye's Theory. As Daily Q4 is from 18:00 until 0:00 and I've added a 90's Q1 to it as well that's why it ended up at 1:30.
It's an accumulation range and where we are looking for some opportunities above or below it when the algo is trying to fake the traders as the high and the low of the range are both important zones for liquidity pools. This model works on almost every pair but I've been mostly focusing on indices, especially on ES, NQ, and EUR/USD.
Do not trade before 1:30 AM and do not trade this model after 6:00 AM. So any tradable setup must be valid until 6:00 AM.
*All the mentioned times are based on America/NewYork timezone.
A simple sell setup
∆ If it takes the high of the model, then look for short opportunities.
∆ The best reliable scenario is when a high is taken while retracing back to an HTF PD Array so it will end up in a failure swing, Judas swing, you name it.
∆ When a high is taken you should wait for a market structure shift then it should give a nice displacement where it should retrace.
∆ The imbalance after the shift can be on every timeframe, based on your trade idea.
∆ If there are more imbalances, your decision on which to go with (as if there is a BPR, Breaker, OB, etc.. - can change the view of an FVG).
The same story goes for a buy setup.
∆ The first target is always the EQ of the model's range.
∆ The second target could be liquidity inside the EQ and the other side of the model (optional).
∆ The third target is the other side of the model.
∆ You can always leave a runner there if you eyeing some levels outside the model.
Additional information
∆ You can use silver bullet range as an extra confirmation when you looking for the actual displacement.
∆ An RTH range is also added to the indicator (starts drawing at 9:30 when the futures market opens) as it can be used to trade in the NY session and it is a must-have thing when trading indices.
∆ The colors of every label are switched automatically based on your chart's coloring.

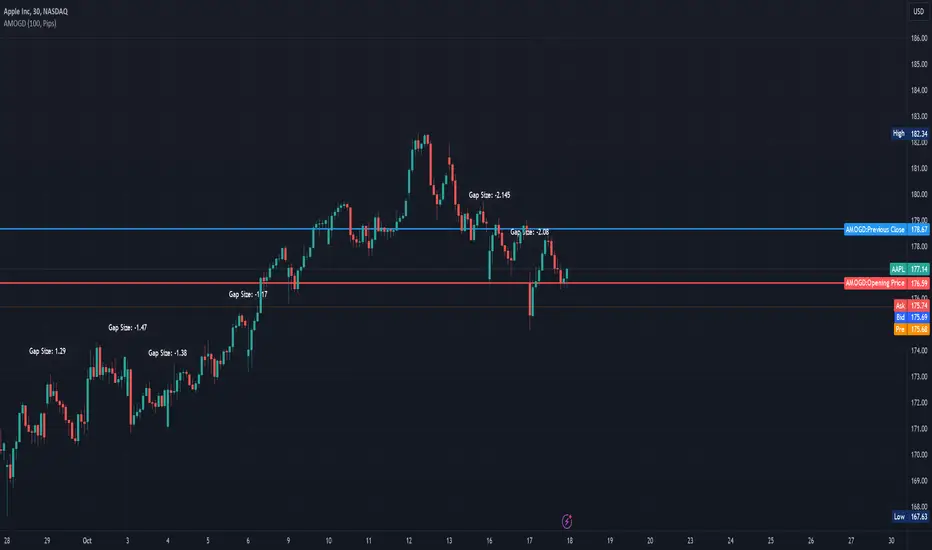
Advanced Market Opening Gap DetectorThe Advanced Market Opening Gap Detector (AMOGD) is a Pine Script indicator designed to help you identify market gaps at the opening of a new trading day. Gaps are areas on a chart where the price of a security moves sharply up or down with little or no trading in between. They are significant as they may indicate a change in market sentiment. This indicator highlights the size and direction of the opening gap, allowing you to potentially adjust your strategies accordingly.
By setting a minimum gap size, you can filter out smaller, less significant gaps, focusing only on larger gaps which may have more substantial implications. You can define the minimum gap size in points or pips, providing flexibility based on your trading preferences and the asset being traded.
How-to Use:
Apply the AMOGD indicator to your TradingView chart.
Configure the minimum gap size and unit (points or pips) based on your preference using the settings panel.
At the opening of each new trading day, the indicator will check for a gap between the previous close and the opening price.
If a valid gap is detected (i.e., the gap size meets or exceeds the minimum gap size specified), the indicator will:
Draw lines to indicate the opening price and previous close.
Display a label indicating the size of the gap.
Highlight the gap on the chart for better visibility.
Importance:
Market gaps can be pivotal points indicating a possible new trend or a continuation of the current trend. Being able to identify and analyze these gaps is crucial for making informed trading decisions. The AMOGD indicator automates the process of identifying and visualizing opening market gaps, saving traders time and allowing for quick assessment of market conditions at the start of each trading day. By setting a minimum gap size, traders can also filter out less significant price movements, allowing them to focus on potentially trend-changing gaps. This tool can be a valuable addition to a trader's toolkit, aiding in the analysis and interpretation of market behavior at the open, which is often a very volatile and crucial period in the trading day.
DISCLAIMER! RISK WARNING!
PAST PERFORMANCE IS NOT NECESSARILY INDICATIVE OF FUTURE RESULTS. TRADERS SHOULD NOT BASE THEIR DECISION ON INVESTING IN ANY TRADING PROGRAM SOLELY ON THE PAST PERFORMANCE PRESENTED, ADDITIONALLY, IN MAKING AN INVESTMENT DECISION, TRADERS MUST ALSO RELY ON THEIR OWN EXAMINATION OF THE PERSON OR ENTITY MAKING THE TRADING DECISIONS.
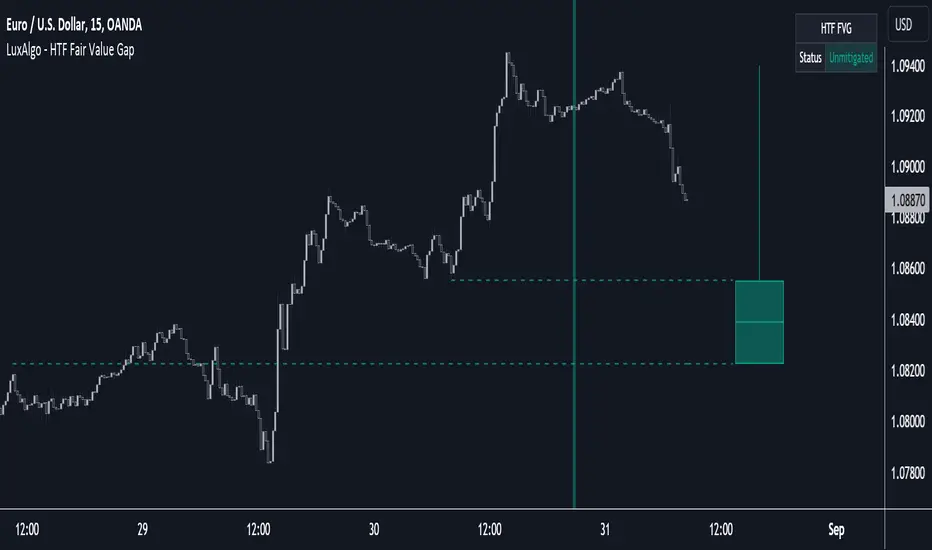
HTF Fair Value Gap [LuxAlgo]The HTF Fair Value Gap indicator aims to display the exact time/price locations of fair value gaps within a higher user-selected chart timeframe.
🔶 USAGE
The indicator can be used to detect higher time frame fair value gaps. Detected historical HTF FVG are displayed as changes in chart background colors, with a green color indicating a bullish FVG and red a bearish FVG.
The most recent HTF FVG is displayed as a candle to the right of the most recent price candle. Dashed lines indicate the exact location of the FVG upper and lower extremities.
The wicks of the FVG candle indicate the price deviation from the FVG extremities after its formation and can help determine where the FVG is located within a trend.
A "Status" dashboard is included to indicate if the FVG is mitigated or not. This is also indicated by the border of the FVG candle, with a solid border indicating an unmitigated FVG.
🔶 SETTINGS
Timeframe: Chart timeframe used to retrieve the fair value gaps
🔹 Style
Offset: Offset to the right (in bars) of the FVG candle from the most recent bar.
Width: Width (in bars) of the FVG candle.
🔹 Dashboard
Show Dashboard: Determine whether to display the dashboard or not.
Location: Location of the dashboard on the chart.
Size: Size of the dashboard on the chart.
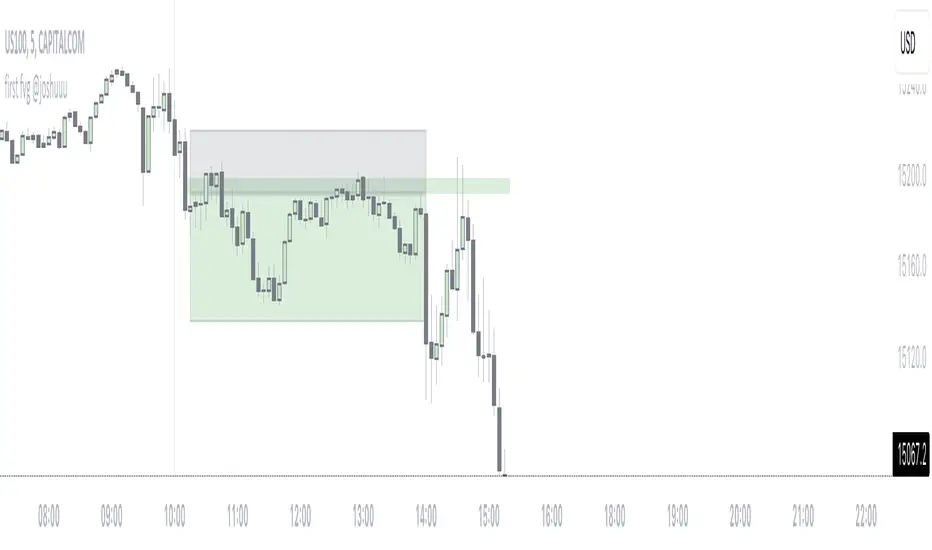
first fvg @joshuuuThis indicator was created to display and alert the user for the first Fair Value Gap (FVG) of up to three trading sessions.
Bullish FVG occurs when the high of the first candle is lower than the low of the third candle, resulting in a price gap between them.
Conversely, a Bearish FVG takes place when the low of the first candle is higher than the high of the third candle, leading to a gap between these prices.
ICT emphasizes on three crucial timeframes: 3-4 am NY, 10-11 am NY, and 2-3 pm NY, collectively referred to as the 'silver bullet' times. The very first FVG formed during these periods can significantly impact the remainder of that trading session.
Building upon these concepts, CasperSMC developed a strategy involving buying/selling the very first FVG and placing a stop order just above/below the candle responsible for creating the FVG.
The strategy aims for a consistent 2-to-1 Reward-to-Risk ratio (2RR).
This indicator serves to support the strategy by not only displaying those fvgs but also sending alerts, reducing the need for constant screen monitoring.
Opening Range Gap + Std Dev [starclique]The ICT Opening Range Gap is a concept taught by Inner Circle Trader and is discussed in the videos: 'One Trading Setup For Life' and 2023 ICT Mentorship - Opening Range Gap Repricing Macro
ORGs, or Opening Range Gaps, are gaps that form only on the Regular Trading Hours chart.
The Regular Trading Hours gap occurs between 16:15 PM - 9:29 AM EST (UTC-4)
These times are considered overnight trading, so it is useful to filter the PA (price action) formed there.
The RTH option is only available for futures contracts and continuous futures from CME Group.
To change your chart to RTH, first things first, make sure you’re looking at a futures contract for an asset class, then on the bottom right of your chart, you’ll see ETH (by default) - Click on that, and change it to RTH.
Now your charts are filtering the price action that happened overnight.
To draw out your gap, use the Close of the 4:14 PM candle and the open of the 9:30 AM candle.
How is this concept useful?
Well, It can be used in many ways.
---
How To Use The ORG
One of the ways you can use the opening range gap is simply as support and resistance
If we extend out the ORG from the example above, we can see that there is a clean retest of the opening range gap high after breaking structure to the upside and showing acceptance outside of the gap after consolidating within it.
The ORG High (4:14 Candle Close in this case) was used as support.
We then see an expansion to the upside.
Another way to implement the ORG is by using it as a draw on liquidity (magnet for price)
In this example, if we looked to the left, there was a huge ORG to the downside, leaving a massive gap.
The market will want to rebalance that gap during the regular trading hours.
The market rallies higher, rejects, comes down to clear the current days ORG low, then closes.
That is one example of how you can combine liquidity & ICT market structure concepts with Opening Range Gaps to create a story in the charts.
Now let’s discuss standard deviations.
---
Standard Deviations
Standard Deviations are essentially projection levels for ranges / POIs (Point of Interests)
By this I mean, if you have a range, and you would like to see where it could potentially expand to, you’d place your fibonacci retracement tool on and high and low of the range, then use extension levels to find specific price points where price might reject from.
Since 0 and 1 are your Range High and Low respectively, your projection levels would be something like 1.5, 2, 2.5, and 3, for the extension from your 1 Fib Level, and -0.5, -1, -1.5, and -2 for your 0 Fib level.
The -1 and 2 level produce a 1:1 projection of your range low and high, meaning, if you expect price to expand as much as it did from the range low to range high, then you can project a -1 and 2 on your Fib, and it would show you what ICT calls “symmetrical price”
Now, how are standard deviations relevant here?
Well, if you’ve been paying attention to ICT’s recent videos, you would’ve caught that he’s recently started using Standard Deviation levels on breakers.
So my brain got going while watching his video on ORGs, and I decided to place the fib on the ORG high and low and see what it’d produce.
The results were very interesting.
Using this same example, if we place our fib on the ORG High and Low, and add some projection levels, we can see that we rejected right at the -2 Standard Deviation Level.
---
You can see that I also marked out the EQ (Equilibrium, 50%, 0.5 of Fib) of the ORG. This is because we can use this level as a take profit level if we’re using an old ORG as our draw.
In days like these, where the gap formed was within a consolidation, and it continued to consolidate within the ORG zone that we extended, we can use the EQ in the same way we’d use an EQ for a range.
If it’s showing acceptance above the EQ, we are bullish, and expect the high of the ORG to be tapped, and vice versa.
---
Using The Indicator
Here’s where our indicator comes in play.
To avoid having to do all this work of zooming in and marking out the close and open of the respective ORG candles, we created the Opening Range Gap + Standard Deviations Indicator, with the help of our dedicated Star Clique coder, a1tmaniac.
With the ORG + STD DEV indicator, you will be able to view ORG’s and their projections on the ETH (Electronic Trading Hours) chart.
---
Features
Range Box
- Change the color of your Opening Range Gap to your liking
- Enable or disable the box from appearing using the checkbox
Range Midline
- Change the color of your Opening Range Gap Equilibrium
- Enable or disable the midline from appearing using the checkbox
Std. Dev
- Add whichever standard deviation levels you’d like.
- By default, the indicator comes with 0.5, 1, 1.5, and 2 standard deviation levels.
- Ensure that you add a comma ( , ) in between each standard deviation level
- Enable or disable the standard deviations from appearing using the opacity of the color (change to 0%)
Labels / Offset
- Adjust the offset of the label for the Standard Deviations
- Enable or disable the Labels from appearing using the checkbox
Time
- Adjust the time used for the indicators range
- If you’d like to use this for a Session or ICT Killzone instead, adjust the time
- Adjust the timezone used for the time referenced
- Options are UTC, US (UTC-4, New York Local Time) or UK (UTC+1, London Time)
- By default, the indicator is set to US

Displacement (Two FVGs)A simple indicator that attempts to identify displacement in price by alerting you when two simultaneous Fair Value Gaps (FVGs) occur.
When two fair value gaps occur, the indicator will print a green bar (if bullish) or a red bar (if bearish). If you right click on the indicator you can turn on alerts that will pop up every time a dual FVG occurs.
Fair Value Gaps are most commonly used amongst price action traders and are defined as instances in which there are inefficiencies, or imbalances, in the market.
The concept for this indicator is very simple. Apply it to your chart and enable alerts on the instruments and timeframe you trade. When you get an alert, it could indicate larger players getting involved.
This is NOT a trading strategy. Its intention is to save time by alerting you to large imbalances in price on the instruments you trade.

iGapFinderHi everybody!
I decided to release this script to help traders keeping track of market gaps on the CME.
The script works in general for any market and at any timeframe.
The script allows the user to:
- Identify price gaps of a customized amplitude (Gap Width)
- Compute the probabilities of filling them (specific for bullish and bearish gaps or cumulative)
- Visualize gaps on the chart through red and green price areas.
- Visualize the last N unfilled bullish and bearish gaps together with their time of creation.

Yesterday’s High Breakout - Trend Following StrategyYesterday’s High Breakout it is a trading system based on the analysis of yesterday's highs, it works in trend-following mode therefore it opens a long position at the breakout of yesterday's highs even if they occur several times in one day.
There are several methods for exiting a trade, each with its own unique strategy. The first method involves setting Take-Profit and Stop-Loss percentages, while the second utilizes a trailing-stop with a specified offset value. The third method calls for a conditional exit when the candle closes below a reference EMA.
Additionally, operational filters can be applied based on the volatility of the currency pair, such as calculating the percentage change from the opening or incorporating a gap to the previous day's high levels. These filters help to anticipate or delay entry into the market, mitigating the risk of false breakouts.
In the specific case of NULS, a 9% Take-Profit and a 3% Stop-Loss were set, with an activated trailing-stop percentage. To postpone entry and avoid false breakouts, a 1% gap was added to the price of yesterday's highs.
Name : Yesterday's High Breakout - Trend Follower Strategy
Author : @tumiza999
Category : Trend Follower, Breakout of Yesterday's High.
Operating mode : Spot or Futures (only long).
Trade duration : Intraday.
Timeframe : 30M, 1H, 2H, 4H
Market : Crypto
Suggested usage : Short-term trading, when the market is in trend and it is showing high volatility.
Entry : When there is a breakout of Yesterday's High.
Exit : Profit target or Trailing stop, Stop loss or Crossunder EMA.
Configuration :
- Gap to anticipate or postpone the entry before or after the identified level
- Rate of Change for Entry Condition
- Take Profit, Stop Loss and Trailing Stop
- EMA length
Backtesting :
⁃ Exchange: BINANCE
⁃ Pair: NULSUSDT
⁃ Timeframe: 2H
⁃ Fee: 0.075%
⁃ Slippage: 1
- Initial Capital: 10000 USDT
- Position sizing: 10% of Equity
- Start : 2018-07-26 (Out Of Sample from 2022-12-23)
- Bar magnifier: on
Credits : LucF for Pine Coders (f_security function to avoid repainting using security)
Disclaimer : Risk Management is crucial, so adjust stop loss to your comfort level. A tight stop loss can help minimise potential losses. Use at your own risk.
How you or we can improve? Source code is open so share your ideas!
Leave a comment and smash the boost button!
Thanks for your attention, happy to support the TradingView community.

TradeBee Percent Gap AlertA simple script to enable adding a trigger when a stock reaches 'X' percent, the 'X' can be configured.
The script also displays current tickers gap %, this is particularly helpful when you have 2 or more panels on a chart
