WD Gann: Vertical Lines for Predefined Days/Bars AgoThis Pine Script draws vertical lines on the chart at specific time intervals, inspired by WD Gann’s theories of time cycles . WD Gann, a famous trader, believed that market movements were influenced by predictable time cycles. This script enables traders to visualize these key time cycles on the chart by placing vertical lines at predefined intervals (in bars ago), helping to identify potential turning points in the market.
The time intervals used in this script are inspired by Gann’s work, as well as astrological and numerological principles , which many traders believe influence market behavior . You can customize which time intervals (such as 3, 7, 9, 21, etc.) you want to track by enabling or disabling specific vertical lines on the chart.
Key Features:
Time Cycles Based on Gann’s Theory: Draws vertical lines at significant time intervals such as 3, 7, 9, 21, 27 bars ago, which are commonly used by Gann traders.
Astrological & Numerological Significance: The predefined intervals also align with key numerological and astrological values, allowing for a broader perspective on market cycles.
Customizable Intervals: You can choose which time intervals to display by enabling or disabling checkboxes for each cycle, allowing flexibility in chart analysis.
Visual Labels: Each vertical line is labeled with its corresponding "bars ago" value, providing clear reference points for the selected time cycles.
What Users Can Do:
Track and analyze market movements based on time cycles that are significant to Gann’s theory, as well as numerological and astrological influences.
Enable or disable vertical lines for specific cycles, like the 3-bar cycle, 9-bar cycle, or 365-bar cycle, depending on the intervals that align with your trading strategy.
Combine with other technical analysis tools and Gann techniques (e.g., Gann Angles, Gann Fans, or Square of Nine) for a more comprehensive trading approach.
This tool is designed for traders who believe in the power of time cycles to influence market behavior, and is especially useful for predicting turning points or key price movements based on these cycles.
Gannsq9

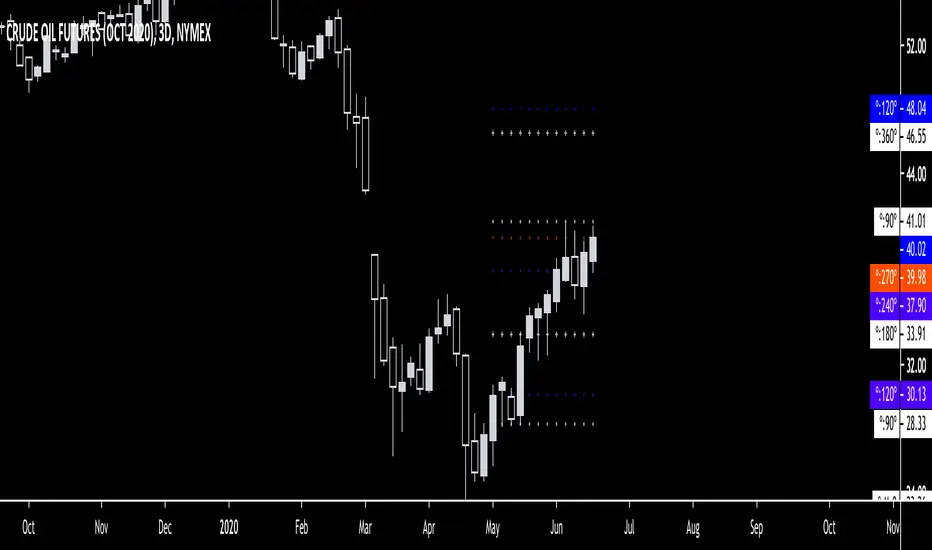
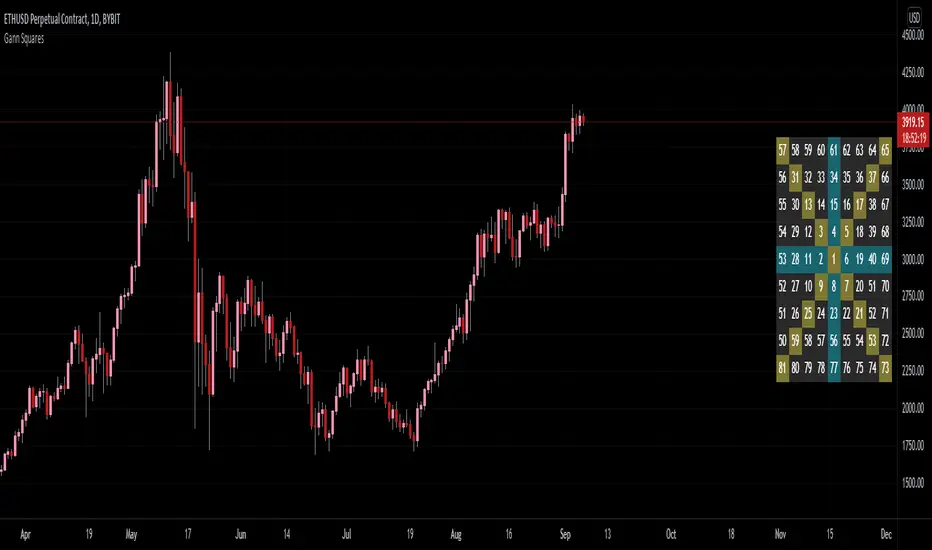
Gann Spiral / Square of 9The Gann Spiral, more commonly known as the Square of 9 is one of the most well known tools that Gann used. Today, it is most commonly used to find possible support and resistance levels, and possible reversals in time.
This indicator is a more flexible version of the traditional Gann Spiral / Square. This is achieved by allowing you to change:
Price and Time direction
The timeframe
How often to draw lines based on degrees
Toggles for Price and Time
Price and Time line customization
How to use:
1 - Select your desired starting value of Price and Time.
2 - Choose the direction of Price and Time.
3 - Choose the amount of lines to display.
4 - Choose how often for lines to be drawn (Rotation Degree Value).
==================================================================
Side Note:
This uses a more proper and more accurate formula to "navigate the square". (Sqr x + 2)^2 is not the formula used, but rather (Sqr x + 1)^2.
If you wish to use the formula you're used to, change Full Revolution Value to 180.
The reasoning behind this formula change is because I re-created the square in the form of an actual spiral. The issue with such a conversion is that the formula used to construct it uses one Pi. If you understand circles, you should know that we're off by 180 degrees. A full rotation is 360, not 180.
Correcting for this error requires a slight but important change in the formula, that being +1 instead of +2. This not only corrects it to fit for a proper spiral, but also makes it easier to use fractions. 1/360 results in 1 degree. This slight formula change makes it incompatible when used on the actual Square of 9, however it is technically the more accurate formula.

Gann Square This indicator build by Gann Square of 19.
you select start and end of big trend in daily timeframe and calculate date range.
by draw trend line in Gann square and enter the numbers cross by line in settings input you could recognize future pivot points
remember : first) this tool worked only in daily timeframe. second) better using this in dark theme :)
chart example :
Magic levelsIt is by far the simplest on chart presentation of Gann square of 9. It calculates the levels based on previous day closing. These levels usually acts as support and resistance.

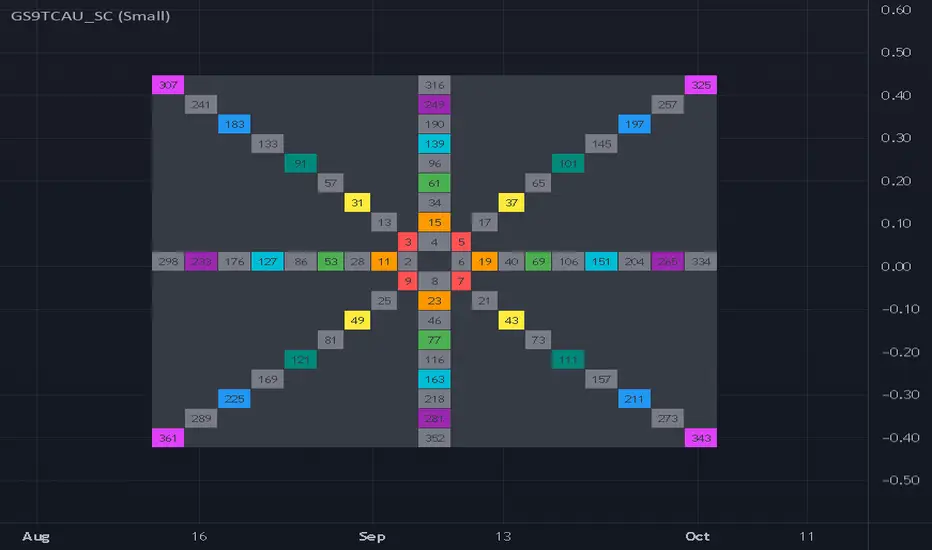
Gann Square of 9Gann's Square's are some of the best known tools created by Gann. His most well known square was his Square of 9.
The reason for this was because of the symmetry 9 had with itself. Gann was able to balance both price and time with this symmetry.
- 9 is the last single-digit and largest number
- You can add anything to 9 and it will give you a natural number
- (9 + 3 = 12); 1 + 2 = 3... (9 + 9 = 18); 1 + 8 = 9... etc.
- Multiplying any number by 9 will have the natural number be 9
- (9 * 6 = 54); 5 + 4 = 9... (9 * 3 = 27); 2 + 7 = 9... etc.
For these reason, Gann claimed that 9 has everything within itself.
Here I have created an on-chart square of 9 including the cardinal and ordinal cross points colored. In the settings you are able to customize the starting value of the table as well as the period movement. In most cases, 81 is not high enough to be useful in charting cases, so I'd recommend printing out your own Gann Square of 9 that goes as high as you need it to go.
THIS IS NOT TRADING ADVICE ; please use your own technical analysis before making any decisions based off of public indicators. Learn more about Gann's Squares before attempting to use them as this script was not meant to give you answers, only the table.
Gann Square 9 Table Concept Alternate UIThis indicator was intended as educational purpose only for Gann Square 4, specifically to show Cross Cardinal.
This indicator was build upon The Tunnel Thru The Air Or Looking Back From 1940, written by WD Gann .
This build was improved by grouping similar values after selected to save time.
User Interface also was improved.
Indikator ini bertujuan sebagai pendidikan sahaja untuk Gann Square 4, khusus untuk menunjukkan Cross Cardinal.
Indikator ini dibina berdasarkan buku The Tunnel Thru The Air Or Looking Back From 1940, ditulis oleh WD Gann .
Binaan ini telah ditambah baik engan mengumpulkan nilai yang sama setelah dipilih untuk menjimatkan masa.
User Interface juga telah ditambah baik.
Indicator features :
1. Font size from tiny to huge.
2. For desktop display only, not for mobile.
3. All values can be selected by group.
Kemampuan indikator :
1. Saiz font dari paling kecil ke paling besar.
2. Untuk paparan desktop sahaja, bukan untuk mobile.
3. Semua nilai boleh dipilih secara berkumpulan.
FAQ
1. Credits / Kredit
WD Gann , The Tunnel Thru The Air Or Looking Back From 1940
Ganzilla
2. Page involved / Muka Surat terlibat
195 - 198
3. Code Usage / Penggunaan Kod
Free to use for personal usage.
Bebas untuk kegunaan peribadi.
4. Previous build / Binaan sebelum ini
Gann Square 9 Cross Cardinal Table Concept
5. Related build / Binaan berkaitan
Gann Square 4 Cross Cardinal Table Concept
Gann Square 4 Table Concept Alternate UI
Left : Even array number / Kiri : Array nombor genap
Right : Odd array number / Kanan : Array nombor ganjil
Gann Square Of 9 LevelsThis script uses the last hlc3 value of 1H, 4H, D and/or W and rotates it 360º up/down with four increments of 90º to find out potential support and resistance areas. Can be used as a dynamic support & resistance tool or just to gauge how overbought/oversold the market is. Special thanks to @Nv56 for his assistance in writing this script.