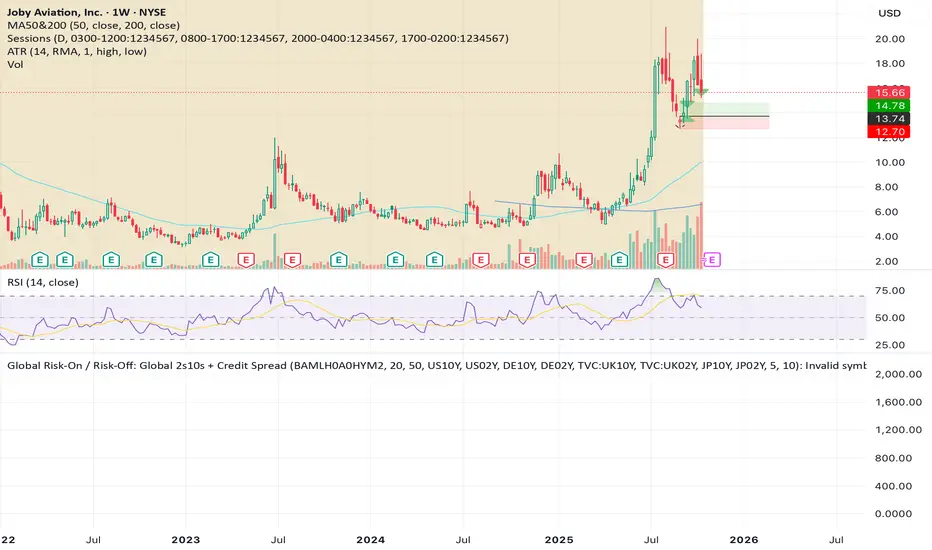
Markets vs Inflation [x7.am]Markets vs Inflation(CPI US) also known as Inflation-Adjusted Return.
The inflation-adjusted return is the measure of return that takes into account the time period's inflation rate. The purpose of the inflation-adjusted return metric is to reveal the return on an investment after removing the effects of inflation.
Removing the effects of inflation from the return of an investment allows the investor to see the true earning potential of the security without external economic forces. The inflation-adjusted return is also known as the real rate of return or required rate of return adjusted for inflation. It is a more accurate measure of investment performance than the nominal rate of return.
The inflation-adjusted return accounts for the effect of inflation on an investment's performance over time.
Also known as the real return, the inflation-adjusted return provides a more realistic comparison of an investment's performance.
Inflation will lower the size of a positive return and increase the magnitude of a loss.
Assume you have saved $10,000 to buy a car but decide to invest the money for a year before buying to ensure that you have a small cash cushion left over after getting the car. Earning 5% interest, you have $10,500 after 12 months. However, because prices increased by 3% during the same period due to inflation, the same car now costs $10,300.
Consequently, the amount of money that remains after you buy the car—which represents your increase in purchasing power—is $200, or 2% of your initial investment. This is your real rate of return, as it represents the amount that you gained after accounting for the effects of inflation.
Markets vs Inflation indicators use in 1 months interval
SP:SPX , INDEX:BTCUSD , TVC:GOLD , TVC:DJI
Temel Analiz
Fair Price [XSfera]The indicator allows you to quickly compare business growth rates (by default, earnings per share, EPS) and stock prices to determine overbought or undervalued.
The financial parameter as a percentage fits together several years ago, by default 5, and displays the dynamics. To date, it allows you to see how much the price is higher or lower than fair. The lag in the share price from the growth rate of the business is often called the margin of safety, which makes it safer to invest. Of course, this does not mean that the market will quickly return to a fair course, the market can live its life for a long time.
It is important that the dynamics will be incorrect if the financial parameter at the beginning of the docking is negative, for example, as in TSLA and not very correct in the case of a low base, i.e. when the company only went into profit 5 years ago.
Индикатор позволяет быстро сравнить темпы роста бизнеса (по-умолчанию прибыль на акцию, EPS ) и цены акции, для определения перекупленности или недооценки.
Финансовый параметр в процентном соотношении стыкуется несколько лет назад, по-умолчанию 5, и отображает динамику. На сегодняшний день позволяет увидеть насколько цена выше или ниже справедливой. Отставание цены акции от темпов роста бизнеса, часто называют маржой безопастности, которая позволяет безопаснее инвестировать. Само собой это не значит что рынок быстро вернется в справедливое русло, рынок может долгое время жить своей жизнью.
Важно что динамика будет неверной если финансовый параметр на начало стыковки будет отрицательным, например как в TSLA и не очень корректным в случае низкой базы, т.е. когда компания только только 5 лет назад вышла в прибыль.
The Price of Hard MoneyIf we calculate “the price of hard money” (the market capitalization weighted price of gold plus Bitcoin); we get this chart.
Since 2017, Bitcoin’s share of hard money growth has been increasing, we can see it visibly on the gold chart by a widening delta between the price of hard money and the Gold price. We can also see some interesting technical behaviours.
In 2021, Hard Money broke out and held this breakout above the 2011 Gold high. Only later in 2022 did a correction of 20% occur – typical of Golds historic volatility in periods of inflation and high interest rates.
Hard Money is at major support and we have evidence for a fundamental shift in investor capital flows away from gold and into Bitcoin.
This Indicator is useful:
- To track the market capitalization of Gold (estimated), Bitcoin and combined market capitalization of Hard Money.
- To track the price action and respective change in investor flows from Gold to Bitcoin .
Provided Bitcoin continues to suck more value out of gold with time, this chart will be useful for tracking price action of the combined asset classes into the years to come.
Quarterly Revenue Labelshow stock reported revenue on a quarter over quarter basis. change percent calculated from a rolling month to previous month basis
Multi-Polar WorldA new macro analysis tool for easily analyzing the multi-polar world's economic powerhouses / spheres of influence, making for an easy to use visual when comparing a number of statistics:
GDP, GDP per Capita, External Debt, Government Debt, Exports, Imports, Gold Reserves, Employed Persons, Military Expenditure, Population, Bank Lending Rate, Balance of Trade, Central Bank Balance Sheet, M2 Money Supply, and CPI . Includes option to provide the total for each pole, or view individually for more detailed comparison. Meant to be used when analyzing the macro-economic conditions/trends in conjunction with other "Big Picture" type indicators when adjusting your macro framework.
(CF|DB) Caruso Financial DashboardThe Caruso Financial Dashboard brings a rich amount of company financial data straight to your TradingView chart along with additional vital stock-related information. At a glance, you can see EPS (Diluted), Sales, growth rates, and EPS/Sales surprises either quarter by quarter on the daily chart or for Fiscal Years on the weekly chart.
On the daily chart, the financial table also has helpful highlights to visually display if a quarter’s EPS or Sales are higher than the same quarter a year ago. Also, EPS and Sales data has a helpful green shading when a new record high number has been achieved for the metric. Additional stock-based metrics include the stock’s Up/Down volume ratio, Beta, Average Daily Volume in terms of shares traded or dollar value traded, the percentage distance to a moving average of choice, as well as the stock’s 52-week high and low.
The weekly chart shows financial data for fiscal years. It also has additional stock-based metrics from those available on the daily chart. These include; Market Cap, Shares in Float and the Float as a percentage of all shares outstanding, the distance from the stock’s 52-week high, the distance to a moving average of choice (10 sma by default), the P/E and P/S ratios.
To further help an investor understand a company’s growth rates, the CF|DB allows a user to hide all or part of the table and plot EPS, EPS TTM (Trailing Twelve Months), and Sales TTM lines on the chart. This can be applied to either the daily or weekly chart.
The CF|DB provides financial and market data for international markets (US, EU, Canada, Australia, Hong Kong, Japan, and more), making its applicability global.
Features On Daily Chart
· Quarterly EPS
· Quarterly EPS growth rate YoY
· Quarterly EPS Surprise vs consensus estimate
· Quarterly Sales
· Quarterly Sales growth rate YoY
· Quarterly Sales Surprise vs consensus estimate
· Green/Red dot highlighting YoY growth or decline
· EPS/Sales green highlight for 8 quarter high or record high numbers
· Up/Down Volume Ratio
· Beta
· Average Daily Volume (shares trade). Period for the average can be configured
· Average Daily Volume (dollar value traded). Period for the average can be configured
· Distance to a moving average. The average can be configured. 21 ema by default
· 52-week high and low
· New 52-week highs and lows are highlighted by a red or green box shading
· Ability to plot EPS, EPS TTM, Sales lines
· Ability to hide part or all of the financial data table
Features On Weekly Chart
· FY EPS
· FY EPS growth rate YoY
· FY EPS Surprise vs consensus estimate
· FY Sales
· FY Sales growth rate YoY
· FY Sales Surprise vs consensus estimate
· EPS/Sales green highlight for 8-year high or record high numbers
· Market Cap
· Shares in float
· Share in float as a percentage of all shares outstanding
· Distance to new 52-week highs
· Distance to a moving average. The average can be configured. 10 sma by default
· Ability to plot EPS, EPS TTM, Sales lines
· Ability to hide part or all of the financial data table
PE Band V2PE Band is a very practical stock selection technique for investors, which can be used to judge whether the company's stock price is currently overvalued or undervalued.
The PE ratio center line of the stock must be set every time the stock is changed because of the program limitation of Tradingview.
Usually we use the 5-year median to judge whether the company's stock price has a discount .
Not all stocks are suitable for using PE Band, especially cyclical stocks.
You can also use ROE to determine whether the company is a cyclical stock.
USTS Yield Curve InversionsVisualization of the inverted portions of the USTS yield curve.
Red means that portion of the curve is inverted.
If 1M is red, it means it's less than RRP%.
Psychlogical TP Levels Indicator V 1This indicator works based on the Average True Range and Renko Charts.
The Renko charts are a perfect way to observe the market trend without noise.
From the image below, you can see that as long as the market is bullish, the Renko chart remains green, and when the market turns from bullish to bearish, the Renko chart also changes its direction. As can be seen in the image below
This indicator allows you to view the clear trend in the market.
Inside the indicator's settings, you can change the ATR Period you want. By default, it is set to 14.
Applying the indicator to charts will plot areas of two colours in a separate window. You have to pay attention to when the indicator changes its colour.
An important thing you need to understand is The psychological indicator is not a buy/sell indicator. It means you’ll not use it for opening a buy/sell trade. You’ll use it for Taking Profit levels only.
Here is how you can use the indicator to decide the take profit levels.
You can open your buy trades with any strategy you use. When you open your trade, you should pay attention to the colour or Psychological Indicator. Now, as the market goes up, you should wait for the indicator to turn from green to red, and when that happens, this will signal to close the trade.
Similarly, for short positions, you can open your sell trades with any strategy you use. When you open your trade, you should pay attention to the colour or Psychological Indicator. Now, as the market goes down, you should wait for the indicator to turn from red to green, and when that happens, this will signal to close the trade. Please check the image below.
Master LTCBTC Network Value ModelThe Master LTCBTC Network Value Model takes the following 6 network values for Litecoin. It compares them to Bitcoin's network values to determine a "fair" value based on Litecoin's network usage compared to Bitcoin's.
Please apply on an LTCBTC chart. Use Black Background to view.
This also includes an average of the 6 network metrics and is colored white with a slightly large line width.
New Addresses
Total Addresses
Active Addresses
Total Volume USD
Transaction Count
# of Retail
Master Litecoin Network Value ModelThe Master Litecoin Network Value Model takes the following 6 network values for Litecoin. It compares them to Bitcoin's network values to determine a "fair" value based on Litecoin's network usage compared to Bitcoin's.
Please apply on an LTCUSD chart
This also includes an average of the 6 network metrics and is colored white with a slightly large line width.
New Addresses
Total Addresses
Active Addresses
Total Volume USD
Transaction Count
# of Retail
Quantum Vector AlertsIts the part 2 of Multiple Indicators 50EMA Cross Alerts.
Its more suitable for the seconds chart. Beside, you can use it in higher timeframe.
The input bars length is the sample size that the code will use to trigger all alert. 20 mean 20 bar after the current candle.
When you activate volume alert you can select an amount of volume that when volume cross it you will be notified. The volume of every bar is displayed in the screener below volume.
In the section percentage vector counting the script do the sum of the red vector and green vector and give a ratio. In bullish vector count percentage for alert, you can select the percentage difference that you want to receive an alert. If your sample have 3 red vectors and 7 green vectors you will receive an alert saying that there is an imbalance of 70% showing more green vectors.
You can select a variant of percentage vector. The variant will do a summation of volume. If 1 vector candle is the size of the 3 other vector, they will have the same ponderation.
Normal alert counting count the number of vectors in the bars length. You can count the red and green candle only or add the blue and violet.
Bullish vector count will show a notification when the number of green candle will appear on the chart in the selected length. The same process is valid for bearish vector count. For example, if you want 3 bullish candle in 20 bar. You select bars length 20 and bullish vector count 3.
These alerts are suitable to the hybrid system. Thanks to our teacher Trader Reality and to all the member that contribute to this great discord community.
Outliers Detector with N-Sigma Confidence Intervals (TG fork)Display outliers in either value change, volume or volume change that significantly deviate from the past.
This uses the standard deviation calculation and the n-sigmas statistical rule of significance, with 2-sigma (a value of 2) signifying that the observed value is stronger than 95% of past values, and 3-sigma 98.5% of past values, and so on for higher sigma values.
Outliers in price action or in volume can indicate a strong support for the move, and hence potentially more moves in the same direction in the future. Inversely, an insignificant move is less likely to be supported. And of course the stronger, the more support.
This indicator also doubles as a standard volume indicator if volume is selected as the source, but with the option of highlighting outliers.
Bars below significance can be uncolored (gray) to unclutter the visuals.
Differently to almost all other similar indicators, the background highlighting is dynamical, so that all values will be highlighted differently, not just 2-sigma or 3-sigma, but also 4-sigma, 5-sigma, etc, with a different value of transparency.
The dynamical transparency value can be calculated in two ways: either statically proportionally to the n-sigma but capped at 10-sigma, or either as a ratio relative to the highest observed sigma value over the defined lookback period (default: 300).
If you like this indicator, which is an extension of previously published indicators, please give some love to the original authors:
* tvjvzl :
* vnhilton :
This extension, authored by Tartigradia, extends tvjvzl's indi, implements vnhilton's idea of highlighting the background, and go further by adding dynamical background highlighting for any value of sigma, add support for volume and volume change (VolumeDiff) as inputs, add option to uncolor insignificant bars, allow plotting in both directions and more.
Trend Tracer IndexThis is the first iteration of an effort to make multiple well-known analytical tools collaborate to help give an objective consensus to the current market conditions.
This indicator ONLY works on a 1 Day Bitcoin Chart!
It contains the following indicators:
Puell Multiple (ours: )
Hash ribbons (by capriole_charles: )
Weekly moving average
Logaritmic growth curve (by quantadelic: )
Stock to flow model (ours: )
Each indicator can be viewed one at a time as either an overlay or oscillator version of itself. Make sure to read the tooltip (the little "i") on how to switch between them since you need to manually move it between the oscillator pane and the chart pane.
A global index was added which will take the average of all these indicators to show the final consensus.
You can assign weights to each indicator, this will affect the Global index. They can be viewed as a 0 to 1 or a 0 to 100 scale, it should work the same.
For example if you don't want the stock to flow index as part of your equation leave that at 0, maybe you want the weekly moving average at half it's weight you can put it at 0.5. This way the global index average will primarily be decided by the other 3 indicators, and slightly be affected by the weekly moving average.
There is a table that contains all the index values of each indicator for a quick overview.
Finally, alerts have been added for each indicator and the global index.
I will maintain this indicator with updates and perhaps even add more analytical tools based on any suggestions.
Enterprise Value on Earnings / FCF / FFO Band Enterprise Value per Diluted Share plotted as black line.
Bands start at 5x and stops at 30x, each represents a 5x increment.
Band Options (per Diluted Share, Fiscal Year):
①Free Cash Flow
②Operating Income
③Adjusted Funds from Operations
④Core Earnings
where:
AFfO = FFO - Unusual Income/Expenses + Tax Distortion (dafault 25% tax rate)
Core Earnings = Net Income - Unusual Income/Expenses + Tax Distortion (default 25% tax rate)
These two adjustments are coarse and watered-down, so take them with a grain of salt.
For professional assessments of Core Earnings versus GAAP Earnings you may go to David Trainer at Great Speculations(costs money). I am unaffiliated with these entities.
Tips:
①③ are unapplicable to financials.
③ may work for REIT-like companies whose depreciation is mostly overstated(e.g. hydro-elec utility companies whose dams typically don't wear out in ten years; companies with assets that APPRECIATE in reality but they D&A them anyway).
Probably none works for cyclicals, especially extreme boom-bust cyclicals such as oil, aluminum & shipping etc.
Beware unnaturally low (dividend_payout+buyback)/net_income ratio as some majority shareholders may funnel money to themselves/cronies at the expense of small shareholders.
Disclaimer: Use at your own discretion. No guarantees for any accuracy or usefulness. If you decide to use it, I take no responsibility whatsoever for any consequences. Does not constitute financial advice. Past performance is not Indicative of future results.
S&P 500 Quandl Data & RatiosTradingView has a little-known integration that allows you to pull in 3rd party data-sets from Nasdaq Data Link, also known as Quandl. Today, I am open-sourcing for the community an indicator that uses the Quandl integration to pull in historical data and ratios on the S&P500. I originally coded this to study macro P/E ratios during peaks and troughs of boom/bust cycles.
The indicator pulls in each of the following datasets, as defined and provided by Quandl. The user can select which datasets to pull in using the indicator settings:
Dividend Yield : S&P 500 dividend yield (12 month dividend per share)/price. Yields following June 2022 (including the current yield) are estimated based on 12 month dividends through June 2022, as reported by S&P. Sources: Standard & Poor's for current S&P 500 Dividend Yield. Robert Shiller and his book Irrational Exuberance for historic S&P 500 Dividend Yields.
Price Earning Ratio : Price to earnings ratio, based on trailing twelve month as reported earnings. Current PE is estimated from latest reported earnings and current market price. Source: Robert Shiller and his book Irrational Exuberance for historic S&P 500 PE Ratio.
CAPE/Shiller PE Ratio : Shiller PE ratio for the S&P 500. Price earnings ratio is based on average inflation-adjusted earnings from the previous 10 years, known as the Cyclically Adjusted PE Ratio (CAPE Ratio), Shiller PE Ratio, or PE 10 FAQ. Data courtesy of Robert Shiller from his book, Irrational Exuberance.
Earnings Yield : S&P 500 Earnings Yield. Earnings Yield = trailing 12 month earnings divided by index price (or inverse PE) Yields following March, 2022 (including current yield) are estimated based on 12 month earnings through March, 2022 the latest reported by S&P. Source: Standard & Poor's
Price Book Ratio : S&P 500 price to book value ratio. Current price to book ratio is estimated based on current market price and S&P 500 book value as of March, 2022 the latest reported by S&P. Source: Standard & Poor's
Price Sales Ratio : S&P 500 Price to Sales Ratio (P/S or Price to Revenue). Current price to sales ratio is estimated based on current market price and 12 month sales ending March, 2022 the latest reported by S&P. Source: Standard & Poor's
Inflation Adjusted SP500 : Inflation adjusted SP500. Other than the current price, all prices are monthly average closing prices. Sources: Standard & Poor's Robert Shiller and his book Irrational Exuberance for historic S&P 500 prices, and historic CPIs.
Revenue Per Share : Trailing twelve month S&P 500 Sales Per Share (S&P 500 Revenue Per Share) non-inflation adjusted current dollars. Source: Standard & Poor's
Earnings Per Share : S&P 500 Earnings Per Share. 12-month real earnings per share inflation adjusted, constant August, 2022 dollars. Sources: Standard & Poor's for current S&P 500 Earnings. Robert Shiller and his book Irrational Exuberance for historic S&P 500 Earnings.
Disclaimer: This is not financial advice. Open-source scripts I publish in the community are largely meant to spark ideas that can be used as building blocks for part of a more robust trade management strategy. If you would like to implement a version of any script, I would recommend making significant additions/modifications to the strategy & risk management functions. If you don’t know how to program in Pine, then hire a Pine-coder. We can help!
BTC TOTALVOLUME MOMENTUM: OnchainThis is an indicator for Bitcoin based on on-chain volume. It is important in several ways.
The upward trend of the red line indicates the increase in trading volume and the possibility of an upward trend in the future
The downward trend of the red line indicates a decrease in trading volume and the possibility of a price decrease in the future
The bullish crossover of the red line with the blue line is a confirmation of the bullish trend
A bearish crossover is confirmation of a bearish trend
Financial IndicesThis indicator provides simple table at the top of the screen that shows the most important financial indices
1. Dividend Yield (DY), Fiscal quarter.
2. Earning per Share Growth (EG), Fiscal quarter.
3. Price-to=Book (PB) Ratio, Fiscal quarter.
4. Price-to-Earning (PE) Ratio, Twelve trailing Months.
Debt-to-Equity (D/E) Ratio, Fiscal quarter.
You can configure your preferences regarding the minimum and maximum acceptable values. Also, you can configure the table color of positive values or negative values
PB BandPB Band is a very practical stock selection technique for investors, which can be used to judge whether the company's stock price is currently overvalued or undervalued.
The PB ratio center line of the stock must be set every time the stock is changed because of the program limitation of Tradingview.
Usually we use the 5-year median to judge whether the company's stock price has a discount.
Not all stocks are suitable for using PB Band, especially cyclical stocks.
You can also use ROE to determine whether the company is a cyclical stock.
Bitcoin Miner Extreme SellingThis script is for identifying extreme selling. Judging by the chart, Bitcoin miners often (not always) sell hard for two reasons: to take profit into parabolic price rises, or to stay solvent when the price is very low.
Extreme selling thus often coincides with long-term tops and bottoms in Bitcoin price. This can be a useful EXTRA data point when trying to time long-term Bitcoin spot or crypto equity investment (NOT advice, you remain responsible, etc). The difference between selling measured in BTC and in USD gives a reasonable idea of whether miners are selling to make a profit or to stay solvent.
CREDITS
The idea for using the ratio of miner outflows to reserves comes from the "Bitcoin Miner Sell Pressure" script by the pioneering capriole_charles.
The two request.security calls are identical. Another similarity is that you have to sum the outflows to make it make sense. But it doesn't make much difference, it turns out from testing, to use an average of the reserves, so I didn't. All other code is different.
The script from capriole_charles uses Bollinger bands to highlight periods when sell pressure is high, uses a rolling 30-day sum, and only uses the BTC metrics.
My script uses a configurable 2-6 week rolling sum (there's nothing magical about one month), uses different calculations, and uses BTC, USD, and composite metrics.
INPUTS
Rolling Time Basis : Determines how much data is rolled up. At the lowest level, daily data is too volatile. If you choose, e.g., 1 week, then the indicator displays the relative selling on a weekly basis. Longer time periods, obviously, are smoother but delayed, while shorter time periods are more reactive. There is no "real" time period, only an explicit interpretation.
Show Data > Outflows : Displays the relative selling data, along with a long-term moving average. You might use this option if you want to compare the "real" heights of peaks across history.
Show Data > Delta (the default): Only the difference between the relative selling and the long-term moving average is displayed, along with an average of *that*. This is more signal and less noise.
Base Currency : Configure whether the calculations use BTC or USD as the metric. This setting doesn't use the BTC price at all; it switches the data requested from INTOTHEBLOCK.
If you choose Composite (the default), the script combines BTC and USD together in a relative way (you can't simply add them, as USD is a much bigger absolute value).
In Composite mode, the peaks are coloured red if BTC selling is higher than USD, which usually indicates forced selling, and green if USD is higher, which usually indicates profit-taking. This categorisation is not perfectly accurate but it is interesting insomuch as it is derived from block data and not Bitcoin price.
In BTC or USD mode, a gradient is used to give a rough visual idea of how far from the average the current value is, and to make it look pretty.
USAGE NOTES
Because of the long-term moving averages, the length of the chart does make a difference. I recommend running the script on the longest Bitcoin chart, ticker BLX.
To use it to compare selling with pivots in crypto equities, use a split chart: one BLX with the indicator applied, and one with the equity of your choice. Sync Interval, Crosshair, Time, and Date Range, but not Symbol.
[Antipanicos] Year-over-Year YoY ChangeYear-over-year growth compares a company's recent financial performance with its numbers for the same month one year earlier. This is considered more informative than a month-to-month comparison, which often reflects seasonal trends.
Coin & market cap tableThis table was built specifically for the Crypto market.
It gives you a quick overview of the markets without having to scroll through numerous charts. The information is the overall markets daily change and the charts coins movement on a daily, weekly and monthly basis.
The weeks start on a Monday morning, the months start on the 1st of the month so this is last weeks data and last calendar months data.
It also gives you Bitcoins dominance. (Total2) you can change it to Bitcoin & Ethereum dominance (Total3)
Rule Of 20 - Fair Value Estimation by Inflation & Earnings (TG)The Rule Of 20 is a heuristic calculation to find the fair value of an asset or market given its earnings and current inflation.
Its calculation is straightforward: the fair multiple of the price or price-to-earnings ratio of a stock should be 20 minus the rate of inflation.
In math terms: fair_price-to-earnings_ratio = (20 - inflation) ; fair_value = current_price * fair_price-to-earnings_ratio / real_price-to-earnings_ratio
For example, if a stock or index was trading on 11 times earnings and inflation was 2%, then the theory would be that the fair price-to-earnings ratio would be 20-2 = 18, which is much higher than the real price-to-earnings ratio of 11, and hence the asset would be undervalued.
Conversely, a market or company that was trading on 18 times price-to-earnings ration when inflation was 8% was seen as overvalued, because of the fair price-to-earnings ratio being 20-8=12, hence much lower than the real price-to-earnings ratio of 18.
We can then project the delta between the fair PE and real PE onto the asset's value to obtain the projected fair value, which may be a target of future value the asset may reach or hover around.
For example, as of 1st November 2022, SPX stood at 3871.97, with a PE ratio of 20.14 and an inflation in the US of 7.70. Using the Rule Of 20, we find that the fair PE ratio is 20-7.7=12.3, which is much lower than the current PE ratio of 20.14 by 39%! This may indicate a future possibility of a further downside risk by 39% from current valuation levels.
The origins of this rule are unknown, although the legendary US fund manager Peter Lynch is said to have been an active proponent when he was directing the Fidelity’s Magellan fund from 1977 to 1990.
For more infos about the Rule Of 20, reading this article is recommended: www.sharesmagazine.co.uk
This indicator implements the Rule Of 20 on any asset where the Financials are availble to TradingView, and also for the entire SP:SPX index as a way to assess the wider US stock market. Technically, the calculation is a bit different for the latter, as we cannot access earnings of SPX through Financials on TradingView, so we access it using the QUANDL:MULTPL/SP500_PE_RATIO_MONTH ticker instead.
By default are displayed:
current asset value in red
fair asset value according to the Rule Of 20 in white for SPX, or different shades of purple/maroon for other assets. Note that for SPX there is only one calculation, whereas for other assets there are multiple different ways to calculate earnings, so different fair values can be computed.
fair price-to-earnings ratio (PE ratio) in light grey.
real price-to-earnings ratio in darker grey.
This indicator can be used on SP:SPX ticker, and on most NASDAQ:* tickers, since they have Financials integrated in TradingView. Stocks tickers from other exchanges may not provide Financials data, so this indicator won't work then. If this happens, try to find the same ticker on NASDAQ instead.
Note that by default, only the US stock market is considered. If you want to consider stocks or assets in other regions of the world, please change the inflation ticker to a ticker that reflect the target region's inflation.
Also adding a table to ease interpretation was considered, but then the Timeframe MTF parameter would not work, and since the big advantage of this indicator is to allow for historical comparisons, the table was dropped.
Enjoy, and keep in mind that all models are wrong, but some are useful.
Trade safely!
TG