GVI – Guendogan Valuation IndexGlobalization-adjusted valuation indicator modeling rising international revenue exposure since 1990. Includes a long-term fair-value framework.Pine Script® göstergesiCueneyt_Guendogan tarafından220
Stock Valuation & Analysis (Zeiierman)█ Overview Stock Valuation & Analysis (Zeiierman) is a hybrid fundamental–technical framework that delivers a complete company valuation system directly inside TradingView. Instead of manually digging through years of financial statements, the system automates the full valuation process, allowing traders and investors to understand a stock’s true value, fair price, and risk-adjusted opportunity at a glance. The script projects intrinsic value zones directly onto the price chart, then layers trend structure, signals, and exhaustion regimes around them to create a unified decision-making environment. At its core, the system builds a quantitative valuation backbone using several coordinated models: an adaptive DCF engine that updates fair value based on changing fundamentals sector-aligned valuation models that compare earnings, sales, enterprise value, and book metrics smart handling for unusual balance-sheet structures such as cash-heavy or early-stage companies stabilized value floors based on liquidity and cash-per-share dynamics an automated financial processor that organizes multi-year statements into a consistent valuation framework On top of this valuation, the script overlays: visual valuation zones (Premium, Fair, Discounted, Undervalued) a rolling ZVWAP line showing where trading activity is anchored a multi-mode adaptive trend engine a non-linear signal generator an overbought and oversold regime detector an analyst-consensus summary panel Note: This tool is designed specifically for stocks on the daily timeframe. If used on unsupported markets or timeframes, it will display a clear warning. ⚪ Why This One Is Unique Most valuation tools stop at static multiples or a single DCF pass. This script instead uses a more intelligent, multi-layered valuation architecture that adapts to the underlying asset and market context. It: Uses multiple forms of discounted cash flow analysis and automatically selects the most suitable valuation approach for the stock. When traditional DCF is not optimal, the system applies alternative but comparable valuation methods. This adaptive behavior is the basis for the “Intelligent” designation. Uses valuation multiples as the basis for fair value assessments. Projects valuation into dynamic chart zones that expand or contract relative to your chosen margin of safety, producing premium, fair, discounted, and deeply undervalued bands that evolve as conditions change. Adds a Rolling ZVWAP that adjusts to shifting volume distributions and recent price drift, helping to identify where aggregate positioning and cost basis may be clustering. Includes an adaptive trend core capable of self-tuning across a range of sensitivities, selecting the configuration that historically performed most reliably, and using that as a live trend intelligence layer. Wraps everything in a regime-aware OB/OS engine and a unified alert router, enabling valuation, positioning, trend, and signal events to flow through one consolidated alert stream for simpler automation. █ Main Features ⚪ 1. Dual Valuation Engine With Intelligent Chart Projection The indicator evaluates a company’s fair value using two coordinated valuation models, then projects the result directly onto the price chart as adaptive valuation zones. Intelligent DCF Valuation Engine Builds a forward-looking free-cash-flow profile using earnings power, cash generation, capital intensity, working-capital behavior, and tax structure. It then projects these flows, applies terminal adjustments, and converts the result into an equity fair value. Adaptive Multiples-Based Valuation Tracks the most commonly used valuation metrics. Each metric provides its own fair-value projection, and the engine identifies the one most consistent with the company’s fundamental profile — delivering the best match to intrinsic value. Margin of Safety Control A dedicated slider widens or tightens valuation outcomes based on your preferred risk profile, enabling more conservative or aggressive interpretations with a single adjustment. Dynamic Valuation Zones (Premium → Undervalued) Once the valuation is finalized, the script constructs four intelligent price regions: Premium, Fair Value, Discounted, and Undervalued. These zones scale with your Margin of Safety and are drawn as translucent, forward-projected price bands. The result is a clear, evolving valuation map that updates with each new bar and visually anchors price within its current fundamental context. ⚪ 2. ZVWAP — Zeiierman Volume-Weighted Anchor Price This enhanced VWAP model distinguishes between institutional-style flows and retail-style activity, offering a deeper look into capital positioning. It adapts continuously, revealing where dominant buying or selling pressure may be anchored. Depending on your setting, it can emphasize institutional-style flows or a blend of retail and institutional movement. This line helps you quickly see whether the price is trading above or below the dominant executed volume over the recent window. ⚪ 3. Trend and Price-Movement Intelligence A multi-mode trend engine ensures flexibility and robustness across different trading styles: Intelligent Trend: Runs a series of internal trend models, gauges their historical stability and responsiveness, and automatically promotes the best-performing configuration as the trend line. Percentage Trend: Flips trend when price moves a fixed percentage from a reference, ideal for swing-style regime detection. MA Trend: A classic moving-average trend line that switches bias on crossovers. ⚪ 4. Signal Framework (Buy / Sell / Trend Signals) A dedicated signal engine analyzes price extremes and internal oscillations to produce actionable signals. Frequency settings (Frequent, Quick, Fast, Moderate, Long-Term) determine how selective the engine becomes. Signals can operate independently or in alignment with the active trend filter. ⚪ 5. Overbought / Oversold Regime Zones A volatility-aware OB/OS engine transforms price movement into a smooth internal oscillator. It highlights extended regimes using semi-transparent zones labeled “Overbought” or “Oversold,” expanding and contracting with volatility. Zones automatically clear once conditions normalize, avoiding stale signals. ⚪ 6. Analyst Ratings & Price Target Panel A structured table displays external analyst expectations, including: Highest and lowest price targets Average or consensus rating (Buy, Sell, Weak Buy, Weak Sell, Neutral) Color-graded rating and target fields for immediate clarity This adds an external benchmark to complement the internal valuation system. █ How to Use ⚪ Intrinsic Value Estimation Quickly determine whether a stock is undervalued or overvalued based on DCF and Multiple models. Valuation Models Intelligent DCF: Best for fundamentally driven companies where earnings quality, cash flow, and balance sheet strength matter. Multiple Valuation: Ideal for faster, relative pricing using sector-aware multiples. Risk-Adjusted Investing: Apply the Margin of Safety to find entries that match your preferred risk level. Valuation Zones Premium: Price is above intrinsic value. Common area to lock in gains, tighten stops, or avoid new longs. Fair Value: Neutral territory. Suitable for monitoring or gradual accumulation. Discounted: Below fair value. Potential opportunity zone when trend and technical conditions begin to improve. Undervalued: Deep discount. High-interest area when valuation, trend improvement, oversold conditions, and signals start aligning. ⚪ Professional-Level Price Analysis Use ZVWAP and trend tools to time entries with institutional buying pressure by visualizing where the majority of recent trading volume is anchored. Price above ZVWAP + bullish trend → strong institutional support, trend continuation setups. Price below ZVWAP + bearish trend → strong institutional selling pressure, trend continuation. Price crossings relative to ZVWAP often act as: pullback completion points. early signs of shifting value zones. ⚪ Timing Your Entries 1. Choose a Trend Mode Intelligent Trend: Runs several trend configurations, evaluates their past stability, and selects the most reliable one as the active trend. Percentage Trend: Flips trend only when price moves by a defined percentage. MA Trend: Classic moving average for straightforward trend mapping. 2. Use Signals in Sync With the Trend Set Trend Signals to ensure entries match the active trend: In an uptrend → Long signals highlight continuation setups. In a downtrend → Short signals highlight continuation setups. Adjust frequency based on style: Frequent / Quick for active traders Moderate / Longterm for swing and position traders ⚪ Overbought / Oversold Zones Overbought zones identify where upside movement is stretched, often aligning with Premium or upper Fair Value regions. These areas can signal trend maturity, potential pullbacks, or moments where taking partial profits becomes prudent. Oversold zones highlight areas where downside momentum is becoming exhausted, especially when price is already trading within Discounted or Undervalued valuation regions. These zones can mark early stages of a potential reversal or simply the lower boundary of a strong trend where buyers might step back in. Because both conditions can appear during strong trends, investors should monitor price behavior closely: In strong uptrends, overbought zones can indicate trend strength rather than immediate reversal. Traders may choose to ride the trend while managing risk. In downtrends, oversold zones can serve as continuation points or emerging reversal signals depending on how the price reacts. Both zones can be used as entry or exit timing aids, especially when combined with valuation zones, ZVWAP behavior, and trend direction. ⚪ A nalyst Comparison Use the built-in analyst ratings and target prices to validate or challenge your valuation. When your intrinsic estimate aligns with analyst consensus, conviction strengthens; when it diverges, it highlights potential opportunities or risks worth investigating. █ How It Works ⚪ Intelligent Valuation Uses multiple forms of discounted cash flow analysis and automatically selects the most appropriate valuation approach for each stock. When a traditional DCF is not the best fit, the system switches to alternative but comparable valuation models. This adaptive process is what defines it as an “Intelligent” system. ⚪ Multiples Framework When using multiple-based valuation, the engine evaluates a set of evolving market multiples and aligns them with sector expectations. Historical ranges, peer context, and balance-sheet components help anchor each metric, allowing identical ratios to be interpreted differently across industries. The system then chooses the estimate that best reflects the company and how the market has recently valued similar conditions. ⚪ ZVWAP The Rolling ZVWAP line acts as a dynamic, volume-weighted anchor that reacts to shifts in participation intensity. It highlights where capital is clustering, whether flows lean toward institutional or retail, and how price behaves around these anchor points. This produces a clearer view of positioning pressure and trend strength than traditional VWAP lines. ⚪ Adaptive Trend Framework The trend system provides three complementary modes: Percentage Mode reacts to meaningful percentage-based displacements, MA Mode tracks equilibrium through a moving-average backbone, and Intelligent Trend evaluates multiple internal configurations, promotes the historically most stable one, and uses it as the active trend reference. This multi-engine design ensures that trend direction reflects the most reliable behavior for the current market environment. ⚪ Signal Engine The signal layer continuously interprets price structure, curvature, and momentum to identify high-quality long and short opportunities. Signals can run independently or be filtered through the active trend for cleaner, regime-aligned entries. Frequency modes allow you to tune selectivity from rapid responses to high-conviction, slower-moving signals. ⚪ Overbought / Oversold Regime Zones The OB/OS engine identifies volatility-adjusted exhaustion zones that highlight where price is stretched or depleted. These regions can mark early reversal points, continuation areas in strong trends, or places where investors monitor price closely to decide whether to hold, trim, or add exposure. They integrate naturally with valuation, trend, ZVWAP, and signals to refine timing and risk management. ⚪ Analyst Sentiment The Analyst Ratings layer collects analyst recommendations and target prices, normalizes them into a weighted sentiment index, and displays the result as a color-graded panel. This gives you an immediate sense of how professional research is positioning itself relative to the system’s intrinsic valuation baseline. ----------------- Disclaimer The content provided in my scripts, indicators, ideas, algorithms, and systems is for educational and informational purposes only. It does not constitute financial advice, investment recommendations, or a solicitation to buy or sell any financial instruments. I will not accept liability for any loss or damage, including without limitation any loss of profit, which may arise directly or indirectly from the use of or reliance on such information. All investments involve risk, and the past performance of a security, industry, sector, market, financial product, trading strategy, backtest, or individual's trading does not guarantee future results or returns. Investors are fully responsible for any investment decisions they make. Such decisions should be based solely on an evaluation of their financial circumstances, investment objectives, risk tolerance, and liquidity needs. Pine Script® göstergesiZeiierman tarafından66158
Stock Fundamentals (Zeiierman)█ Overview Stock Fundamentals (Zeiierman) is designed for investors who want a clear, visual, and efficient way to understand a company’s overall fundamental profile directly on the chart. Instead of digging through dozens of ratios or scanning multiple websites, the tool combines fundamental data, price behavior, and analyst expectations into a single intuitive visual system that can be understood at a glance. A multi-axis “fundamental spider chart” presents the company across six core dimensions: value, quality, financial health, future prospects, dividend strength, performance, and volatility behavior. Each axis represents a structural aspect of company quality, allowing you to see strengths, weaknesses, and imbalances in one immediate view. Alongside the spider chart, a compact PE and Return panel shows where current valuation and analyst expectations sit within their historical ranges, giving context for whether the stock is cheap, expensive, stretched, or positioned for growth. The goal is simple: make fundamental analysis accessible, fast, and insightful for every investor, from beginner to advanced. Stock Fundamentals (Zeiierman) transforms dense data into a structured visual profile suited for stocks on the daily timeframe, allowing you to interpret company quality as easily as you read price action. Important: This script is designed for STOCK symbols on the DAILY timeframe. On anything else, it will show an explicit warning instead of a spider chart. ⚪ Why This One Is Unique Most fundamental overlays rely on static ratios or simple tables, but this script takes a far more comprehensive approach. It builds a multi-dimensional scoring system across Value, Health, Future, Dividend, Performance, and Volatility, then maps these dimensions into a geometric spider chart with clearly labeled axes so you can interpret company quality visually rather than through scattered numbers. An Overall Score from 0 to 10 is computed by aggregating these dimensions and is displayed using a smooth gradient from your selected color palette. Performance scoring is based on yearly return statistics such as returns, volatility, Sharpe ratio, max drawdown, and alpha versus a benchmark, giving the score a foundation in real multi-year behavior rather than short-term noise. Dividend quality is evaluated through yield, growth, payout behavior, free-cash-flow coverage, leverage, and the company’s EPS trend, creating a deeper view of dividend strength than raw yield alone. Future expectations are incorporated through a forward-looking model that compares projected earnings and revenue paths to the current price using a nonlinear scoring method. A dedicated PE Sentiment and Return Estimate panel places the stock’s PE, current price, and analyst targets along a graded strip, helping you see valuation and expected upside or downside in a meaningful context. █ Main Features ⚪ 1. Company Overview Score Stock Fundamentals (Zeiierman) evaluates a company across six core dimensions: Value, Health, Future, Dividend, Performance, and Volatility. Each dimension is scored individually and combined into a single Overall Score (0–10) displayed beside the spider chart. The score cell uses a smooth gradient to reflect weak-to-strong company quality at a glance. ⚪ 2. Fundamental spider chart Visualization The individual scores are mapped into a six-axis polygon, known as the fundamental spider chart. Each arm of the spider chart represents one of the core dimensions: Dividend – quality, growth, coverage, and stability Performance – multi-year risk-adjusted returns Volatility – long-term price stability Value – earnings yield, ROIC, and valuation appeal Health – solvency, balance-sheet strength, and overall safety Future – forward growth potential relative to current price The axes extend from weak at the center to strong at the outer boundary, creating a color-filled shape that makes strengths, weaknesses, and imbalances instantly visible. The spider chart and the overall score work together to provide a fast, intuitive snapshot of company fundamentals. ⚪ 3. PE Sentiment Bar A horizontal PE Sentiment bar shows where the company’s current P/E sits within its historical low-to-high range. The bar is color-graded to indicate whether the valuation leans cheap or expensive, with a marker precisely showing today’s position. ⚪ 4. Return Estimate Bar The Return Estimate bar compares the current price against analyst expectations: lowest target highest target average target current price marker A percentage estimate displays potential upside or downside to the average target. The bar is visually graded using the same palette for fast interpretation. █ How to Use ⚪ Quick Stock Screening Investors can rapidly assess company quality before deep research, saving significant time. ⚪ Comparing Opportunities Easily compare two or more companies using their overall scores and key sentiment visuals. ⚪ Portfolio Reassessment Use the Stock Fundamentals to monitor existing holdings and identify potential risks or strong performers. ⚪ Sentiment-Based Entries Combine PE Sentiment and Return Estimate data to evaluate whether a stock is currently undervalued or overextended. █ How It Works ⚪ Fundamental Dimensions and Scoring Stock Fundamentals (Zeiierman) evaluates a company across six primary dimensions: Value, Health, Future, Dividend, Performance, and Volatility. Each dimension is assessed through its underlying behaviors rather than a single ratio, producing a more balanced and realistic view of company strength. Value reflects how attractive the company is relative to its earnings power and capital efficiency. Health measures balance-sheet strength, operational resilience, and the company’s ability to withstand financial stress. Future estimates the growth potential implied by projected business expansion versus current pricing. Dividend evaluates reliability, sustainability, and the stability of historical payouts. Performance summarizes long-term return quality and risk-adjusted behavior. Volatility indicates the consistency of price behavior, highlighting stability versus choppiness. Each category is converted into a normalized score and combined into an overall weighted score (0–10), providing a fast yet reliable snapshot of company quality. ⚪ Value Engine The Value dimension reflects both the company’s earnings attractiveness and how effectively it uses capital. Instead of relying on a single valuation ratio, the engine blends multiple valuation signals with an estimate of capital efficiency, producing a stable value intensity score. This approach rewards companies that combine strong earnings power with efficient capital use, while preventing extreme outliers from dominating. ⚪ Health Engine The Health dimension evaluates how structurally sound the business is. It draws from indicators that capture financial resilience, balance-sheet strength, stability, and operational robustness. For financial institutions or bank-like profiles, the system shifts toward metrics that emphasize asset efficiency and solvency buffers. The result is a single robustness score that adapts to the company’s business model. ⚪ Performance Engine Performance is based on long-term behavior rather than short-term swings. The system evaluates multi-year return characteristics, consistency, risk-adjusted efficiency, and resilience during adverse market periods. Each of these behaviors is transformed into a smooth score, then combined into a single Performance dimension that reflects “quality of returns,” not just raw gains. ⚪ Dividend Engine The Dividend dimension assesses both reward and reliability. It considers payout behavior over several years, historical stability, growth tendencies, coverage strength, and overall sustainability. It also evaluates whether the company’s financial structure supports long-term dividends rather than simply rewarding high yield. All of these factors combine into a dividend score that balances attractiveness with durability. ⚪ Future Growth Engine The Future dimension estimates how well the company’s projected business expansion aligns with current price levels. It builds a simplified projection of growth potential and assesses whether that trajectory reasonably supports the stock’s valuation. The closer the company appears to “growing into” its price, the higher the future score. This dimension effectively acts as a growth runway estimator. ⚪ Volatility Node The Volatility dimension reflects how stable or turbulent the stock has been over a broad timeframe. Its purpose is descriptive rather than judgmental: a high volatility score indicates choppy behavior, while a lower score suggests consistency. Although this measurement is displayed as part of the spider chart, it is intentionally excluded from the Overall Score to avoid penalizing growth-oriented or cyclical companies unfairly. ⚪ PE Sentiment The company’s current P/E ratio is placed within its historical low-to-high range. The panel uses a smooth gradient from “cheap” to “expensive,” with a clear marker showing exactly where today’s valuation sits relative to past conditions. ⚪ Return Estimate Analyst expectations are displayed on a similar range-based strip. Markers show the lowest, highest, and average analyst targets, alongside a marker for the current price. A projected percentage return is calculated relative to consensus expectations, offering a simple visual cue for whether analysts see meaningful upside or downside. ----------------- Disclaimer The content provided in my scripts, indicators, ideas, algorithms, and systems is for educational and informational purposes only. It does not constitute financial advice, investment recommendations, or a solicitation to buy or sell any financial instruments. I will not accept liability for any loss or damage, including without limitation any loss of profit, which may arise directly or indirectly from the use of or reliance on such information. All investments involve risk, and the past performance of a security, industry, sector, market, financial product, trading strategy, backtest, or individual's trading does not guarantee future results or returns. Investors are fully responsible for any investment decisions they make. Such decisions should be based solely on an evaluation of their financial circumstances, investment objectives, risk tolerance, and liquidity needs. Pine Script® göstergesiZeiierman tarafından1199
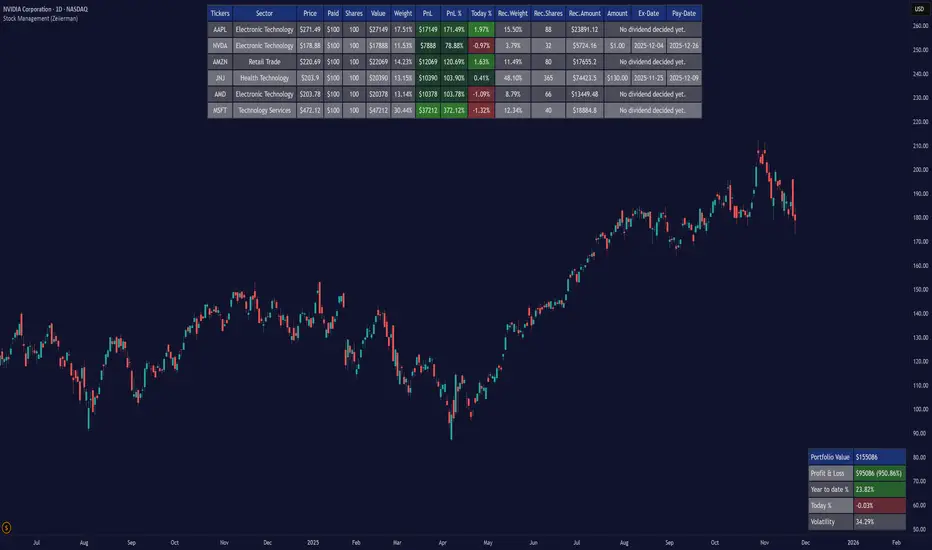
Stock Management (Zeiierman)█ Overview Stock Management (Zeiierman) gives investors a complete, real-time view of their portfolio directly inside TradingView. It tracks performance, allocation, volatility, and dividends in one unified interface, making it easy to understand both how your portfolio is performing and how it behaves in terms of risk and exposure. Rather than analyzing each chart in isolation, Stock Management (Zeiierman) turns TradingView into a lightweight portfolio cockpit. You can define up to 20 stock positions (ticker, shares, average cost), and the tool will: Normalize all positions into a single user-selected currency Calculate live position value, PnL, PnL%, and daily movement Compute total portfolio value, performance, and volatility Optionally generate a risk-parity style Recommended Allocation Display upcoming dividend amounts, ex-dates, and pay-dates for your holdings All of this appears as clean on-chart tables, including a main portfolio table, an optional dividend table, and an optional summary panel, allowing you to manage your portfolio while still watching price action. It is a visual portfolio layer built entirely around your own inputs, integrated seamlessly into the TradingView environment. ⚪ Why This One Is Unique Most investors rely on basic broker dashboards that show position values but provide little insight into risk, exposure, or how each holding interacts with the rest of the portfolio. Stock Management (Zeiierman) goes far beyond that by building an intelligent, unified portfolio layer directly inside TradingView. It automatically normalizes global holdings into a single reporting currency using live FX data, stabilizes allocation with a volatility-aware weighting engine, and structures your information through an adaptive column framework that highlights performance and risk in real time. A weighted summary blends portfolio movement, volatility, and long-horizon behavior into a clean snapshot, while dividend schedules and projected payouts are fully integrated into the same interface. █ Main Features ⚪ 1. Portfolio Tracker The core of Stock Management (Zeiierman) is a dynamic, real-time portfolio table that brings all key position data into one intelligent view. Each holding is displayed with: Ticker Sector Price Average Paid Price Shares Position Value Position Weight Profit & Loss Profit & Loss % Today % Change Recommended Allocation The table updates continuously with market prices, giving investors an immediate understanding of performance, exposure, and risk across all positions. ⚪ 2. Dividend Information Dividend data for your holdings is automatically fetched, organized, and presented alongside your positions. This includes dividend amount, ex-date, and pay-date, along with projected payouts based on your share count. All dividend-related information is integrated directly into the portfolio view, so you can plan cash flow without switching tools. ⚪ 3. Portfolio Summary A dedicated summary panel consolidates the entire portfolio into a single snapshot: total value, total PnL, YTD %, today’s change, and overall volatility. The volatility reading is particularly valuable, providing a quick gauge of your portfolio’s risk level and how sensitive it may be to market movement. ⚪ 4. Portfolio Weight Recommendation An intelligent weighting engine reviews your current allocations and highlights where your portfolio is overexposed or underweighted. It offers recommended allocation levels designed to reduce concentration risk and improve balance, giving you a clearer path toward a more stable long-term positioning. █ How to Use ⚪ Performance Tracking Quickly assess your entire portfolio’s profit, loss, daily movement, and volatility from one centralized dashboard. The summary panel gives you an instant read on how your holdings are performing and how sensitive they are to market swings. ⚪ Dividend Management Monitor upcoming dividend amounts, ex-dates, and pay-dates directly inside your portfolio table. This ensures you never miss a payout opportunity and can plan your expected cash flow with complete clarity. ⚪ Risk Management & Optimization Use portfolio-wide volatility and the intelligent Recommended Allocation engine to identify imbalances in your holdings. These insights help you adjust position sizes, reduce concentration risk, and maintain a more stable long-term portfolio profile. ⚪ Currency Comparison Switch between different base currencies to evaluate performance in local or international terms. All positions are automatically normalized using live FX data, making global portfolio management effortless. █ How It Works Stock Management (Zeiierman) continuously gathers price, currency, dividend, and volatility data for every ticker you track. All values are automatically converted into your selected reporting currency, so global holdings remain comparable in one unified view. It builds a live portfolio snapshot of each bar, updating position values, PnL, daily returns, YTD performance, and overall volatility. This gives you an always-current understanding of how your portfolio is performing and how each holding contributes to risk and exposure. An intelligent, volatility-aware allocation model generates recommended portfolio weights and position sizes, helping you identify where you may be overexposed or underweighted. Dividend information is integrated directly into the table, projecting future payouts and highlighting upcoming ex-dates and pay-dates. ----------------- Disclaimer The content provided in my scripts, indicators, ideas, algorithms, and systems is for educational and informational purposes only. It does not constitute financial advice, investment recommendations, or a solicitation to buy or sell any financial instruments. I will not accept liability for any loss or damage, including without limitation any loss of profit, which may arise directly or indirectly from the use of or reliance on such information. All investments involve risk, and the past performance of a security, industry, sector, market, financial product, trading strategy, backtest, or individual's trading does not guarantee future results or returns. Investors are fully responsible for any investment decisions they make. Such decisions should be based solely on an evaluation of their financial circumstances, investment objectives, risk tolerance, and liquidity needs. Pine Script® göstergesiZeiierman tarafından11113
##Liquidity weighted Supertrend with MA Ribbon by AngelVery useful 2 indicators in 1. 2 liquidity weighted supertrends; all customizable settings to your likings and a 4 ma ribbon. MA 1 and 2 gives you buy/sell signal on the crossover and added a background trend color change for easy visual of price trend! enjoy!Pine Script® göstergesiangel68roa tarafından8
Ultimate Algo ProUltimate Algo Pro एक multi-layered market analysis system है जो price behavior, volatility structure और trend dynamics को combine करके साफ़ तथा actionable trading signals प्रदान करता है। इसका उद्देश्य market conditions को simplify करके traders को स्पष्ट दिशा और disciplined decision-making में मदद देना है। Core Features Market strength और directional shifts को identify करने वाला dynamic signal engine Momentum shifts पर आधारित automatic long/short indications Price structure के अनुसार adaptive zones और reaction levels Volatility को ध्यान में रखकर बनाया गया risk framework, जिसमें automated levels शामिल हैं Trend environment समझने के लिए optimized visual component Compact dashboard जो system status को एक नज़र में दिखाता है Use Case यह system short-term से लेकर medium-term trading तक किसी भी style में इस्तेमाल किया जा सकता है। Script का उद्देश्य ✔ clearer signals ✔ reduced noise ✔ structured trade planning provide करना है ताकि trader को market flow बेहतर समझ आए।Pine Script® göstergesiTradeSnipers tarafından1116
BTC Macro Heatmap (Fed Cuts & Hikes)🔴 1. Red line – Fed Funds Rate (policy trend) This line tells you what stage of the monetary cycle we’re in. Rising red line = the Fed is hiking → liquidity is tightening → money leaves risk assets like BTC. Flat = pause → markets start pricing in the next move (often sideways BTC). Falling = easing / cutting → liquidity returns → bullish environment builds. The rate of change matters more than the level. When the slope turns down, capital starts seeking yield again — BTC benefits first because it’s the most volatile asset. 💚 2. Dim green zones – detected cuts These are data-based easing events pulled directly from FRED. They show when the actual effective rate began moving down, not necessarily the exact meeting day. Think of them as the Fed’s “foot off the brake” — that’s when risk markets begin responding. 🟩 3. Bright green lines – official FOMC cuts These are the real policy shifts — the Fed formally changed direction. After these appear, BTC historically transitions from accumulation → markup phase. Look at 2020: the bright green lines came right before BTC’s full reversal. You’re seeing the same thing now with the 2025 lines — early-stage liquidity return. 🟠 4. Orange line – DXY (US Dollar Index) DXY is your “risk-off” gauge. When DXY rises, global investors flock to dollars → BTC usually weakens. When DXY peaks and starts dropping, it means risk appetite is coming back → BTC rallies. BTC and DXY are inversely correlated about 70–80% of the time. Watch for DXY lower highs after rate cuts — that’s your macro confirmation of a BTC-friendly environment. 🟦 5. Aqua line – BTC (normalized) You’re not looking for the price itself here, but its shape relative to DXY and the Fed line. When BTC curls up as the red line flattens and DXY rolls over → that’s historically the start of a major bull phase. BTC tends to bottom before the first cut and explode once DXY decisively breaks down. 🧠 Putting it together Here’s the rhythm this chart shows over and over: Fed hikes (red line rising) → BTC weakens, DXY climbs. Fed pauses (red line flat) → BTC stops falling, DXY tops. Fed cuts (dim + bright green) → DXY turns down → BTC begins long recovery → bull cycle starts.Pine Script® göstergesiNFA- tarafındanGüncellendi 12
EPS & Sales - MarketSmith/MarketSurge StyleThe EPS & Sales indicator is designed for traders and investors who rely on earnings power and revenue growth as key components of their decision-making process. Inspired by the style and structure of MarketSmith and MarketSurge, this script brings a complete fundamental snapshot directly onto your chart, allowing you to analyze quarterly performance without leaving the TradingView platform. Instead of switching between data sources or relying on disconnected tools, this indicator consolidates multiple layers of information—EPS, sales, estimates, growth rates, surprises, gross margin, ROE, and more—into one integrated visual framework. At the core of the script is its ability to detect each earnings report by observing changes in TradingView’s earnings data. Once an earnings event is identified, the indicator captures the new EPS and sales values, fetches historical data, and organizes it into a structured quarterly timeline. In doing so, it reconstructs up to eight quarters of earnings and revenue progression, letting you follow a company’s financial trajectory at a glance. The script distinguishes between actual EPS and standardized EPS, intelligently compensating for missing data by back-filling where appropriate. This blended approach results in a data representation closer to the conventions used by IBD/MarketSmith. One of the signature components of the indicator is its Weekly Earnings Table. This panel displays EPS values, EPS growth both year-over-year and quarter-over-quarter, EPS surprises relative to analysts’ estimates, and revenue figures scaled dynamically into millions or billions. It also includes sales growth rates, sales surprises, and optional rows for gross margin and return on equity. The table is color-formatted using alternating bands for improved readability, and users may choose between a classic bordered table and a more modern “HeadBand” style. Thematic presets allow the display to mimic either the MarketSmith legacy look or the newer MarketSurge aesthetic. For daily charts, the indicator provides a streamlined HeadBand Table focused on the most recent four quarters. This condensed version shows EPS versus the same quarter a year ago, EPS percentage change, sales and sales growth, and optional ROE or gross margin. It also highlights the next scheduled earnings date, making this tool particularly useful for traders managing risk around upcoming reports. In addition to the tables, the script can annotate the price chart itself. At each earnings bar, it may draw an arrow or numeric label indicating the EPS percentage change, with the option to include sales percentage change as well. These annotations adopt intuitive color coding, using green for positive numbers and red for negative ones, and they follow the same ±999% cap used by MarketSmith to manage extreme values. Users looking for a cleaner chart can disable the arrow graphics entirely and show only the percentage digits. The script also includes a series of safeguards to handle the messy realities of earnings data. It mitigates issues caused by irregular reporting schedules, addresses TradingView data gaps, corrects duplicated values, and handles negative EPS figures with an optional “#” prefix indicating calculations based on negative-to-positive transitions. Users may choose to remove this prefix or force the indicator to always display percentage changes even when the company is unprofitable. Overall, the EPS & Sales indicator is not a trading system but a research and visualization tool. It is built for traders who follow growth-oriented strategies—especially those influenced by CANSLIM or Mark Minervini’s SEPA approach—and who want to see fundamental acceleration alongside price movement. By embedding quarterly financial performance directly into the chart, the script enables faster, more informed analysis and brings the essential components of fundamental evaluation into the heart of technical workflow.Pine Script® göstergesiChonkStocks2005 tarafından14
100+ BTC Tracker + 182-Day Dormant (6-Month HODL)Instantly see what the biggest Bitcoin whales are doing — and exactly how much of the supply has been completely untouched for 6 full months or longer (182+ days), the strictest and most respected definition of true HODLing. What this indicator shows you in real time: Number of wallets holding ≥100 BTC (~15,800 whales) Total Bitcoin controlled by these whales (~3.25 million BTC) 6-Month Dormant Supply — Bitcoin that hasn’t moved in 182+ days (~14.1 million BTC) 6-Month Dormant % — What percentage of circulating supply is truly locked away Why 182 days matters: The 6-month threshold (≈182 days) is the industry-standard cutoff used by Glassnode, CryptoQuant, and analysts worldwide to define ultra-long-term holders. These are the coins least likely to ever hit exchanges — the ultimate measure of conviction and scarcity. Key features:Live or fallback? — Instantly know if you’re seeing real-time on-chain data (green) or verified backup values (yellow) Works on free accounts — No paid data subscription required (though it becomes even more accurate with Glassnode/CryptoQuant add-ons) Clean, non-intrusive design — Three bold plots + sleek dark table in the top-right corner Always up to date — Fallback values manually verified as of November 21, 2025 Perfect for: Spotting whale accumulation/distribution phases Tracking real Bitcoin scarcity during bull or bear markets Confirming long-term holder conviction before big moves Add it to any BTC chart and instantly understand who really controls Bitcoin — and how much of it is locked away forever by the strongest hands in crypto.Pine Script® göstergesibristleconewealth tarafından7
GT3_Trades Sessions Highs & LowsThis indicator automatically identifies and displays the session highs and lows for the three major global market sessions: Asia, London, and New York. It is designed for intraday traders who rely on session-based structure, liquidity levels, and volatility windows. The script dynamically tracks and plots the highest and lowest price reached during each session and extends these levels forward on the chart for strong visual clarity. Key Features Session-Based Highs & Lows Calculates and updates the high and low for each session (Asia, London, New York) in real time as price develops within the session window. Fully Customizable Display Options Traders can individually toggle the visibility of each session’s high and low levels. Line colors, styles (Solid, Dashed, Dotted), and thickness are also user-configurable. Accurate Timezone Handling Session times are defined using user-selected timezone settings (default UTC+3), ensuring session boundaries match the trader’s desired market timing. Automatic Daily Reset At the start of each new trading day, the indicator clears the previous levels and begins tracking fresh highs and lows for the new day. Dynamic Line Drawing Each level is plotted using real Pine Script line objects, which update automatically as new highs or lows form. Once created, each line extends forward to the right—providing clear, persistent references for potential liquidity zones, breakouts, and reversions. Efficient Tracking Logic The script keeps track of the bar index where each high/low occurs and updates the line endpoints in real time. Historical levels are not reused, ensuring clean, uncluttered visuals. How It Helps Traders Identifies liquidity pools and sweep areas based on session extremes. Highlights intraday structure shifts when price breaks or respects session highs/lows. Provides a clear overview of volatility cycles across the global trading day. Helps detect potential reversal or continuation setups when interacting with session boundaries. Ideal For Intraday and scalping strategies ICT-based session analysis Liquidity, sweep, and FVG traders Forex, indices, crypto, and commodities Pine Script® göstergesiGiorgosth3_Trades tarafındanGüncellendi 12
Scalper Pro Pattern Recognition & Price Action📘 Scalper Pro Pattern Recognition & Price Action Overview Scalper Pro is a dynamic multi-layer trend recognition and price action strategy that integrates Supertrend, Smart Money Concepts (SMC), and volatility-based risk control. It adapts to market volatility in real time to enhance entry precision and optimize risk. ⚠️ This script is for educational and research purposes only. Past performance does not guarantee future results. 🎯 Strategy Objectives Detect structural market shifts (BOS / CHoCH) automatically. Identify Order Blocks (OB), Fair Value Gaps (FVG), and key liquidity zones. Plot dynamic Take-Profit (TP) and Stop-Loss (SL) levels based on ATR. Avoid low-volatility (sideways) conditions using ADX filtering. Combine trend-following signals with structural confirmation. ✨ Key Features Supertrend Entry Signals — Generates precise buy/sell markers based on price crossovers with the Supertrend line. Order Block Detection — Automatically plots both Internal and Swing Order Blocks for smart money insights. Fair Value Gap Visualization — Highlights inefficiency zones in bullish or bearish structures. Market Structure Labels — Marks Break of Structure (BOS) and Change of Character (CHoCH) points for clear trend shifts. Dynamic Risk Levels — Automatically generates TP/SL lines and price labels using ATR-based distance. 📊 Trading Rules Long Entry: • Price crosses above the Supertrend (ta.crossover(close, supertrend)) • ADX above sideways threshold (trend condition confirmed) • Optional confirmation from a bullish BOS or CHoCH Short Entry: • Price crosses below the Supertrend (ta.crossunder(close, supertrend)) • ADX above threshold • Optional confirmation from a bearish BOS or CHoCH Exit (or Reverse): • Opposite Supertrend crossover • Price hits TP/SL lines • Trend shift confirmed by internal BOS/CHoCH 💰 Risk Management Parameters Stop Loss & Take Profit based on ATR × risk multiplier ATR Length: 14 (default) Risk %: 3% per trade Sideways Filter: ADX < 15 → no trade zone TP1–TP3 = Entry ± (ATR × 1~3) ⚙️ Indicator Settings Supertrend Module: ATR Length: 10 Factor: nsensitivity × 7 ADX Module: ADX Length: 15 Sideways Threshold: 15 EMA Set: EMA (5, 9, 13, 34, 50) × Volatility Factor (3) SMA Filter: SMA(8) & SMA(9) for short-term trend confirmation Smart Money Concepts Module: Displays BOS/CHoCH, Order Blocks, FVGs, Equal Highs/Lows, and Premium/Discount zones 🔧 Improvements & Uniqueness Integrates Supertrend momentum with Smart Money Concepts (SMC) structural analysis. Dual detection layers: Internal (micro) and Swing (macro) structures. ATR-driven auto labeling for entry, stop, and profit targets. Premium/Discount and Equilibrium zones visualized on the chart. Built-in ADX filter to skip low-trend market conditions. ✅ Summary Scalper Pro Pattern Recognition & Price Action merges classical trend-following with modern market structure analytics. It combines momentum detection, volatility control, and smart money mapping into one cohesive framework. Unified trend, structure, and risk visualization. Auto-marked BOS/CHoCH, OB, FVG, and liquidity zones. Usable for scalping, intraday, or swing trading setups. ⚠️ This strategy is based on historical data and designed for educational use only. Always apply sound risk management and forward testing before live trading.Pine Script® göstergesiPakunFX tarafından2828175
Enhanced ML-FRAMA with HTFCore Concept FRAMA (Fractal Adaptive Moving Average) is an adaptive moving average that automatically adjusts its sensitivity based on market volatility using fractal geometry. This indicator enhances it with Machine Learning predictions and multi-timeframe analysis. Key Components: 1. ML-Enhanced FRAMA ML Enhancement: Uses machine learning to adjust FRAMA's sensitivity Dynamic Adaptation: ML predictions modify the smoothing constant based on market conditions 2. Machine Learning System Three ML Models Combined: K-Nearest Neighbors (KNN): Finds similar historical patterns Trend Model: Uses EMA crossovers for trend detection Momentum Model: Combines RSI, ROC, and volume for momentum Features Used: RSI, MACD, ATR, Rate of Change Volume ratio and momentum VWAP deviation Higher timeframe RSI Daily EMA trend 3. Higher Timeframe Integration HTF1: 1-hour timeframe HTF2: 4-hour timeframe Confluence Trading: Requires agreement across multiple timeframes 4. Visual Features Support/Resistance Circles: Dynamic levels based on ATR volatility Color Coding: Green: Bullish signals Red: Bearish signals Purple/Orange: HTF indicators Trend Detection: Colors change based on direction Requirements for Bullish Signal: Price crosses above ML-FRAMA ML prediction > 60% bullish High confidence (>30%) Volume 20% above average Both HTF timeframes bullish Performance Tracking: Adaptive Weights: Automatically adjusts model weights based on recent accuracy Dynamic K: Adjusts KNN neighbors based on market volatility Outlier Detection: Filters unusual bars from training data Trading Philosophy: Multi-Timeframe Confirmation Avoids false signals by requiring HTF agreement Reduces noise by focusing on higher probability setups Volume Confirmation Requires above-average volume for valid signals Volume momentum adds conviction Machine Learning Edge Learns from historical patterns Adapts to changing market conditions Combines multiple analysis techniques Use Cases: Trend Following: ML-FRAMA as dynamic support/resistance Breakout Trading: Price crosses with volume and HTF confirmation Mean Reversion: Support/resistance circles as reversal zones Swing Trading: HTF confluence for higher probability setups Strengths: Adaptive: Adjusts to market volatility Multi-timeframe: Reduces false signals Volume-confirmed: Adds conviction ML-enhanced: Learns from market behavior Visual: Clear support/resistance levels Ideal For: Swing traders looking for high-probability entries Trend followers wanting adaptive moving averages Technical analysts who value multi-timeframe confirmation Traders who want machine learning without complexity The indicator essentially creates a "smart" adaptive moving average that learns from the market and only provides signals when multiple timeframes and technical factors align. Pine Script® göstergesiakhlaque16g55 tarafından7
Momentum Master v1# Momentum Master v1 - Multi-Strategy Trading System ## SCRIPT OVERVIEW Momentum Master v1 is a multi-strategy trading system that integrates 6 distinct trading methodologies (EMA Crossover, RSI Mean Reversion, Breakout, MACD Crossover, Bollinger Bands, Volume Breakout) through a shared risk management pipeline. This script implements a proprietary integration framework that creates synergistic value beyond what individual indicators provide, combining advanced technical analysis techniques with institutional flow analysis. ## TECHNICAL METHODOLOGY ### Multi-Strategy Signal Generation Framework The script operates on a shared execution framework where all six trading strategies share the same risk management system, but each strategy uses its own unique entry logic: 1. **EMA Crossover System**: Detects momentum shifts using configurable fast/slow EMA periods (Standard 9/21, Fast 7/17, Slow 13/26, or Custom) 2. **RSI Mean Reversion**: Identifies overbought/oversold conditions for counter-trend opportunities 3. **Breakout Detection**: Captures price breakouts from consolidation zones 4. **MACD Crossover**: Uses MACD line crossovers to confirm trend changes 5. **Bollinger Bands**: Trades bounces from band extremes and breakouts 6. **Volume Breakout**: Confirms moves with above-average volume **Why This Integration Creates Unique Value:** This is not a simple indicator mashup. The proprietary integration framework creates synergistic value through: - **Shared Risk Management**: All strategies share ATR-based stop loss calculation and multiple take profit levels (TP1-TP6 with ratios 1:2, 1:4, 1:6, 1:8, 1:10, 1:12) - **Adaptive Confidence Scoring**: The system evaluates market context from multiple perspectives simultaneously - **Shared Filter System**: Optional filters (RSI extremes, ADX trend strength, Volume confirmation, POC proximity) apply uniformly across all strategies ## FLOW ANALYSIS INTEGRATION ### Fair Value Gap (FVG) Retracement Validation The script implements proprietary FVG detection with retracement validation logic: - **200-bar lookback** with **20% ATR tolerance** for gap identification - **Retracement confirmation**: Signals can require price to retrace into a recent FVG before entry (optional filter) - **Size filtering**: Only displays FVGs above minimum ATR threshold (configurable) - **Visual tracking**: Shows last N FVGs with color-coded boxes (bullish green, bearish red) **How FVG Integration Enhances Strategy Signals:** When a strategy generates a signal, the FVG system validates whether price has recently retraced into an institutional order flow gap. This adds a layer of confirmation that the move is supported by institutional activity, not just retail momentum. ### Order Block Detection with Directional Alignment - **Institutional accumulation/distribution zones**: Identifies the last bullish/bearish candle before a significant move - **Directional filter**: Optional setting to only allow trades aligned with the most recent order block direction - **ATR-based size filtering**: Filters out noise by requiring minimum order block size - **Visual display**: Shows order blocks as colored boxes extending N bars forward **Integration Logic:** Order blocks represent areas where institutions accumulated or distributed positions. When a strategy signal occurs near an order block, it indicates higher probability that the move will continue in the block's direction. ### Multi-Timeframe POC (Point of Control) Analysis The script calculates and displays POC levels from multiple timeframes: - **Volume Profile POC**: Highest volume price over last N bars (configurable lookback) - **Session POC**: Point of control for current trading session - **Daily POC**: Daily volume-weighted average price - **Weekly POC**: Weekly volume-weighted average price (optional) **POC Proximity Filtering:** Optional filters allow signals only when price is within X ATR of a POC level. This ensures entries occur at statistically significant price levels where liquidity is concentrated. ## FIBONACCI EXTENSION SYSTEM ### Dynamic Fibonacci Calculation - **Swing-based detection**: Automatically identifies swing highs and lows using configurable lookback period - **Extension levels**: Calculates Fibonacci extension levels (0.618, 0.786, 1.0, 1.272, 1.414, 1.618, 2.0, 2.618) - **Retracement levels**: Shows standard retracement levels (0.236, 0.382, 0.5, 0.618, 0.786) - **Negative levels**: Optional negative Fibonacci levels (-0.27, -0.618) for extended targets **How Fibonacci Enhances Risk Management:** Take profit levels are automatically calculated using Fibonacci extension mathematics. The system identifies the swing structure and projects potential reversal zones, allowing traders to set targets based on mathematical probability rather than arbitrary price levels. ## LIQUIDITY ZONE DETECTION ### Buy and Sell Side Liquidity - **Swing-based liquidity zones**: Identifies recent swing highs (sell-side liquidity) and swing lows (buy-side liquidity) - **Configurable lookback**: Adjustable period for liquidity zone detection - **Visual display**: Horizontal lines extending N bars forward to show liquidity targets - **Maximum zones**: Limits display to most recent N zones to avoid chart clutter **Trading Application:** Liquidity zones represent areas where stop losses are likely clustered. Price often moves to "sweep" these liquidity zones before reversing, creating high-probability entry opportunities. ## RISK MANAGEMENT SYSTEM ### ATR-Based Stop Loss Calculation - **Dynamic stop placement**: Stop loss calculated using ATR (Average True Range) with configurable multiplier - **Adaptive to volatility**: Stop loss automatically adjusts to current market volatility conditions - **Configurable ATR period**: Default 14-period ATR, adjustable from 5-30 periods - **SL multiplier**: Adjustable from 0.5x to 10x ATR for different risk profiles ### Multiple Take Profit Levels The system supports up to 6 take profit levels with fixed risk-reward ratios: - **TP1**: 1:2 risk-reward ratio - **TP2**: 1:4 risk-reward ratio - **TP3**: 1:6 risk-reward ratio - **TP4**: 1:8 risk-reward ratio (optional) - **TP5**: 1:10 risk-reward ratio (optional) - **TP6**: 1:12 risk-reward ratio (optional) **Why Multiple TP Levels:** This allows partial profit-taking at key Fibonacci extension levels while letting winners run. The system tracks win rates for each TP level, helping traders optimize their exit strategy. ## SIGNAL FILTERS (OPTIONAL ENHANCEMENTS) ### RSI Extreme Filter - **Avoid overbought/oversold extremes**: Prevents entries when RSI is in extreme zones (default: >70 overbought, <30 oversold) - **Configurable thresholds**: Adjustable RSI levels and calculation period - **Purpose**: Reduces false signals in exhausted moves ### ADX Trend Strength Filter - **Avoid choppy markets**: Only allows trades when ADX indicates trending conditions (default: ADX > 20) - **Configurable threshold**: Adjustable ADX minimum value (10-50) - **Purpose**: Filters out low-probability trades in ranging markets ### Volume Confirmation - **Volume multiplier**: Requires volume above X times average (default: 1.1x) - **Purpose**: Ensures moves are supported by institutional participation ### POC Proximity Filters - **Volume POC filter**: Only enter when price is near Volume Profile POC - **Session POC filter**: Only enter when price is near Session POC - **Daily POC filter**: Only enter when price is near Daily POC - **Weekly POC filter**: Only enter when price is near Weekly POC - **Proximity threshold**: Configurable ATR multiplier for "near" definition (default: 2.0x ATR) --- ## DIVERGENCE DETECTION ### MFI (Money Flow Index) Divergence - **Bullish divergence**: Price makes lower low, MFI makes higher low (potential reversal up) - **Bearish divergence**: Price makes higher high, MFI makes lower high (potential reversal down) - **Configurable lookback**: Adjustable period for divergence detection (default: 100 bars) - **Minimum bars between divergences**: Prevents duplicate signals (default: 10 bars) - **Advanced thresholds**: Separate thresholds for RSI, price, and MFI divergence strength **Note**: Divergence detection is visual-only and does not filter trades. It provides additional market context for discretionary traders. ## MARKET CONTEXT TOOLS ### Session High/Low Lines - **Recent session extremes**: Displays horizontal lines for session high and low - **Configurable lookback**: Adjustable period for session calculation (default: 10 bars) - **Purpose**: Identifies key intraday support/resistance levels ### Swing Point Detection - **Automatic swing identification**: Marks significant swing highs and lows - **Visual reference**: Helps identify market structure and trend direction ### Signal Overview Table Real-time technical analysis overview: - **Current RSI**: Relative Strength Index value - **ATR**: Current Average True Range - **ADX**: Average Directional Index (trend strength) - **EMA status**: Current fast/slow EMA relationship (Bullish/Bearish/Neutral) - **POC levels**: Current price relative to POC levels - **Confidence score**: Calculated confidence percentage based on confluence - **Volume trend**: Current volume trend direction ## CHART DISPLAY OPTIONS ### Entry/SL/TP Lines - **Visual trade management**: Displays entry price, stop loss, and all take profit levels as horizontal lines - **Configurable length**: Lines extend N bars forward (default: 30 bars) - **Color-coded**: Different colors for entry, stop loss, and each TP level ### Win/Loss Labels - **Trade verification**: Displays up to 500 individual win/loss labels on chart - **Visual feedback**: Green labels for wins, red labels for losses - **Performance tracking**: Helps verify strategy performance visually ## USAGE INSTRUCTIONS ### Initial Setup 1. **Select Strategy Mode**: Choose your preferred trading strategy from the dropdown (EMA Crossover, RSI Mean Reversion, Breakout, MACD Crossover, Bollinger Bands, Volume Breakout, or Disabled) 2. **Configure Risk Management**: - Set ATR Length for stop loss calculation (default: 14) - Set SL ATR Multiplier (default: 1.0) - Enable additional TP levels if desired (TP4-TP6 are optional) 3. **Adjust Strategy Parameters**: Each strategy has its own settings group. Configure EMA periods, RSI settings, MACD parameters, etc., based on your selected strategy. ### Recommended Settings by Market Type **Forex/Crypto (High Volatility)**: - EMA Mode: Fast (7/17) or Custom (3/21) - SL ATR Multiplier: 1.5-2.0 - Enable FVG retracement filter - Enable Order Block directional filter **Stocks (Moderate Volatility)**: - EMA Mode: Standard (9/21) - SL ATR Multiplier: 1.0-1.5 - Enable ADX filter to avoid choppy markets - Enable Volume confirmation **Indices (Lower Volatility)**: - EMA Mode: Slow (13/26) - SL ATR Multiplier: 0.8-1.2 - Enable POC proximity filters - Enable RSI extreme filter ### Advanced Configuration 1. **Enable Optional Filters**: Navigate to "Signal Filters" section and enable filters that match your trading style 2. **Configure Market Analysis Tools**: Adjust FVG, Order Block, Fibonacci, and POC settings in their respective sections 3. **Customize Display**: Toggle chart display options to show/hide various elements based on your preference --- ## WHY THIS INDICATOR COMBINATION CREATES UNIQUE VALUE ### Multi-Layered Confluence Analysis This script is not a simple indicator mashup. It implements a proprietary integration framework that creates synergistic value through three layers of analysis: **Layer 1: Fibonacci Mathematics** - Golden Zone identification (61.8%-78.6% retracement zone) using three-point trend-based calculation - Extension targets based on swing structure mathematics - Statistically significant retracement areas where price is likely to reverse **Layer 2: Institutional Flow Analysis** - Fair Value Gaps (FVGs) identify order flow gaps where price must return - Order Blocks mark institutional accumulation/distribution zones - Multi-timeframe POC analysis shows where liquidity is concentrated - Liquidity zones identify where stop losses cluster **Layer 3: Multi-Strategy Signal Generation** - Six different entry methodologies provide multiple perspectives - Shared risk management ensures consistent position sizing - Adaptive confidence scoring evaluates confluence from all three layers - Optional filters allow customization for different market conditions ### Proprietary Integration Framework The unique value comes from how these components work together: 1. **Strategy generates signal** → 2. **FVG/Order Block validates institutional support** → 3. **POC confirms liquidity level** → 4. **Fibonacci provides target zones** → 5. **Risk management calculates optimal SL/TP placement** This creates a complete trading system, not just a collection of indicators. --- ## TECHNICAL SPECIFICATIONS - **Pine Script Version**: v6 - **Chart Type**: Overlay (displays on price chart) - **Max Bars Back**: 5000 (for historical analysis) - **Max Labels**: 500 (for win/loss tracking) - **Compatibility**: Works on all timeframes and instruments - **Performance**: Optimized for real-time execution --- ## DISCLAIMER This script is a technical analysis tool and does not constitute financial, investment, trading, or other types of advice. Past performance does not guarantee future results. Always use proper risk management and never risk more than you can afford to lose. The script's signals are based on mathematical calculations and should be used in conjunction with your own analysis and risk management practices. --- ## SUPPORT AND ACCESS This is an invite-only script. To request access: 1. Visit: www.pinescriptedge.com 2. Include your TradingView username and brief trading experience 3. Access will be reviewed and granted within 24 hours **Note**: TradingView does NOT recommend paying for or using a script unless you fully trust its author and understand how it works. You may also find free, open-source alternatives in our community scripts. --- ## VERSION INFORMATION **Momentum Master v1** - Initial release with multi-strategy framework and institutional flow analysis integration. For updates and new features, follow the script or check the author's profile for version announcements. Pine Script® göstergesiPineScriptEdge tarafındanGüncellendi 3
Multi-Asset % Performance Table | v2.1 | TCP Multi-Asset % Performance Table | v2.1 | TCP ESSENTIAL SUMMARY: Multi-Asset % Performance Table eliminates the need to manually draw and manage individual "Price Range" tools for every asset. It automatically tracks up to 15 tickers independently in a single dashboard, calculating a TOTAL SCORE (Portfolio Average) for you. Unlike manual drawings, it supports a Global Range while allowing Custom Dates for specific assets, ensuring each ticker is calculated based on its own precise entry/exit. The Smart Visuals dynamically draw the correct date lines only for the ticker you are currently viewing, keeping your chart automatic, accurate, and clutter-free. FUL DESCRIPTION: 📊 What is this tool? The Multi-Asset % Performance Table is a powerful portfolio dashboard designed to track the percentage performance of up to 15 different assets simultaneously. Instead of checking tickers one by one or manually drawing price ranges, this indicator aggregates everything into a single, clean table. It allows you to compare the ROI (Return on Investment) of a basket of coins or stocks over a specific time period and calculates an aggregate TOTAL SCORE (Average %) for your selection. 🚀 Key Features 15 Asset Slots: Monitor up to 15 different tickers (Crypto, Stocks, Forex, etc.) in one view. Global vs. Custom Dates: Set a "Global" start/end date for the whole portfolio, but override specific assets with Custom Dates if they entered the portfolio at a different time. Smart Visuals: Automatically draws vertical dashed lines on your chart representing the start and end dates of the ticker you are currently viewing. Total Score Calculation: Calculates the average percentage change of your portfolio. You can dynamically include or exclude specific assets from this average using the settings. Status Column: A quick visual reference (✔ or ✘) in the table showing which assets are currently included in the Total Score calculation. ⚙️ How it Works Data Fetching: The script pulls "Close" prices from the Daily timeframe to ensure accuracy across long periods. Smart Matching: The visual lines automatically detect which asset you are viewing. For example, if you are looking at BTCUSDT and have custom dates set for it, the vertical lines will jump to those specific dates. If you view a ticker not in your list, it defaults to the Global dates. Visual Protection: The script uses advanced logic to ensure only one set of range lines appears on the chart at a time, keeping your workspace clean. 🛠️ Instructions & Settings 1. Setting up your Assets Open the Settings (Cogwheel icon). Under ASSET 1 through ASSET 15, enter the tickers you want to track (e.g., BINANCE:BTCUSDT). Include in Avg?: Uncheck this if you want to see the asset in the table but exclude it from the "TOTAL SCORE" average. 2. Defining Time Ranges Global Settings: Set the Global Start and Global End dates at the top. This applies to all assets by default. Custom Dates: If a specific asset (e.g., Asset 4) was bought on a different day, check the "Custom Dates?" box for that asset and enter its specific Start/End time. 3. Reading the Table The table appears on the chart (default: Bottom Right) with three columns: Asset: The name of the ticker. % Change: The percentage move from Start Date to End Date. (Green = Positive, Red = Negative). Inc: Shows a ✔ if the asset is included in the Total Score average, or a ✘ if excluded. 4. The Visual Lines Two vertical dashed lines will appear on your chart. Note: These lines are visual references only. You cannot drag them to change the dates. To change the dates, you must use the Settings menu. 💡 Tips Hover for Details: Hover your mouse over the % Change value in the table to see a tooltip showing the exact Start Price and End Price used for the calculation. Resolution: The script defaults to 1 Day resolution for optimal accuracy on historical data. v2.1 | TCP - Custom Built for Precision Performance TrackingPine Script® göstergesiTonyOrso tarafındanGüncellendi 14
Nifty50 Sector Weightage PerformanceNifty50 Sector Weightage Performance is a comprehensive market analysis indicator that visualizes the composition and daily performance of all 15 sectors in the Nifty 50 index. This powerful tool provides real-time insights into sector movements, helping traders and investors identify market trends, understand sector rotation, and make informed trading decisions. The indicator combines sector weightage data with daily percentage changes to calculate a weighted market sentiment score, displayed through an intuitive visual progress bar that indicates whether the market is moving towards bullish or bearish territory. Comprehensive Sector Coverage - Tracks all 15 sectors of the Nifty 50 index. Some broad indices because of request limit on Tradingview. - Displays real-time sector weights and daily percentage changes - Color-coded visualization for quick performance assessment Complete Sector Breakdown 1. Financial Services (36.76%) - Symbol: NSE:BANKNIFTY - Largest sector in Nifty 50 - Uses Bank Nifty index for comprehensive financial sector representation 2. Oil, Gas & Consumable Fuels (10.26%) - Individual Stocks(weighted average): - RELIANCE (8.71%) - ONGC (0.81%) - COALINDIA (0.74%) 3. Information Technology (9.98%) - Symbol: NSE:CNXIT - Represents IT sector performance through CNX IT index 4. Automobile & Auto Components (6.83%) - Individual Stocks (weighted average): - M&M (Mahindra & Mahindra) - 2.77% - BAJAJ_AUTO (Bajaj Auto) - 0.84% - EICHERMOT (Eicher Motors) - 0.79% - MARUTI (Maruti Suzuki) - 1.77% - TATAMOTORS (Tata Motors) - 0.66% 5. Fast Moving Consumer Goods (6.52%) - Symbol: NSE:CNXFMCG - Uses CNX FMCG index for consumer goods sector 6. Telecommunication (4.96%) - Symbol: NSE:BHARTIARTL - Uses Bharti Airtel as representative stock 7. Healthcare (4.27%) - Symbol: NSE:CNXPHARMA - Pharmaceutical sector represented by CNX Pharma index 8. Construction (3.98%) - Symbol: NSE:LT - Uses Larsen & Toubro as representative stock 9. Metals & Mining (3.64%) - Symbol: NSE:CNXMETAL - Metals sector through CNX Metal index 10. Consumer Services (2.63%) - Individual Stocks (weighted average): - ETERNAL (Eternal) - 1.8% - TRENT (Trent) - 0.82% 11. Consumer Durables (2.47%) - Individual Stocks (weighted average): - TITAN (Titan Company) - 1.36% - ASIANPAINT (Asian Paints) - 1.11% 12. Power (2.37%) - Individual Stocks (weighted average): - NTPC (NTPC Limited) - 1.32% - POWERGRID (Power Grid Corporation) - 1.05% 13. Construction Materials (2.07%) - Individual Stocks (weighted average): - ULTRACEMCO (UltraTech Cement) - 1.18% - GRASIM (Grasim Industries) - 0.89% 14. Services (2.00%) - Individual Stocks (weighted average): - INDIGO (Interglobe Aviation) - 1.06% - ADANIPORTS (Adani Ports) - 0.93% 15. Capital Goods (1.28%) - Individual Stock: - BEL (Bharat Electronics) - 1.28% Sector Performance Calculation - Single Index Sectors: Uses direct index/symbol percentage change - Multi-Stock Sectors: Calculates weighted average based on individual stock weights and their percentage changes - Formula: Weighted Average = Σ(Stock Weight × Stock % Change) / Total Sector Weight Data Source Nifty 50 Index: www.niftyindices.comPine Script® göstergesiabhijit2294 tarafındanGüncellendi 3330
TernTable: Crypto SectorsTernTables:CryptoSecs This was hung on my Sector ETFs script to see if I could filter some noise from crypto by applying a GICS (Global Industry Classification Standard) style sector model to the crypto markets. Crypto classification is certainly a little more nuanced so not completely straightforward. It was designed to filter a researched and organised view of generally recognised cryptocurrency sectors and their confirmed constituent components. The main purpose was a shot at displaying live crypto market data on my chart with instantaneous visual analysis, using leader laggard colour logic for performance indication, plus bullish bearish colour logic using the header for instant visual sector strength analysis. This was never going to be an exhaustive tool of course and amazingly only or two of the sector lists wont fit on your laptop screen without zooming but it’s UI versatility both in custom display and custom threshold functionality is very effective. Viewing a coin on your watchlist with its sector overlayed in the chart brings the optional visual alert function into consideration. All basic but all effective and all customisable Can't ignore the educational value either it’s teaching by osmosis what the sectors do and which coins go where clues to why. As an after thought - I added a live stock market filter for 20 sector-specific ETFs like SPY, QQQ, XLV, XLF, allowing the comparison of the live performance of traditional financial sectors to live crypto sector data without leaving your chart. Not certain how often it will need to be updated and any feedback re the legitimacy and accuracy of its components is kindly welcomed it is up to date at date of publishing. It’s pretty easy to use, here is a list what you're getting with sector classifications with brief descriptions CMC 20 CoinMarketCap Top 20: the largest cryptos by market cap. Great starting point to see what the overall market is doing ETFs All major U.S.-listed Bitcoin & Ethereum ETFs. Lets you compare crypto performance directly with traditional finance Layer 0 Foundational interoperability protocols (Polkadot, Cosmos, ICP, etc.). These are the “bridges” that allow different blockchains to communicate Layer 1 Independent base-layer blockchains that run their own consensus and security (Bitcoin, Ethereum, Solana, Cardano, TON, etc.). Layer 2 Scaling networks built on top of Layer 1s to increase speed and lower fees (Arbitrum, Optimism, Base, Polygon, zk-rollups, etc.) Layer 3 Application-specific chains or rollups designed for one purpose (gaming chains, DeFi-specific, social, etc.) Web3 The “ownership internet”: gaming tokens, NFTs, metaverse land, music/streaming platforms, social tokens, and creator-economy projects DeFi Decentralised Finance: lending platforms, decentralized exchanges, derivatives, yield aggregators, and insurance protocols Decentralised Storage Blockchain-based alternatives to AWS/Google Cloud (Filecoin, Arweave, Storj, etc.) Oracles Data providers that feed off-chain information (prices, weather, sports results) into smart contracts Privacy Privacy coins and protocols that obfuscate transaction details (Monero, Zcash, Beam, etc.) Yield & Lending Protocols focused purely on lending, borrowing, and yield generation DEX Pure decentralized exchanges (Uniswap, SushiSwap, Jupiter, GMX, etc.) DAO Governance tokens of major decentralized autonomous organizations (Maker, Lido, Aave, ENS, etc.) Infrastructure / Middleware The picks-and-shovels layer: node services, RPC providers, indexing, cross-chain bridges, etc Real World Assets (RWA) Tokenised traditional assets: treasuries, real estate, private credit, stablecoins backed by real-world collateral Restaking & Liquid Restaking EigenLayer ecosystem and liquid-restaking tokens (eigen, ether.fi, Pendle, etc.). Currently the fastest-growing narrative Traditional Sector ETFs Classic U.S. sector ETFs (SPY, QQQ, XLF, XLE, XLV, XLY, etc.). Extra layer of analysis by comparing live stock market conditions with livecrypto market conditions A list of the UI Toggles * Sector Dropdown • Select Sector: Choose the sector to display (e.g., CMC 20, Layer 1, DeFi, etc.) * Custom Tickers • Enter Tickers: Input custom coin tickers (e.g., BTCUSD, ETHUSD) to track specific assets * Show % Change Row • Toggle On/Off: Display the % change row for each sector/coin * Show Current Price Row • Toggle On/Off: Display the current price for each sector/coin * Show Price-Diff Row • Toggle On/Off: Display the price difference (current price - previous day's price) * Show Spacer Row • Toggle On/Off: Add a spacer row between data rows for clarity * Table Position • Select Position: Choose the position of the data table on your chart (Top Left, Top Right, etc.) Visual Options: * Show Sector Name • Toggle On/Off: Display the sector name pane label on chart * Custom Bull/Bear Threshold • Toggle On/Off: Set a custom threshold for bullish/bearish sector performance • Threshold (%): Set the percentage threshold (e.g., 50%) for bullish/bearish classification * Show Live % in Header • Toggle On/Off: Display the live percentage change in the table header * Dynamic Decimal Formatting • Toggle On/Off: Enable dynamic formatting for numbers display. * Sort by % Change • Toggle On/Off: Sort sectors by % change in performance * Enable Alerts • Toggle On/Off: Enable alerts based on performance thresholds * Alert Threshold (%) • Set Threshold: Define the percentage threshold (e.g.,70%) for triggering alerts * Cooldown (bars) • Toggle On/Off: Enable cooldown to prevent alerts from triggering too quickly • Cooldown Duration: Set the cooldown period in bars (e.g., 10 bars) * % Threshold Mode • Toggle On/Off: Enable % Threshold Mode to filter sectors based on a percentage change threshold • Threshold %: Set the percentage for filtering sectors (e.g., only show sectors with > 5% change) A lot of toggles probably left once favourites are set but this UI interface does allow experimentation with the utility of channelling raw live data through custom designed filters. Just saying ! I need to include this of course This indicator provides sector-based organisation and real-time performance visualisation for cryptocurrencies. It is not intended to predict price movements or guarantee outcomes. Crypto assets carry significant risk, including loss of capital. Past performance does not guarantee future results. All data and sector classifications are best-effort and may be incomplete, inaccurate, or outdated. Nothing in this script should be interpreted as financial advice. You are solely responsible for your own trading decisions. That’s it really, I am currently pleased with how this indicator turned out, if you have a crypto trading toolkit put this in it. Pine Script® göstergesiEdgear tarafındanGüncellendi 4
Nifty Sector Weightage MatrixSector-weighted view of the Nifty 50 index. This script highlights how much each sector contributes to the index along with real-time sector trend. Essential for index traders looking to understand sector impact, rotations, and leadership.Pine Script® göstergesiabhijit2294 tarafındanGüncellendi 1141
Bitcoin vs M2 Global Liquidity (Lead 3M) - Table Ticker═══════════════════════════════════════════════════════════════ Bitcoin vs M2 Global Liquidity - Regression Indicator ═══════════════════════════════════════════════════════════════ TECHNICAL SPECS • Pine Script v6 • Overlay: false (separate pane) • Data sources: 5 M2 series + 4 FX pairs (request.security) • Calculation: Rolling OLS linear regression with configurable lead • Output: Regression line + ±1σ/±2σ confidence bands + R² ticker CORE FUNCTIONALITY Aggregates M2 money supply from 5 central banks (CN, US, EU, JP, GB), converts to USD, applies time-lead, runs rolling linear regression vs Bitcoin price, plots predicted value with confidence intervals. CONFIGURABLE PARAMETERS Input Controls: • Lead Period: 0-365 days (default: 90) • Lookback Window: 50-2000 bars (default: 750) • Bands: Toggle ±1σ and ±2σ visibility • Colors: BTC, M2, regression line, confidence zones • Ticker: Position, size, colors, transparency Advanced Settings: • Table display: R², lead, M2 total, country breakdown (%) • Ticker customization: 9 position options, 6 text sizes • Border: Width 0-10px, color, outline-only mode DATA AGGREGATION Sources (via request.security): • ECONOMICS:CNM2, USM2, EUM2, JPM2, GBM2 • FX_IDC:CNYUSD, JPYUSD (others: FX:EURUSD, GBPUSD) • Conversion: All M2 → USD → Sum / 1e12 (trillions) REGRESSION ENGINE • Arrays: m2Array, btcArray (dynamic sizing, auto-trim) • Window: Rolling (lookbackPeriod bars) • Lead: Time-shift via array indexing (i + leadPeriodDays) • Calc: Manual OLS (covariance/variance), no built-in ta functions • Outputs: slope, intercept, r2, stdResiduals CONFIDENCE BANDS ±1σ and ±2σ calculated from standard deviation of residuals. Fill zones between upper/lower bounds with configurable transparency. ALERTS 5 pre-configured alertcondition(): • Divergence > 15% • Price crosses ±1σ bands (up/down) • Price crosses ±2σ bands (up/down) TICKER TABLE Dynamic table.new() with 9 rows: • R² value (4 decimals) • Lead period (days + months) • M2 Global total (trillions USD) • Country breakdown: CN, US, EU, JP, GB (absolute + %) • Optional: Hide/show M2 details VISUAL CUSTOMIZATION All plot() elements support: • Color picker inputs (group="Couleurs") • Line width: 1-3px • Transparency: 0-100% for zones • Offset: M2 plot has +leadPeriodDays offset option PERFORMANCE • Max arrays size: lookbackPeriod + leadPeriodDays + 200 • Calculations: Only when array.size >= lookbackPeriod + leadPeriodDays • Table update: barstate.islast (once per bar) • Request.security: gaps_off mode CODE STRUCTURE 1. Inputs (lines 7-54) 2. Data fetch (lines 56-76) 3. M2 aggregation (line 78) 4. Array management (lines 84-95) 5. Regression calc (lines 97-172) 6. Prediction + bands (lines 174-183) 7. Plots (lines 185-199) 8. Ticker table (lines 201-236) 9. Alerts (lines 238-246) DEPENDENCIES None. Pure Pine Script v6. No external libraries. LIMITATIONS • Daily timeframe recommended (1D) • Requires 750+ bars history for optimal calculation • M2 data availability: TradingView ECONOMICS feed • Max lines: 500 (declared in indicator()) CUSTOMIZATION EXAMPLES • Shorter lookback (200d): More reactive, lower R² • Longer lookback (1500d): More stable, regime mixing • No bands: Set showBands=false for clean view • Different lead: Test 60d, 120d for sensitivity analysis TECHNICAL NOTES • Manual OLS implementation (no ta.linreg) • Array-based lead application (not plot offset) • M2 values stored in trillions (/ 1e12) for readability • Residuals array cleared/rebuilt each calculation OPEN SOURCE Code fully visible. Modify, fork, analyze freely. No hidden calculations. No proprietary data. VERSION 1.0 | November 2025 | Pine Script v6 ═══════════════════════════════════════════════════════════════ Pine Script® göstergesiAndre_lpz tarafındanGüncellendi 26
Global M2 ex-China MonitorGlobal M2 Monitor - Ultimate Edition 🎯 OVERVIEW Advanced global M2 money supply monitoring indicator, offering a unique macroeconomic view of global liquidity. Real-time tracking of M2 evolution in major developed economies. 📊 KEY FEATURES Global M2 Aggregation : USA, Japan, Canada, Eurozone, United Kingdom Currency Conversion : All data converted to USD for consistent analysis High Resolution Display : Daily curve by default Technical Analysis : 50-period moving average (SMA/EMA/WMA) Accurate YoY Calculation : Annual variation based on monthly data Advanced Signal System : Multi-condition color codes 🎨 COLOR SYSTEM - DEFAULT SETTINGS 🟢 GREEN : YoY ≥ 7% AND M2 ≥ SMA → Strong growth + Bullish momentum 🔴 RED : YoY ≤ 2% AND M2 ≤ SMA → Weak growth + Bearish momentum 🟢 LIGHT GREEN : YoY ≥ 7% BUT M2 < SMA → Good fundamentals, temporarily weak momentum 🔴 LIGHT RED : YoY ≤ 2% BUT M2 > SMA → Weak fundamentals, price still supported 🔵 BLUE : YoY between 2% and 7% → Neutral zone of moderate growth 🇨🇳 WHY IS CHINA EXCLUDED BY DEFAULT? Chinese M2 data presents methodological reliability and transparency issues. Exclusion allows for more consistent analysis of mature market economies. Different M2 definition vs Western standards Capital controls affecting real convertibility Frequent monetary manipulations by authorities ✅ Available option : Can be activated in settings ⚙️ OPTIMIZED DEFAULT PARAMETERS // DISPLAY SETTINGS Candle Period: D (Daily) // MOVING AVERAGE MA Period: 50, Type: SMA // BACKGROUND LOGIC YoY Bullish: 7%, YoY Bearish: 2% SMA Method: absolute, Threshold: 0.2% // COLORS Transparency: 5% China M2: Disabled 📈 RECOMMENDED USAGE Traders : Anticipate sector rotations Investors : Identify abundant/restricted liquidity phases Macro-analysts : Monitor monetary policy impacts Portfolio managers : Understand inflationary pressures 🔍 ADVANCED INTERPRETATION M2 ↗️ + YoY ≥ 7% → Favorable risk-on environment M2 ↘️ + YoY ≤ 2% → Defensive risk-off environment Divergences → Early warning signals for trend changes 💡 WHY THIS INDICATOR? Global money supply is the lifeblood of the financial economy . Its growth or contraction typically precedes market movements by 6 to 12 months. "Don't fight the Fed... nor the world's central banks" 🛠️ ADVANCED CUSTOMIZATION All parameters are customizable: YoY bullish/bearish thresholds SMA comparison method (absolute/percentage) Colors and transparency Moving average period and type Optional China inclusion 📋 TECHNICAL INFORMATION YoY Calculation : Based on monthly data for consistency Sources : FRED, ECONOMICS, official data Updates : Real-time with publications Currencies : Updated exchange rates Pine Script® göstergesiOx_kali tarafındanGüncellendi 25
Fear & Greed Oscillator - Risk SentimentThe Fear & Greed Oscillator – Risk Sentiment is a macro-driven sentiment indicator inspired by the popular Fear & Greed Index , but rebuilt from the ground up using real, market-based economic data and statistical normalization. While the traditional Fear & Greed Index uses components like volatility, volume, and social media trends to estimate sentiment, this version is powered by the Copper/Gold ratio — a historically respected gauge of macroeconomic confidence and risk appetite. 📈 Expansion vs. Contraction Theory At the heart of this oscillator is a simple macroeconomic insight: 🟢 Copper performs well during periods of economic expansion and risk-on behavior (industrials, construction, manufacturing growth). 🔴 Gold performs well during periods of economic contraction , as a classic risk-off, capital-preserving asset. By tracking the ratio of Copper to Gold prices over time and converting it into a Z-score , this tool shows when macro sentiment is statistically stretched toward greed or fear — based on how unusually strong one side of the ratio is relative to its historical average. ⚙️ How It Works The script takes two user-defined tickers (default: Copper and Gold) and calculates their ratio. It then applies Z-score normalization over a user-defined period (default: 200 bars). A color gradient line is plotted: 🔴 Z < -2 = Extreme Fear 🟣 -2 to 0 = Mild Fear to Neutral 🔵 0 to 2 = Neutral to Greed 🟢 Z > 2 = Extreme Greed Visual guides at ±1, ±2, ±3 standard deviations give immediate context. Includes alert conditions when the Z-score crosses above +2 (Greed) or below -2 (Fear). 🔔 Alerts “Z-Score has entered the Greed Zone ” when Z > 2 “Z-Score has entered the Fear Zone ” when Z < -2 These are designed to help catch macro sentiment extremes before or during large shifts in market behavior. ⚠️ Disclaimer This indicator is a macro sentiment tool, not a direct trading signal. While the Copper/Gold ratio often reflects economic risk trends, correlation with risk assets (like Bitcoin or equities) is not guaranteed and may vary by cycle. Always use this indicator in conjunction with other tools and contextual analysis.Pine Script® göstergesiRWCS_LTD tarafından52
Financial Stress Conditions Proxy | QuantLapse📘 Financial Stress Conditions Proxy | QuantLapse Overview: The Financial Stress Conditions Proxy (FSCP) by QuantLapse is a multi-factor quantitative indicator that measures systemic financial stress across key macro and liquidity benchmarks. By blending the High-Yield Spread (BAMLH0A0HYM2), Volatility Index (VIX), Secured Overnight Financing Rate (SOFR), and Reverse Repo Operations (RRPONTSYD) into a unified z-score model, this tool visualizes the market’s underlying tension and relief cycles — conditions often associated with risk-off capitulation and market bottoms. Each component is normalized via a z-score transformation to express how far current readings deviate from historical means, then averaged into a composite “Financial Stress Score.” The result is a dynamic, color-coded column plot that shifts hue as systemic risk compresses or expands. Purpose I built this model to track stress inflection points in the global financial system — particularly to identify moments when macro fear, liquidity withdrawal, and volatility compression converge. These events often precede bottoming phases across risk assets such as equities and crypto. The indicator serves as a quantitative proxy for the psychological extremes of the market: Red tones (high stress): systemic strain, deleveraging, or panic phases — potential long-term opportunity zones. Yellow-green transition: normalization, improving liquidity conditions. Blue-teal range: stability and low-stress periods — often mid-cycle. High Stress zones (Quantitative Tightening) -> Red and Orange Neutral Zones -> Green and Yellow Low Stress Zone (Quantitative Easing) --> Green to Blue How It Works Inputs & Data Sources BAMLH0A0HYM2 → High-Yield Corporate Bond Spread (credit stress). VIX → Implied volatility (equity market fear). SOFR → Funding rate indicator (short-term liquidity). RRPONTSYD → Reverse repo operations (systemic liquidity absorption). Normalization Process Each data stream is smoothed using a user-defined moving average and standard deviation window (default 150 periods). A z-score is computed: 𝑍=𝑋−Mean/Standard Deviation The four z-scores are averaged to produce a single composite stress score. Color Encoding The composite score is segmented into 16 calibrated stress bands (from +1.6 to −1.6). Each band corresponds to a color — red at the top for maximum stress, shifting to bright greens and teals as stress subsides. Colors are assigned dynamically to the plotted columns, creating an intuitive “heat bar” of systemic tension over time. Interpretation Rising, bright red columns: liquidity tightening, macro uncertainty, or panic — potential market bottom zones when fear peaks. Fading yellow → green: stabilization, easing conditions, and early recovery. Cool blue/teal tones: complacency or extended calm — often late-cycle risk. Use the FSCP as a macro overlay, not a direct buy/sell trigger. Its purpose is to provide environmental context — showing when the market is collectively stressed versus when liquidity and confidence return. Trading Applications Bottom Detection: Historically, sustained red/orange conditions have coincided with market capitulation (macro or crypto bottoms). Watch for color transitions from red → orange → yellow as potential recovery signals. Risk Management: Avoid leverage or high exposure when the score is rising rapidly into red zones. Gradually scale exposure as colors normalize. Macro Confirmation Tool: Combine with RSI, breadth indicators, or on-chain data to confirm reversals. Works well on daily or weekly timeframes for swing and position traders. Customization Adjustable lookback periods for mean and standard deviation (default 150). Works on all markets (equities, crypto, forex) since it sources macroeconomic benchmarks directly. Can be layered with volatility or liquidity indicators for confirmation. Why I Built It (originality) Markets bottom when fear meets exhaustion. I wanted a tool that quantified that fear in real-time — not by price patterns, but by systemic stress itself. By merging credit risk, volatility, funding rates, and central bank operations, this model provides a quantitative heartbeat of the financial system — and it visually shows when that heartbeat skips a beat. In my own trading, I use FSCP to identify macro dislocations and liquidity events that typically precede large recoveries. It’s not about prediction — it’s about positioning yourself when the system is stretched too far. Best Practices Use on higher-timeframe charts (D/W) for context. Combine with your technical system for entries/exits. Treat extreme stress as potential accumulation zones, not immediate buy signals. Allow several sessions of color normalization before confirming reversals. Disclaimer This indicator is for educational and research purposes only. It is not financial advice and does not guarantee future results. Always combine with your own analysis and risk controls before trading decisions. Summary The Financial Stress Conditions Proxy translates complex inter-market data into an easy-to-read, color-coded stress bar. It visually captures the emotional and systemic pulse of global markets — helping traders recognize when panic is peaking and opportunity is quietly forming. Use it as your quant compass for navigating bottoms in volatile markets.Pine Script® göstergesiQuantLapse tarafından53
كلاستر Detailed Description – Fibonacci Cluster Zones + OB + FVG (AR34) This script is an advanced multi-layer confluence system developed under the AR34 Trading Framework, designed to identify high-accuracy reversal zones, liquidity imbalances, institutional footprints, and trend direction using a unified analytic engine. It combines Fibonacci mathematics, Smart Money Concepts, market structure, and smart trend signals to produce precise, reliable trading zones. ⸻ 🔶 1 — Fibonacci Retracement Zones + Custom Smart Levels The script calculates the highest and lowest prices over a selected lookback period to generate key Fibonacci retracement levels: • 0.236 • 0.382 • 0.500 • 0.618 • 0.786 • 1.000 You can also add up to three custom Fibonacci levels (0.66, 0.707, 0.88 or any value you want). ✔ Each level is drawn as a horizontal line ✔ Optional label display for every level ✔ Color and activation fully customizable These levels help identify pullback zones and potential turning points. ⸻ 🔶 2 — True Fibonacci Cluster Detection The script automatically identifies Cluster Zones, which occur when: 1. A Fibonacci level 2. An Order Block 3. A Fair Value Gap all overlap in the same price range. When all three conditions align, the script prints a CLUSTER marker in yellow. These zones represent: • High-probability reversal areas • Strong institutional footprints • Highly reactive price levels ⸻ 🔶 3 — Automatic Order Block (OB) Detection The indicator detects Order Blocks based on structural candle behavior: • Bearish candle → followed by bullish • Price interacts with a Fibonacci level • Area aligns with institutional order flow When detected, the OB is marked for easy visualization. ⸻ 🔶 4 — Fair Value Gap (FVG) Mapping The script scans for liquidity imbalances using the classic FVG logic: • low > high When an FVG exists, it draws a green liquidity box. This highlights: • Gaps left by institutional moves • High-value return zones • Efficient price retracement levels ⸻ 🔶 5 — Fibonacci Extension Projections The script calculates extension targets using: • 1.272 • 1.618 • 2.000 These are drawn as dashed teal lines and help forecast: • Breakout continuation targets • Wave extension objectives • Take-profit areas ⸻ 🔶 6 — Smart Trend Signal (EMA-200 Engine) Trend direction is determined using the EMA 200: • Price above EMA → uptrend • Price below EMA → downtrend A green or red signal icon appears only when the trend flips, reducing noise and improving clarity. This helps detect: • Trend shifts early • Cleaner entries and exits • Trend-based filtering ⸻ 🔶 7 — Four-EMA Multi-Trend System The indicator includes optional visualization of four moving averages: • EMA 20 → Short-term • EMA 50 → Medium-term • EMA 100 → Long-term • EMA 200 → Major trend All are fully customizable (length + color + visibility). ⸻ 🔶 8 — Dynamic Negative Fibonacci Levels (Green Only) When enabled, the script calculates deep retracement zones using: • –0.23 • –0.75 • –1.20 These negative Fibonacci levels are drawn in green and help identify: • Deep liquidity capture points • Hidden structural supports • Potential reversal bottoms ⸻ 🔶 9 — Complete User Control Users maintain full control over: ✔ Enabling/disabling OB detection ✔ Enabling/disabling FVG detection ✔ Activating custom Fibonacci levels ✔ Showing or hiding labels ✔ Selecting timeframe for Fib calculations ✔ Adjusting moving average parameters ✔ Activating dynamic Fibonacci The script is designed to be flexible, scalable, and suitable for any trading style. ⸻ 🎯 Summary This indicator is a powerful all-in-one analytical system that merges: ✔ Fibonacci Mathematics ✔ Smart Money Concepts (OB + FVG) ✔ Trend-based filtering ✔ Institutional cluster detection ✔ Dynamic extensions + retracements ✔ Multi-EMA trend mapping شرح السكربت بالتفصيل – Fibonacci Cluster Zones + OB + FVG (AR34) هذا السكربت هو نظام تحليل احترافي متكامل من تطوير AR34 Framework يجمع بين أقوى أدوات التداول الحديثة في مؤشر واحد، ويهدف إلى كشف مناطق الانعكاس القوية، والتجميع الذكي، والاتجاه العام، باستخدام مزيج علمي من فيبوناتشي + السيولة + الاتجاه. يعمل هذا المؤشر بأسلوب Confluence Trading بحيث يدمج عدة مدارس مختلفة في طبقة واحدة لتحديد مناطق الانعكاس والارتداد والاختراق بدقة عالية. ⸻ 🔶 1 — مناطق فيبوناتشي (Retracement) + الكلاستر الذكي يقوم المؤشر بحساب أعلى وأدنى سعر خلال عدد محدد من الشموع (Retracement Length) ثم يرسم مستويات فيبوناتشي الكلاسيكية: • 0.236 • 0.382 • 0.500 • 0.618 • 0.786 • 1.000 مع إمكانية إضافة 3 مستويات خاصة من اختيارك (0.66 – 0.707 – 0.88 وغيرها). ✔️ كل مستوى يتم رسمه بخط مستقل ✔️ يظهر بجانبه رقم المستوى إذا تم تفعيل خيار Show Fib Labels ✔️ يمكن تغيير لونه، قيمته، وتفعيله حسب رغبتك ⸻ 🔶 2 — كاشف الكلاستر الحقيقي (Cluster Detection) الكلاستر يُعتبر أقوى مناطق الارتداد في التحليل الفني. السكربت يحدد الكلاستر عندما تتداخل 3 عناصر مع مستوى فيبوناتشي: 1. مستوى فيبوناتشي مهم 2. Order Block 3. Fair Value Gap إذا اجتمعت الثلاثة في نفس المنطقة، يتم رسمها باللون الأصفر وتظهر كلمة CLUSTER. هذا يعطيك: • أقوى منطقة انعكاس • أعلى دقة في تحديد نقاط الدخول • مناطق ذات سيولة مرتفعة ⸻ 🔶 3 — دمج Order Blocks تلقائياً يكتشف المؤشر الـ OB الحقيقي باستخدام شروط حركة الشموع: • bearish candle → bullish candle • السعر لمس مستوى فيبوناتشي • منطقة محتملة لتجميع المؤسسات إذا تحققت الشروط يظهر OB باللون الأحمر. ⸻ 🔶 4 — دمج Fair Value Gaps (FVG) يكتشف الفجوات السعرية بين الشمعتين الأولى والثالثة: • low > high ويقوم برسم بوكس أخضر حول الفجوة (FVG Zone). يساعدك على معرفة: • مناطق اختلال السيولة • أهداف السعر القادمة • مناطق “العودة” المحتملة ⸻ 🔶 5 — امتدادات فيبوناتشي (Fibonacci Extensions) يقوم بحساب الامتدادات من مستويات: • 1.272 • 1.618 • 2.0 ويظهرها بخطوط متقطعة (Teal Color). هذه المستويات مهمة لتوقع: • أهداف اختراق • مناطق TP • امتداد موجات السعر ⸻ 🔶 6 — إشارة الاتجاه الذكية (Smart Trend Engine – EMA200) يعتمد على EMA 200 لتحديد الاتجاه العام: • إذا السعر فوق EMA200 → اتجاه صاعد • إذا السعر تحت EMA200 → اتجاه هابط ويظهر المؤشر: 🟢 سهم أخضر عند تحول الاتجاه لصعود 🔴 سهم أحمر عند تحول الاتجاه لهبوط ميزة التحول فقط عند تغيير الاتجاه (No Noise). ⸻ 🔶 7 — أربع موفنقات احترافية (EMA 20 – 50 – 100 – 200) المؤشر يعرض الموفنقات الأربعة الأساسية: • EMA 20 → اتجاه قصير • EMA 50 → متوسط • EMA 100 → طويل • EMA 200 → الاتجاه الرئيسي مع إمكانية: • تغيير اللون • تغيير الطول • إخفائها وإظهارها ⸻ 🔶 8 — فيبوناتشي الديناميكي (Dynamic Green Fib) ميزة قوية جداً تظهر فقط عند تفعيلها. تحسب أعلى وأدنى سعر في Lookback Period ثم ترسم مستويات سلبية: • –0.23 • –0.75 • –1.20 هذه المستويات تظهر كخطوط خضراء تحت السعر وتستخدم لـ: • تحديد مناطق الانعكاس المخفية • رصد الدعم الديناميكي • اكتشاف القيعان المحتملة ⸻ 🔶 9 — المرونة الكاملة للمستخدم المؤشر يسمح لك التحكم بكل شيء: ✔️ تفعيل/إلغاء الـ OB ✔️ تفعيل/إلغاء الـ FVG ✔️ تفعيل/إلغاء مستويات فيبوناتشي ✔️ إضافة مستويات مخصصة ✔️ اختيار الفريم المستخدم ✔️ تغيير الألوان ✔️ التحكم في الاتجاه والموفنقات ⸻ 🎯 الخلاصة هذا السكربت يعمل كنظام تحليلي متكامل يجمع: ✔️ فيبوناتشي ✔️ السيولة المؤسسية (OB + FVG) ✔️ الاتجاه الذكي ✔️ الكلاستر الاحترافي ✔️ الموفنقات ✔️ فيبوناتشي الديناميكي Pine Script® göstergesiBuaouf1 tarafından62
Fibonacci Cluster Zones + OB + FVG (AR34)Detailed Description – Fibonacci Cluster Zones + OB + FVG (AR34) This script is an advanced multi-layer confluence system developed under the AR34 Trading Framework, designed to identify high-accuracy reversal zones, liquidity imbalances, institutional footprints, and trend direction using a unified analytic engine. It combines Fibonacci mathematics, Smart Money Concepts, market structure, and smart trend signals to produce precise, reliable trading zones. ⸻ 🔶 1 — Fibonacci Retracement Zones + Custom Smart Levels The script calculates the highest and lowest prices over a selected lookback period to generate key Fibonacci retracement levels: • 0.236 • 0.382 • 0.500 • 0.618 • 0.786 • 1.000 You can also add up to three custom Fibonacci levels (0.66, 0.707, 0.88 or any value you want). ✔ Each level is drawn as a horizontal line ✔ Optional label display for every level ✔ Color and activation fully customizable These levels help identify pullback zones and potential turning points. ⸻ 🔶 2 — True Fibonacci Cluster Detection The script automatically identifies Cluster Zones, which occur when: 1. A Fibonacci level 2. An Order Block 3. A Fair Value Gap all overlap in the same price range. When all three conditions align, the script prints a CLUSTER marker in yellow. These zones represent: • High-probability reversal areas • Strong institutional footprints • Highly reactive price levels ⸻ 🔶 3 — Automatic Order Block (OB) Detection The indicator detects Order Blocks based on structural candle behavior: • Bearish candle → followed by bullish • Price interacts with a Fibonacci level • Area aligns with institutional order flow When detected, the OB is marked for easy visualization. ⸻ 🔶 4 — Fair Value Gap (FVG) Mapping The script scans for liquidity imbalances using the classic FVG logic: • low > high When an FVG exists, it draws a green liquidity box. This highlights: • Gaps left by institutional moves • High-value return zones • Efficient price retracement levels ⸻ 🔶 5 — Fibonacci Extension Projections The script calculates extension targets using: • 1.272 • 1.618 • 2.000 These are drawn as dashed teal lines and help forecast: • Breakout continuation targets • Wave extension objectives • Take-profit areas ⸻ 🔶 6 — Smart Trend Signal (EMA-200 Engine) Trend direction is determined using the EMA 200: • Price above EMA → uptrend • Price below EMA → downtrend A green or red signal icon appears only when the trend flips, reducing noise and improving clarity. This helps detect: • Trend shifts early • Cleaner entries and exits • Trend-based filtering ⸻ 🔶 7 — Four-EMA Multi-Trend System The indicator includes optional visualization of four moving averages: • EMA 20 → Short-term • EMA 50 → Medium-term • EMA 100 → Long-term • EMA 200 → Major trend All are fully customizable (length + color + visibility). ⸻ 🔶 8 — Dynamic Negative Fibonacci Levels (Green Only) When enabled, the script calculates deep retracement zones using: • –0.23 • –0.75 • –1.20 These negative Fibonacci levels are drawn in green and help identify: • Deep liquidity capture points • Hidden structural supports • Potential reversal bottoms ⸻ 🔶 9 — Complete User Control Users maintain full control over: ✔ Enabling/disabling OB detection ✔ Enabling/disabling FVG detection ✔ Activating custom Fibonacci levels ✔ Showing or hiding labels ✔ Selecting timeframe for Fib calculations ✔ Adjusting moving average parameters ✔ Activating dynamic Fibonacci The script is designed to be flexible, scalable, and suitable for any trading style. ⸻ 🎯 Summary This indicator is a powerful all-in-one analytical system that merges: ✔ Fibonacci Mathematics ✔ Smart Money Concepts (OB + FVG) ✔ Trend-based filtering ✔ Institutional cluster detection ✔ Dynamic extensions + retracements ✔ Multi-EMA trend mapping It is ideal for: • Professional traders • SMC / ICT analysts • Day traders and swing traders • Anyone using confluence-based strategies The script provides high-precision reversal zones, trend confirmation, and institutional liquidity mapping — all within a clean and smart visual layout.Pine Script® göstergesiBuaouf1 tarafından58