Function K-Means ClusteringDescription:
A Function that returns cluster centers for given data (X,Y) vector points.
Inputs:
_X: Array containing x data points.¹
_Y: Array containing y data points.¹
_number_of_clusters: number of clusters.
Note:
¹: _X and _Y size must match.
Outputs:
_centers_x: Array containing x data points.
_centers_y: Array containing y data points.
Resources:
rosettacode.org
en.wikipedia.org
Function

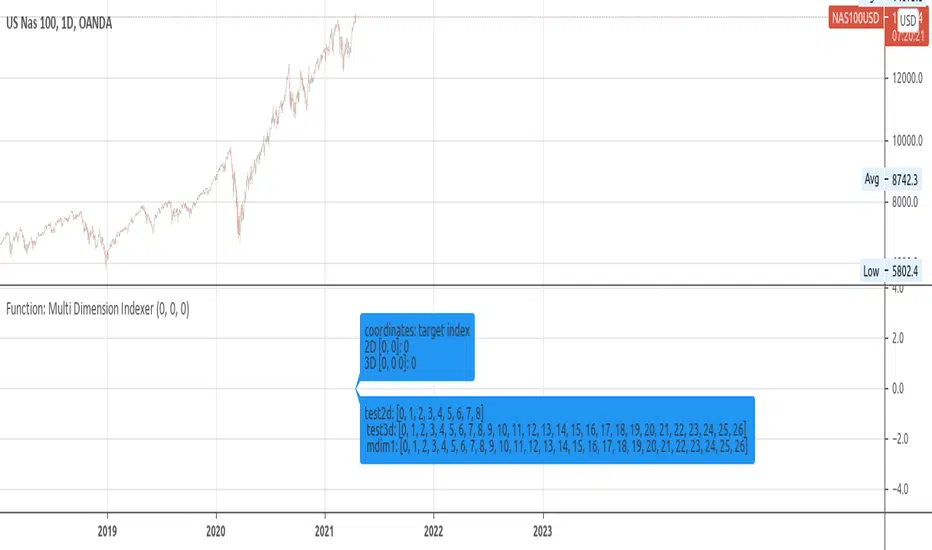
Function: Multi Dimension IndexerDescription:
A Function that returns the flat index of a N dimensions array.
Inputs:
_indices: Array containing dimension indices.¹
_limits: Array containing dimension size.¹
Note:
¹: _indices and _limits size must match. indices must be within dimension size.
Outputs:
_offset: the flat 1D index.
Resources:
eli.thegreenplace.net
[RS]Simple Forecast - Keltner WormsEXPERIMENTAL:
Using keltner channels with automatic multiplier finding, offsets and show_last cutoffs to generate a forecast area.
video showing why its named keltner worms :p..
streamable.com


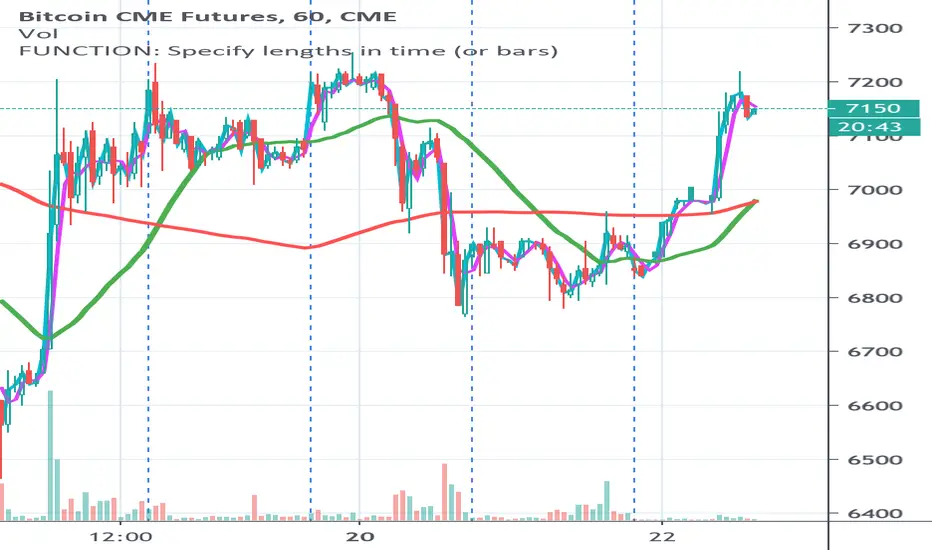
FUNCTION: Specify lengths in time (or bars) This is a function to give measures in time rather than bars...
I often want to measure in things in time rather than bars and change the sample rate (the candle size)
without reconfiguring my settings. This is a handy function for setting you input lengths in time units
(or bars when you want that)
For example
I want a 3 hour moving average, regardless of whether I have 5 minute candles or 30 min candles...
I want a 200 day moving average, regardless of whether I have 1 day or 1 week candles...
This is designed for you to put in your own scripts for your own purpose, but you can use this as is for time constant moving averages
or as an indicator on an indicator.
This shows the same moving averages 45 min / 3 hours in aqua / fuchsia and 1 day / 1 week in red / green
First row: On an extended session chart with 10m, 30m and 60m candles (all of them use the same settings (day length is 16 hours) everything else default.
Second row: On a standard session chart with 10m, 30m and 60m candles (all of them use the same settings everything else default.
Nth-Occurrence Custom barssince() Function by Cryptorhythms [CR]Nth-Occurrence Custom barssince() Function by Cryptorhythms
Description
The vanilla barssince() function in pine only finds the number of bars since the most recent occurrence of the condition. This version allows you to specify an Nth occurrence back to check the bars since! Its also a nice little one liner.
I really hope you enjoy it and if you're looking for more, this is our 79th script on TV, so there is plenty to choose from!
Let me know in the comments if you create anything useful from this or think of anyway to improve it!

[e2] Fibonacci slicerFibonacci slicer function.
The script is a simple calculator that accepts any 2 input values and divides the distance between those values using Fibonacci proportions.
- Easy for script integration (lines 21-35).
- The function accepts any 2 values and their order doesn't matter.
- Correctly divides negative-negative, negative-positive, positive-negative and positive-positive values.
- Calculates 7 levels derived from the Golden ratio (1.618033).

[RS]Example: function instantiationEXPERIMENTAL:
Practical example of how to create a shared function instance.

Early/Delayed Signal FunctionEarly/Delayed Signal Function (before the bar close or after)
Usually, signals are considered to be valid at the bar close .
Some traders may prefer to have a chance to enter earlier .
It is of great risk , and the Strategy Tester is unable to provide consistent backtest data with regards to this.
But for those who want to integrate such a choice in their strategies, here is the Early Signal Function .
The function takes 2 parameters
- the signal that is considered valid at the bar close , of type bool
- the early time value in seconds, the time before the signal is valid, of type int
it returns a value of type bool - a New Entry Signal
The resulting conditions used for alerts would be:
- newLongCondition = earlySignal_f(myLongSignal, earlyTime)
- newShrtCondition = earlySignal_f(myShrtSignal, earlyTime)
Note: the signals can also be delayed - use a negative value for early time

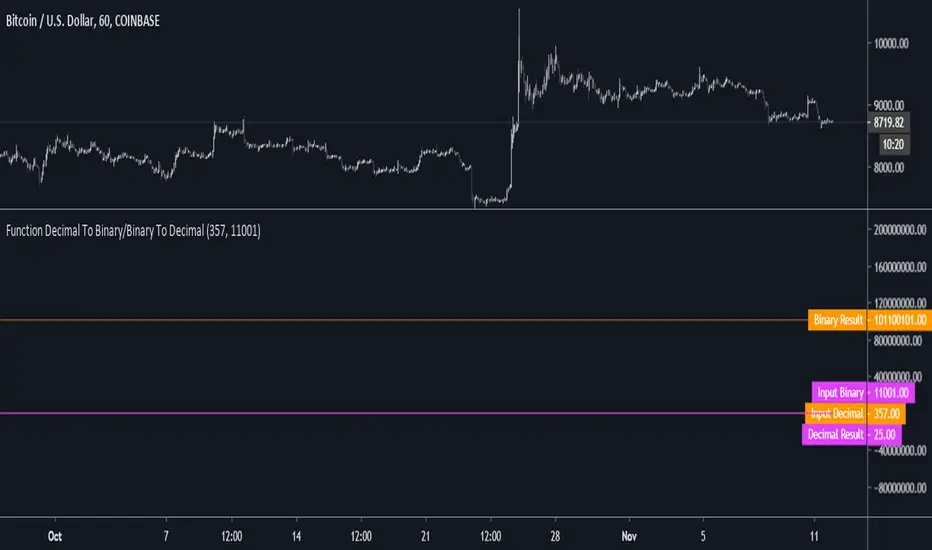
Function Decimal To Binary/Binary To DecimalNOTE: Experimental. Pinescript implementation of Decimal to Binary and Binary to Decimal that is intended for use in the development of a neural network proof of concept.
Intended for use in as subcomponent in the development of a more complex/highly experimental prototype.
Protection/logic for edge cases above 11111111/255 (8bits) is NOT implemented.
Do NOT use this in any trading system or component without edge case testing/unit tests.
// Decimal to Binary, Binary to Decimal Reference:
// diwasfamily.com
// www.wikihow.com
//
// www.khanacademy.org
Function : Stochastic Money Flow IndexThis function is similar to the stochastic rsi function.
The only difference is that Money Flow Index is used instead of rsi.
Oversold and overbought values were changed to 80 and 20.
Because the MFI's overbought and overbought zones are 20 and 80.
In MFI, I think that it can be more beneficial in liquid markets than stochastic rsi since volume is taken into account in contrast to RSI.
Regards.

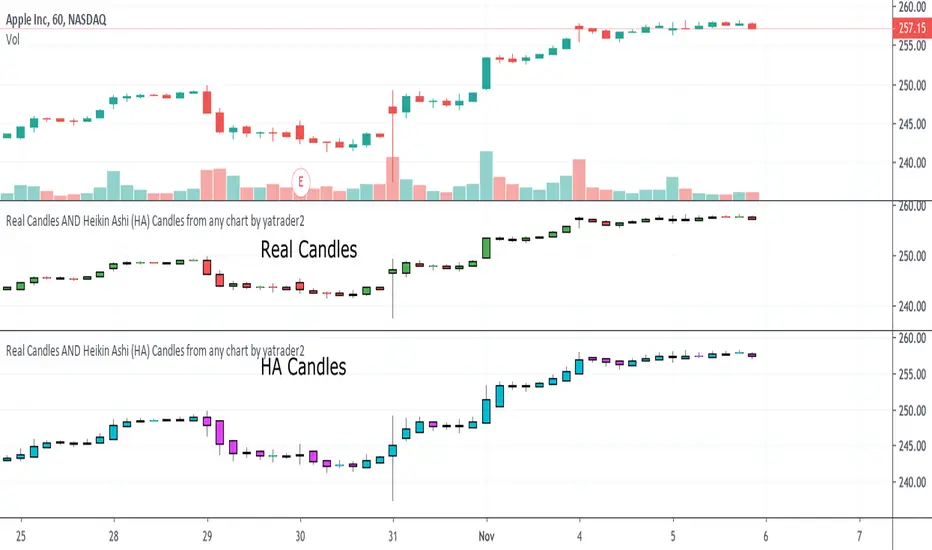
Real Candles Heikin Ashi (HA) Candle functionsThis script plots both real and HA candles regardless or which are used on the chart in TV settings.
(and has the functions for you to use.)
Lots of people seem to misunderstand backtesting (or scam people) based on HA candles.
Backtesting with HA candles leads to impossible trades. ALWAYS backtest with real candles.
That doesn't mean you might not want to look at HA candle values to make trading decisions.
Add the code below to calculate HA candles from real and use that in your HA trading algo,
but test it on real charts.

Scripting Tutorial 8 - Triple Many Moving Averages RibbonsThis script is for a triple moving average indicator where the user can select from different types of moving averages, price sources, lookback periods and resolutions.
Features:
- 3 Moving Averages with variable MA types, periods, price sources, resolutions and the ability to disable each individually
- Crossovers are plotted on the chart with detailed information regarding the crossover (Ex: 50 SMA crossed over 200 SMA )
- Forecasting available for all three MAs. MA values are forecasted 5 values out and plotted as if a continuation to the MA.
- Forecast bias also applies to all forecasting. Bias means we can forecast based on an anticipated bullish, bearish or neutral direction in the market.
- To understand bias, please read the source code, or if you can't read the code just send me a message on here or Twitter. Twitter should be linked to my profile.
- Ribbons added and on by default. Optional setting to disable the ribbons. 5 ribbons between MA1 and MA2 and another 5 between MA2 and MA3.
- Ribbons are alpha-color coded based on their relation to their default MAs.
- Ribbons are only visible between MAs if the MAs being compared share the same Type, Resolution, and Source because there is no way to consolidate those three in a simple manner.
- Ribbon values are calculated based on calculated MA Periods between the MAs.
This script is meant as an educational script with well-formatted styling, and references for specific functions.

Number of digits before and after the decimal point - FunctionFunction - Number of digits before and after the decimal point
Detect the number of digits in integers and floats, before the decimal and after it.
It also works for negative numbers.
There are some rounding issues, but the currently maximum supported number can have safely up to 3 digits after the decimal point.

Symbol Name Prefix Function()Symbol Name Prefix Function()
Function to detect the Symbol name prefix on the current chart.
The prefix is returned as string.

Function - Number of Digits in integerA improvement to previous script:
This uses a algorithmic approach for calculating the digits in a integer.

Function call bugThis is a code to showcase a function call bug in PineScript.
Problem description:
When a function is called from inside of if-then scope, this function may return an invalid result.
Code description:
Two identical code pieces are used to perform simple calculation. The only difference is that one piece has a part of its code wrapped into a function.
Expected result:
All green and red crosses should appear on the same candles. These crosses are calculated by identical code.
Actual result:
Some red crosses appear on the candles they should not appear on.

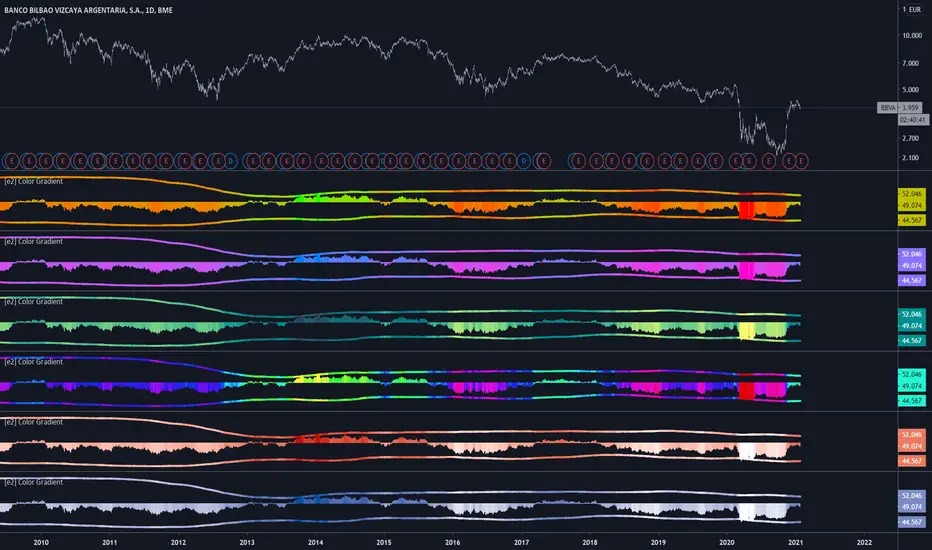
[e2] Color Gradient Function20 step red/green gradient function
The color gradient function allow colorize any source in 5% steps.
Define the source, minimum and maximum value (constant or , for example, bb (or any other channel)).
Function : Stochastic Oscillator Here is the Stochastic Oscillator function.
Now you can easily use length with mutable variables !!

Function : Relative Strength Index The relative strength index function is defined.
Now you can easily use length with mutable variables !!

Smart labelling - Candlestick FunctionOftentimes a single look at the candlestick configuration happens to be enough to understand what is going on. The chandlestick function is an experiment in smart labelling that produces candles for various time frames, not only for the fixed 1m, 3m , 5m, 15m, etc. ones, and helps in decision-making when eye-balling the chart. This function generates up to 12 last candlesticks , which is generally more than enough.
Mind that since this is an experiment, the function does not cover all possible combinations. In some time frames the produced candles overlap. This is a todo item for those who are unterested. For instance, the current version covers the following TFs:
Chart - TF in the script
1m - 1-20,24,30,32
3m - 1-10
5m - 1-4,6,9,12,18,36
15m - 1-4,6,12
Tested chart TFs: 1m, 3m ,5m,15m. Tested securities: BTCUSD , EURUSD
