PopGun Detector – Trigger + 5. CandleSimple module for the popguns.
It detects PGs, marks them (trigger points), and shows the 5th candle.
This way, you don’t have to search for a long time in the chart – you can easily go through the different timeframes and specifically look for the popguns.
Forecasting

RS Rating Vietnam - IBD Style (AlphaStock Edition)Description: This implies the Relative Strength (RS) Rating specifically optimization for the Vietnam Stock Market, inspired by Investor's Business Daily (IBD) methodology.
How it works: Unlike the standard RSI (which measures internal momentum), this RS Rating compares a stock's performance against a benchmark index (Reference Index: VNMIDCAP or VNINDEX) over the last 12 months.
Calculation Formula: The rating is based on weighted performance (ROC):
40% weight: Latest 3 months (1 Quarter)
20% weight: 6 months
20% weight: 9 months
20% weight: 12 months
Features:
Auto-Scaling RS Line: The line automatically adjusts to fit the price chart, removing the need for manual fixed scales.
Benchmark Comparison: Compares stock Alpha vs. VNMIDCAP (default) to detect leaders even when the general market is skewed by large-cap stocks.
Color Coded:
Purple: Rating > 90 (Strong Buy/Leader)
Green: Rating > 80
Yellow: Rating > 60
Red: Rating < 60
Smart Display: Shows historical Rating values in the Data Window when hovering over past candles.
Credits: Designed by Admin AlphaStock.
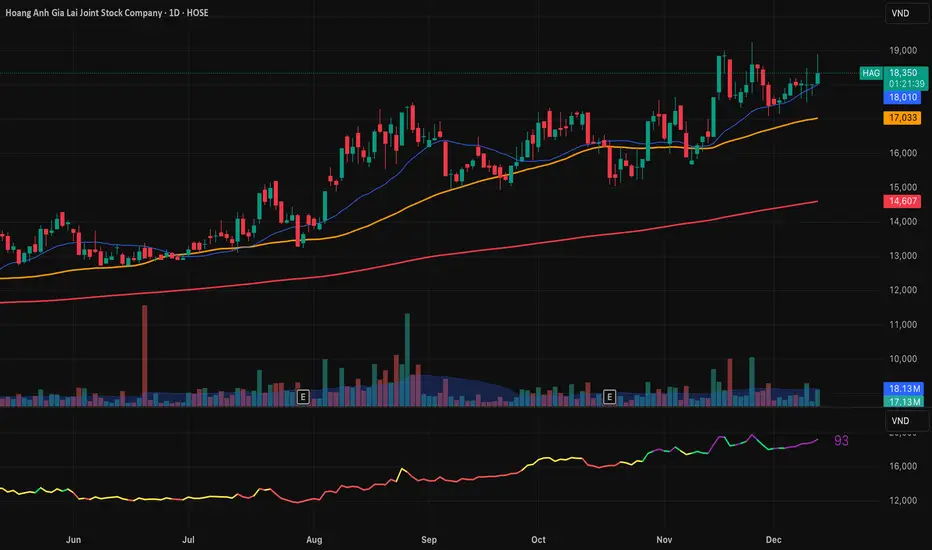
RS Rating Viet Nam by Admin AlphaStockSo sanh vs VNMIDCAP
Bạn có thể thay đổi BenchMark trong Code thành VNINDEX hay bất kỳ chỉ số nào

Stochastic RSI Forecast [QuantAlgo]🟢 Overview
The Stochastic RSI Forecast extends the classic momentum oscillator by projecting potential future K and D line values up to 10 bars ahead. Unlike traditional indicators that only reflect historical price action, this indicator uses three proprietary forecasting models, each operating on different market data inputs (price structure, volume metrics, or linear trend), to explore potential price paths. This unique approach allows traders to form probabilistic expectations about future momentum states and incorporate these projections into both discretionary and algorithmic trading and/or analysis.
🟢 How It Works
The indicator operates through a multi-stage calculation process that extends the RSI-to-Stochastic chain forward in time. First, it generates potential future price values using one of three selectable forecasting methods, each analyzing different market dimensions (structure, volume, or trend). These projected prices are then processed through an iterative RSI calculation that maintains continuity with historical gain/loss averages, producing forecasted RSI values. Finally, the system applies the full stochastic transformation (calculating the position of each forecasted RSI within its range, smoothing with K and D periods) to project potential future oscillator values.
The forecasting models adapt to market conditions by analyzing configurable lookback periods and recalculating projections on every bar update. The implementation preserves the mathematical properties of the underlying RSI calculation while extrapolating momentum trajectories, creating visual continuity between historical and forecasted values displayed as semi-transparent dashed lines extending beyond the current bar.
🟢 Key Features
1. Market Structure Model
This algorithm applies price action analysis by tracking break of structure (BOS) and change of character (CHoCH) patterns to identify potential order flow direction. The system detects swing highs and lows using configurable pivot lengths, then analyzes sequences of higher highs or lower lows to determine bullish or bearish structure bias. When price approaches recent swing points, the forecast projects moves in alignment with the established structure, scaled by ATR (Average True Range) for volatility adjustment.
Potential Benefits for Traders:
Explores potential momentum continuation scenarios during established trends
Identifies areas where structure changes might influence momentum
Could be useful for swing traders and position traders who incorporate structure-based analysis
The Structure Influence parameter (0-1 scale) allows blending between pure trend following and structure-weighted forecasts
Helps visualize potential trend exhaustion through weakening structure patterns
2. Volume-Weighted Model
This model analyzes volume patterns by combining On-Balance Volume (OBV), Accumulation/Distribution Line, and volume-weighted price returns to assess potential capital flow. The algorithm calculates directional volume momentum and identifies volume spikes above customizable thresholds to determine accumulation or distribution phases. When volume indicators align directionally, the forecast projects stronger potential moves; when volume diverges from price trends, it suggests possible reversals or consolidation.
Potential Benefits for Traders:
Incorporates volume analysis into momentum forecasting
Attempts to filter price action by volume support or lack thereof
Could be more relevant in markets where volume data is reliable (equities, crypto, major forex pairs)
Volume Influence parameter (0-1 scale) enables adaptation to different market liquidity profiles
Highlights volume climax patterns that sometimes precede trend changes
Could be valuable for traders who incorporate volume confirmation in their analysis
3. Linear Regression Model
This mathematical approach applies least-squares regression fitting to project price trends based on recent price data. Unlike the conditional logic of the other methods, linear regression provides straightforward trend extrapolation based on the best-fit line through the lookback period.
Potential Benefits for Traders:
Delivers consistent, reproducible forecasts based on statistical principles
Works better in trending markets with clear directional bias
Useful for systematic traders building quantitative strategies requiring stable inputs
Minimal parameter sensitivity (primarily controlled by lookback period)
Computationally efficient with fast recalculation on every bar
Serves as a baseline to compare against the more complex structure and volume methods
🟢 Universal Applications Across All Models
Each forecasting method projects potential future stochastic RSI values (K and D lines), which traders can use to:
▶ Anticipate potential crossovers: Visualize possible K/D crosses several bars ahead
▶ Explore overbought/oversold scenarios: Forecast when momentum might return from extreme zones
▶ Assess divergences: Evaluate how oscillator divergences might develop
▶ Inform entry timing: Consider potential points along the forecasted momentum curve for trade entry
▶ Develop systematic strategies: Build rules based on forecasted crossovers, slope changes, or threshold levels
▶ Adapt to market conditions: Switch between methods based on current market character (trending vs range-bound, high vs low volume)
In short, the indicator's flexibility allows traders to combine forecasting projections with traditional stochastic signals, using historical K/D for immediate reference while considering forecasted values for planning and analysis. As with all technical analysis tools, the forecasts represent one possible scenario among many and should be used as part of a broader trading methodology rather than as standalone signals.

Granger Causality Flow IndicatorGranger Causality Flow Indicator
█ OVERVIEW
The Granger Causality Flow Indicator is a statistical analysis tool designed to identify predictive relationships between two assets (Symbol X and Symbol Y). In econometrics, "Granger Causality" does not test for actual physical causation (e.g., rain causes mud); rather, it tests for predictive causality .
This script is designed to answer a specific question for traders: "Does the past price action of Asset X provide statistically significant information about the future price of Asset Y, beyond what is already contained in the past prices of Asset Y itself?"
This tool is particularly useful for Pairs Traders , Arbitrageurs , and Macro Analysts looking to identify lead-lag relationships between correlated assets (e.g., BTC vs. ETH, NASDAQ vs. SPY, or Gold vs. Silver).
█ CONCEPTS & CALCULATIONS
To determine if Symbol X "Granger-causes" Symbol Y, this script utilizes a variance-reduction approach based on Auto-Regressive (AR) models. Due to the runtime constraints of Pine Script™, we employ an optimized proxy for the standard Granger test using an AR(1) logic (looking back 1 period).
The calculation performs a comparative test over a rolling window (Default: 50 bars):
The Restricted Model (Baseline):
We attempts to predict the current value of Y using only the previous value of Y (Auto-Regression). We measure the error of this prediction (the "Residuals") and calculate the Variance of the Restricted Model (Var_R) .
The Unrestricted Model (Proxy):
We then test if the past value of X can explain the errors made by the Restricted Model. If X contains predictive power, including it should reduce the error variance. We calculate the remaining Variance of the Unrestricted Model (Var_UR) .
The GC Score:
The script calculates a score based on the ratio of variance reduction:
Score = 1 - (Var_UR / Var_R)
If the Score is High (> 0) : It implies that including X significantly reduced the prediction error for Y. Therefore, X "Granger-causes" Y.
If the Score is Low or 0 : It implies X added no predictive value.
█ HOW TO USE
This indicator is not a simple Buy/Sell signal generator; it is a context filter for cross-asset analysis.
1. Setup
Symbol 1 (X): The potential "Leader" (e.g., BINANCE:BTCUSDT).
Symbol 2 (Y): The potential "Follower" (e.g., BINANCE:ETHUSDT).
Differencing: Enabled by default. This checks the changes in price rather than absolute price, which is crucial for statistical stationarity.
2. Interpreting the Visuals
The script changes the background color and displays a table to indicate the current flow of causality:
Green Background (X → Y): Symbol 1 is leading Symbol 2. Price moves in Symbol 1 are statistically likely to foreshadow moves in Symbol 2.
Orange Background (Y → X): Symbol 2 is leading Symbol 1. The relationship has inverted.
Blue Background (Bidirectional): Both assets are predicting each other (tight coupling or feedback loop).
Gray/No Color: No statistically significant relationship detected.
3. Trading Application
Trend Confirmation: If you trade Symbol Y, wait for the background to turn Green . This indicates that the "Leader" (Symbol X) is currently exerting predictive influence, potentially making trend-following setups on Symbol Y more reliable.
Divergence Warning: If you are trading a correlation pair and the causality breaks (turns Gray), the correlation may be weakening, signaling a higher risk of divergence.
█ SETTINGS
Symbol 1 (X) & Symbol 2 (Y): The two tickers to analyze.
Use Differencing: (Default: True) Converts prices to price-changes. Highly recommended for accurate statistical results to avoid spurious regression.
Calculation Window: The number of bars used to compute the variance and coefficients. Larger windows provide smoother, more stable signals but react slower to regime changes.
Significance Threshold: (0.01 - 0.99) The minimum variance reduction score required to trigger a causal signal.
█ DISCLAIMER
This tool provides statistical analysis of historical price data and does not guarantee future performance. Granger Causality is a measure of predictive capability, not necessarily fundamental causation. Always use appropriate risk management.

HRESH SNIPER PRO - V77🦅 HRESH SNIPER PRO V77: High-Precision Visual AidThis indicator is a powerful, proprietary tool designed for extreme accuracy by identifying high-momentum entries. HRESH PRO prioritizes quality over quantity, delivering clean signals that are highly responsive to market structure.🎯 Operational Constraints (Strict adherence is mandatory)FeatureRequirementNotesAssetSTRICTLY BTC/USDTThe indicator's specialized calibration requires focused operation exclusively on Bitcoin's market profile.Timeframe1-Minute (1M)Designed for scalping and precision entry timing.RiskUSER'S SOLE RESPONSIBILITYRISK IS ENTIRELY YOUR RESPONSIBILITY. This indicator is a technical aid; it is not a prediction tool or financial advice.✨ Signal Presentation & LogicThe HRESH PRO system uses a sophisticated process to confirm high-quality entries, focusing entirely on a clean visual hierarchy to maintain continuous trend information:Primary Entry Label (SNIPER): The large "SNIPER" label is reserved for initiating a new sequence or major re-entry. It appears at the start of a trend or when a new powerful impulse occurs after a 7-hour time lapse, confirming a renewed opportunity.Continuation Feedback: To avoid repeating large labels, all subsequent confirmed entries are marked by Small, Color-Coded Diamonds/Dots. These marks visually validate the ongoing trend direction without cluttering the chart.Neon Bar Coloring: Price bars are colored strongly (Neon Lime/Red) throughout the active signal sequence for immediate visual identification of the primary trend.🛑 Important DisclaimerThis indicator (HRESH SNIPER PRO) is provided as a sophisticated technical analysis tool only. It is not financial advice. All risks associated with trading, including capital loss, are borne by the user. Do your own research (DYOR) and strictly adhere to sound risk management principles.

Swing Trading IndicatorThis script is a swing‑trading dashboard designed for BTC, ETH, S&P 500 (for now). It combines weekly RSI, USDT.D, VIX, moving averages and Fisher Transform into a single visual tool, with background highlights, an on‑chart info table and ready‑made alerts to help you time high‑probability swing entries and manage risk.
1. Overview
The indicator is intended to work on daily timeframe.
Signals are context‑aware: BTC and ETH get USDT.D conditions, SPX gets VIX and EMA‑100 logic, and all non‑ETH symbols can also use Fisher Transform as a mean‑reversion filter.
2. Conditions and background highlights
Each component sets a boolean condition and, when active, paints a background layer:
Weekly RSI condition
True when weekly RSI is below its symbol‑specific threshold.
USDT.D conditions
BTC: triggered when USDT.D is above the user threshold and the chart symbol is BTC.
ETH: same logic for ETH, but tracked separately..
VIX condition (SPX only)
True when VIX high is at or above the VIX threshold while the chart is SPX.
EMA condition (BTC & SPX)
BTC: daily close below EMA‑200.
SPX: daily close below EMA‑100.
Fisher Transform condition (non‑ETH)
Fisher Transform on the chart timeframe, using the configured period.
True when Fisher value is below the Fisher threshold.
3. Intended use and notes
This indicator is designed as a confluence tool for swing traders, not a standalone buy/sell system. It works best on assets that are in a clear uptrend, where the main idea is to accumulate during corrections within that broader bullish structure.
During larger market shocks, deep corrections, or black‑swan events, trend‑based and mean‑reversion filters can produce false signals, because volatility and correlations often behave abnormally in those periods. For that reason, this script should always be combined with independent risk management, higher‑timeframe trend analysis, and your own discretion.

BTC Swing Plan – Levels & ZonesThis indicator draws a structured breakout model for BTCUSD with clearly defined entry levels, stop zones, and four realistic upside targets.
It automatically plots:
Breakout zone
Stop-loss zone
Target 1
Target 2
Target 3
Target 4 (stretch target)
Midlines & color-coded structure boxes
This tool is designed for traders who prefer clean execution levels, disciplined risk management, and realistic price expansion steps—not overly aggressive moon projections.
All levels are fully adjustable from the settings menu.

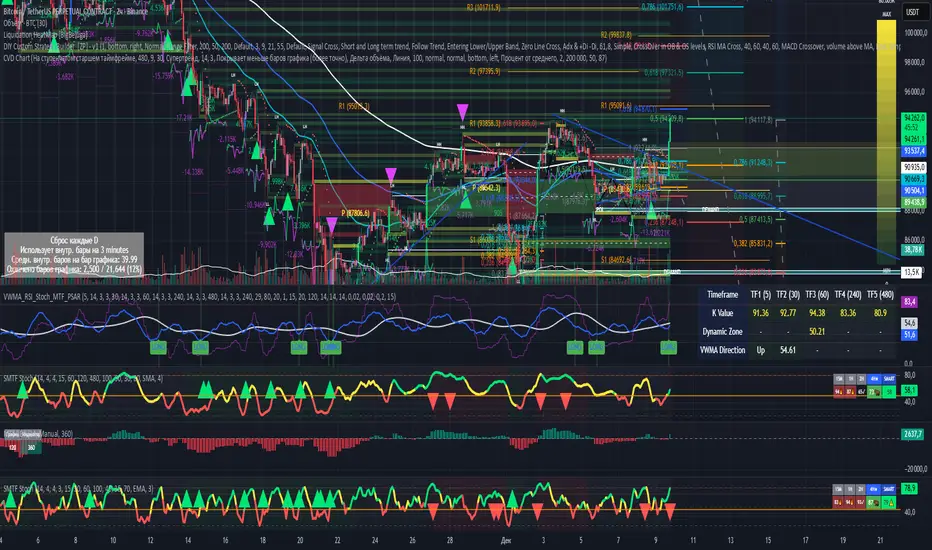
Smart Multi-TF StochasticSmart Multi-TF Stochastic (SMTF Stoch)
Smart Multi-TF Stochastic is a multi-layer momentum analysis system built on top of Stochastic signals from several timeframes. It combines four stochastic timeframes (15m / 1H / 2H / 4H), Premium–Equilibrium–Discount zones, dynamic weight reallocation, and adaptive smoothing into a single SMART oscillator that reflects the real market structure with higher accuracy.
Key Features
1. Multi-Timeframe Stochastic Engine
The indicator calculates Stochastic on four different timeframes:
15m – micro momentum
1H – local trend
2H – intraday structure
4H – primary trend
Core logic:
When the 4H trend is strong, higher timeframes receive more weight.
When the 4H trend weakens, the model shifts weight toward lower timeframes, which detect reversals earlier.
2. Premium / Equilibrium / Discount Zones
Based on the recent price range, the indicator determines where the asset currently trades:
Discount — ideal zone for long setups
Equilibrium — neutral territory
Premium — area for exits or reversals
Background shading is applied automatically.
3. SMART-Stochastic — Central Signal Line
The combined oscillator uses:
weighted logic depending on the strength of the higher timeframe trend,
adaptive smoothing (SMA / EMA / WMA / RMA),
dynamic color states:
green — strong bullish trend
red — strong bearish trend
yellow — uncertainty
4. Trading Signals
Long Entry Signal (“ENTRY LONG”)
Triggered when:
price is in Discount,
higher TF line is red/yellow (trend not fully bullish),
SMART-Stoch is below mid-level,
upward crossover through the entry threshold occurs.
Displayed as a green triangle.
Exit / Reversal Signal (“EXIT / REVERSAL”)
Triggered when:
price moves into Premium,
the SMART line exceeds the configured exit level.
Displayed as a red triangle.
Both signals only trigger once at the moment of confirmation.
5. Multi-TF Status Table
A compact table in the top-right corner shows:
stochastic values across all timeframes,
overbought/oversold indicators (🔥 / ❄️),
trend confirmations (✓ / ✗),
SMART signal markers (🚀 entry, ⚠️ exit).
6. Alerts
Built-in alert conditions:
“🚀 ENTRY LONG”
“🔴 EXIT / REVERSAL”
Designed for live trading automation.
Purpose
Smart Multi-TF Stochastic is intended for traders who rely on Premium/Discount logic, trend confirmation from higher timeframes, and precise timing on lower timeframes. It works both as a standalone decision system and as a high-quality confirmation tool in structured trading strategies.
Session Sweep System – WarRoomXYZ V1WarRoom Session Sweep System v1 is a open-source institutional trading framework built to identify liquidity behavior across Asia, London, and New York sessions.
It combines session-based liquidity mapping, sweep detection, daily expansion modeling, and trend confirmation into a unified, timing-driven system optimized for XAUUSD, FX pairs, indices, and any instrument with session-dependent volatility.
This tool does not attempt to predict direction with arbitrary oscillators.
Instead, it focuses on the underlying market mechanisms that drive price:
liquidity, timing, expansion, and trend alignment.
Below is a detailed explanation of what the script does, how its components work, and how traders can use it effectively.
🔹 1. Session Liquidity Mapping
The script automatically identifies the Asia (00:00–06:00 GMT), London (07:00–12:00 GMT), and New York (13:00–17:00 GMT) sessions and builds real-time session ranges.
Each session creates a liquidity pool.
Trading institutions frequently sweep the high or low of one session before delivering the real move in the next session.
This script captures that behavior by:
►Drawing session range boxes
►Tracking previous session highs/lows
►Highlighting high-probability sweep locations
These ranges are essential reference points for timing entries and exits.
🔹 2. Liquidity Sweep Detection (Buy & Sell Sweeps)
The indicator identifies when price runs a previous session high/low and rejects back inside the range, which is commonly interpreted as a liquidity sweep.
The following sweep types are monitored:
►London sweeping Asia
►New York sweeping London
►Asia sweeping New York
►Daily sweep of PDH/PDL
Sweeps signal that liquidity has been collected and that a potential reversal or continuation is likely.
These are marked clearly on the chart for real-time decision-making.
🔹 3. Killzone Timing Model (GMT Time)
Market manipulation and expansion often occur during specific time windows.
The script highlights these institutional killzones:
►London Killzone: 07:00–10:00 GMT
►New York Killzone: 13:30–15:30 GMT
►NY PM Session: 19:00–21:00 GMT
Sweeps occurring inside these windows carry a significantly higher probability.
The timing layer helps filter out low-quality setups.
🔹 4. Daily Range & ADR Expansion Engine
A dedicated panel displays:
►Current day range
►ADR (Average Daily Range)
►Expansion stage (Early / Developed / Extended)
►PDH/PDL swept or intact
►Overall session bias
This allows traders to understand whether the daily move is likely to continue or reverse.
For example:
►Early expansion → trend continuation likely
►Extended expansion → reversal setups become more probable
This is useful for intraday targets and risk management.
🔹 5. MA Cloud Trend Model (Fast/Slow Structure)
To align liquidity behavior with directional conviction, the script includes a configurable MA engine:
►Fast & slow MA
►MA cloud
►Slope-based trend coloring
►Trend background
►MA cross alerts
The cloud provides trend confirmation without relying on oscillators.
Trades are higher quality when the sweep direction aligns with the MA trend.
🔹 6. How the Components Work Together
The script integrates several institutional concepts into one coherent model:
►Sessions define liquidity pools
►Sweeps identify stop-hunts and reversals
►Killzones define optimal timing
►MA Cloud confirms directional bias
►ADR engine indicates expansion potential
This creates a structured framework:
Sweep → Timing → Trend → Expansion → Execution
Each component strengthens the others, forming a robust decision-making model.
🔹 7. How to Use the Indicator (Practical Guide)
✔ Look for a sweep of a previous session level
When price runs a session high/low and closes back inside, liquidity has likely been collected.
✔ Confirm timing
Sweeps inside London or NY killzones tend to produce the strongest moves.
✔ Confirm trend
Use MA cloud direction and slope:
►Cloud green → long setups preferred
►Cloud red → short setups preferred
✔ Check ADR panel
If the day has already expanded significantly, reversal setups are more likely.
If expansion is still early, continuation setups are favored.
✔ Plan your trade
Common targets include:
►Opposite side of session range
►ADR High/Low
►PDH/PDL
Stops are typically placed beyond the sweep wick.
This creates a repeatable, rule-based approach to intraday liquidity trading.
🔹 8. Why This Script Is Original
This is not a mashup of existing open-source indicators.
It introduces:
►A custom session-linked liquidity sweep engine
►A structured daily expansion model
►Integrated killzone timing aligned with GMT
►A unified bias panel merging sweeps, ADR, and session manipulation
►A trend confirmation layer designed around session behavior
While it uses known institutional concepts, their integration, execution, and timing framework are unique, purpose-built, and not directly found in open-source scripts.
🔹 9. Suitable Markets
This indicator works best on:
►XAUUSD
►Major FX pairs
►US indices
►Synthetic markets with session cycles
Ideal timeframes: 1m, 5m, 15m, 30m
🔹 10. Limitations / Notes
This is an analytical tool, not a buy/sell signal generator
All sweeps are confirmed at candle close (non-repaint)
The tool assumes GMT session windows unless chart time differs
Users must practice risk management and entry triggers manually
Disclaimer
This script is provided for informational and educational purposes only. It does not provide financial, investment, or trading advice, and it does not guarantee profits or future performance. All decisions made based on this script are solely the responsibility of the user.
This script does not execute trades, manage risk, or replace the need for trader discretion. Market behavior can change quickly, and past behavior detected by the script does not ensure similar future outcomes.
Users should test the script on demo or simulation environments before applying it to live markets and must maintain full responsibility for their own risk management, position sizing, and trade execution.
Trading involves risk, and losses can exceed deposits. By using this script, you acknowledge that you understand and accept all associated risks.

SuperWaveTrendWaveTrend with Crosses + HyperWave + Confluence Zones + Thresholds
SuperWaveTrend — Advanced Momentum System Integrating WaveTrend, HyperWave, Confluence Zones & Threshold Filters
SuperWaveTrend is an enhanced momentum indicator built upon the classic WaveTrend (WT) framework.
It integrates HyperWave extreme zones, top/bottom Confluence Zones, trend hesitation Threshold regions, WT crossover reversal signals, and more.
This indicator is suitable for:
• Trend following
• Swing trading
• Reversal spotting
• Overbought/oversold structure analysis
• Extreme market sentiment detection
Whether you’re scalping or planning swing entries, SuperWaveTrend offers a more precise and visually intuitive momentum structure.
Key Features
1. WaveTrend Core Structure (WT1 / WT2)
• WT1: Primary momentum line
• WT2: Signal line
• Momentum Spread Area (WT1 − WT2) visualization highlights shifts in trend strength
2. HyperWave Extreme Momentum Zones
Background highlight automatically appears during extreme momentum conditions:
• Purple-red: Extreme bullish zone
• Orange: Extreme bearish zone
Helps identify:
• Blow-off tops
• Panic sell-offs
• Extreme trend continuation phases
3. Confluence Zones (Top/Bottom Resonance)
Combines overbought/oversold signals with momentum structure to mark:
• Gold top zones → weakening bullish momentum
• Blue bottom zones → weakening bearish momentum
Useful for detecting:
• Bearish divergence tops
• Reversal bounces
• High-level exhaustion / low-level capitulation
4. Threshold Hesitation Zone (Gray)
When WT1 and WT2 converge tightly, a gray background highlights:
• Unclear direction
• Trend weakening
• Higher risk of false signals
Generally not recommended for new entries.
5. WT Crossover Signals (Cross Signals)
WT1 and WT2 crossovers are marked with color-coded dots:
• Green: Bullish cross
• Red: Bearish cross
A core signal for capturing reversal shifts.
⚠️ Creator’s Disclaimer & Usage Insights
***WARNING***
SuperWaveTrend is not designed for extremely strong one-sided trends.
During highly impulsive markets, signals may become delayed or less reliable.
Optimal Timeframes
Based on extensive backtesting, In swing-trading environments, the indicator performs most effectively on the 1H–4H timeframes, where momentum cycles form cleanly and Confluence Zones provide high-probability setups.
Trading Insights
• In swing-trading environments, Confluence Zones often coincide with excellent long/short opportunities, especially when momentum exhaustion is confirmed.
• When paired with a Bollinger Bands framework, the system exhibits significantly improved accuracy and structure clarity.
Have fun,
BigTrunks

🐋 MACRO POSITION TRADER - Quarterly Alignment 💎Disclaimer: This tool is an alignment filter and educational resource, not financial advice. Backtest and use proper risk management. Past performance does not guarantee future returns.
so the idea behind this one came from an experience i had when i first started learning how to trade. dont laugh at me but i was the guy to buy into those stupid AI get rich quick schemes or the first person to buy the "golden indicator" just to find out that it was a scam. Its also to help traders place trades they can hold for months with high confidence and not have to sit in front of charts all day, and to also scale up quickly with small accounts confidently. and basically what it does is gives an alert once the 3 mo the 6 mo and the 12 mo tfs all align with eachother and gives the option to toggle on or off the 1 mo tf as well for extra confidence. Enter on the 5M–15M after a sweep + CHOCH in the direction of the aligned 1M–12M bias. that simple just continue to keep watching key levels mabey take profit 1-2 weeks and jump back in scaling up if desired..easy way to combine any small account size.
Perfect balance of:
low risk
high R:R
optimal precision
minimal chop
best sweep/CHOCH clarity
hope you guys enjoy this one.

UT Bot Pro Max (Maks Edition)Script v2.0
UT Bot Pro Max is an advanced, high-precision evolution of the well-known UT Bot indicator.
This version is fully rebuilt into a complete decision-making system that evaluates trend structure, volatility conditions, momentum signals, and entry quality.
It is designed for traders who want clear, structured signals supported by objective filters and transparent reasoning.
1. Core Engine: ATR-Based Trailing Logic
At the heart of the system is an ATR dynamic trailing stop.
It is responsible for:
detecting trend reversals
identifying breakout conditions
switching between long and short bias
determining signal strength
Unlike simple ATR lines, this engine adapts to momentum expansion and contraction, forming the backbone for every signal.
2. Three-Tier Signal Structure
Each signal is classified into one of three levels based on the number of confirmations:
Strong Signals
ATR breakout
trend filter (price relative to EMA200)
RSI filter (oversold/overbought context)
This is the highest-quality confirmation and is suitable for full-size entries.
Medium Signals
ATR breakout
trend filter
(no RSI filter)
This represents a valid trend continuation but with slightly reduced confirmation.
Weak Signals
ATR breakout only
(no trend filter, no RSI filter)
This is an early-stage impulse which can evolve into a stronger move.
The multi-level classification allows the trader to size positions rationally and avoid over-committing during uncertain market conditions.
3. Move-Since-Entry Tracking
When a new long or short position is detected, the indicator records the entry price and automatically tracks the percentage movement from that point.
This offers:
real-time monitoring of open trade performance
objective context for managing exits
clear visualization of progress since entry
4. Smart State-Change Alerts
Instead of simple “BUY” or “SELL” messages, the script sends highly structured alerts whenever the internal state changes.
Each alert includes:
the symbol and timeframe
signal direction and strength
recommended position size based on signal tier
ATR values
RSI value and its state
trend context (bullish, bearish, neutral)
distance from ATR trailing stop
movement since entry
previous state reference (optional)
This makes it ideal for automated systems, algorithmic routing, or Telegram-based signal delivery.
5. Professional On-Chart Status Table
The indicator displays a refined information panel containing:
current signal state (Strong / Medium / Weak / Hold)
ATR signal direction
trend filter result
RSI value and condition
distance to trailing stop (percentage)
current position (long / short / flat)
entry recommendation based on signal strength
ATR value and additional context in expanded mode
There is also a compact mode optimized specifically for mobile trading.
6. Optional Heikin Ashi Mode
The indicator can operate using Heikin Ashi close values for traders who prefer smooth, noise-reduced visualizations.
The internal logic is recalculated automatically.
7. Trend-Colored Candles
An optional feature allows candle coloring based on price position relative to the ATR stop line, highlighting bullish and bearish phases directly on the chart.
What This Indicator Provides
Accurate, context-aware entry signals
Scalable position sizing through multi-tier structure
Objective trend confirmation
Breakout detection with volatility adaptation
Continuous tracking of open position performance
Detailed real-time explanations through alerts
A complete visual dashboard consolidating all key metrics
UT Bot Pro Max (Maks Edition) is built as a practical tool for daily trading.
It is suitable for scalping, day trading, swing trading, automated alerts, and mobile workflows.

NQ Market DNA MapNQ Market DNA Map
The Market DNA Map indicator is designed to visualize key trading sessions (Asia, London, and New York) on the chart while providing a probabilistic lookup table based on historical session patterns. This tool draws session boxes with midline references, extends session highs and lows until mitigated or a daily hardstop (16:00 in the selected timezone), and displays a summary table with statistical metrics derived from predefined historical data. The data mappings are hardcoded, reflecting an analytical approach for session-based price action. Note that all probabilities and metrics are based on past observations and should not be interpreted as predictions or guarantees of future market behavior. These statistics are only tested and generated based on NQ futures. This indicator is for educational and informational purposes only; trading decisions should incorporate additional analysis and risk management.
Key Features
• Session Visualization:
o Draws colored boxes for the Asia, London, and New York sessions, updating in real-time as the session progresses.
o Includes a dotted midline within each box for quick reference to the session's midpoint.
o Extends horizontal lines from the final session high and low until price mitigates them (crossing both above and below) or the daily hardstop is reached.
• Probabilistic Table:
o A customizable-position table appears on the chart (once the New York open is detected), summarizing conditions and metrics for the current day's setup.
o Conditions include: Asia range relative to its rolling average, London open relative to Asia's midpoint, London sweep type (high only, low only, both, or none), and New York open relative to London's midpoint.
o Metrics displayed include:
First High Sweep %: Probability (based on historical data) that the high of the prior session is swept first during New York.
First Low Sweep %: Probability that the low is swept first.
Med Pen ↑ (High): Median penetration distance (in points) above the session high.
Med Pen ↓ (Low): Median penetration below the session low.
Fail High -> Low %: Failure rate where an initial high sweep fails and reverses to sweep the low.
Fail Low -> High %: Failure rate for an initial low sweep reversing to the high.
Sample Size: Number of historical observations for the matching pattern (n value), with a rating of "High" (n ≥ 150), "Mid" (n ≥ 75), or "Low" (n < 75) to indicate data reliability.
o The table uses color-coding for quick interpretation: Green for above-average/above-mid conditions, red for below, and neutral tones for metrics.
• Asia Range Ratio: Calculates a rolling average of Asia session ranges over a user-defined lookback period to classify the current Asia range as above or below average.
• Hardstop Logic: All extensions cease at 16:00 in the selected timezone to align with typical daily cycle resets.
Inputs and Customization
• Calculation Timezone: Select from predefined options (e.g., "America/New_York", "Europe/London") to align session times with your preferred market clock. Default: "America/New_York".
• Session Times:
o Asia Session: Default "2000-0200" (8:00 PM to 2:00 AM in the selected timezone).
o London Session: Default "0200-0800" (2:00 AM to 8:00 AM).
o NY Session: Default "0800-1600" (8:00 AM to 4:00 PM). These can be adjusted to match specific market hours or personal preferences.
• Asia Ratio Rolling Window: Integer lookback (default: 20) for calculating the average Asia session range ratio (range divided by open price).
• Table Position: Choose where the summary table appears on the chart (e.g., top_right, bottom_right). Default: top_right.
• Colors: Customizable box fill and border colors for each session (Asia: yellow tones, London: blue, NY: gray) with transparency settings for overlay compatibility.
How It Works
1. Session Detection: The indicator checks the current bar's time against user-defined sessions in the selected timezone. Sessions are non-overlapping and assume a 24-hour cycle.
2. Box and Line Drawing:
o At session start, a box is initialized from the open/high/low.
o As the session progresses, the box expands to capture the live high/low, with the midline updating dynamically.
o Upon session end, final high/low are locked, and extension lines are drawn horizontally.
o Extensions persist until price fully mitigates the level (high ≥ level and low ≤ level) or the hardstop time is passed.
3. Asia Ratio Calculation: Maintains a historical array of Asia range ratios (high-low divided by open). The current ratio is compared to the average over the lookback to classify as "Above Avg" or "Below Avg".
4. Key Generation and Lookup:
o A unique key is built from four binary/ternary codes: Asia classification (0/1), London open vs. Asia mid (0/1), London sweep type (0=high only, 1=low only, 2=both, 3=none), NY open vs. London mid (0/1).
o This key queries a hardcoded map of historical data (e.g., "0_0_0_0" for above-avg Asia, above-mid London open, high-only sweep, above-mid NY open).
o Data includes sample size, probabilities, failure rates, and median penetrations, all derived from historical analysis (total samples across all keys: approximately 5,000+ based on the provided mappings).
5. Table Rendering: On the last bar (real-time), the table populates with the current key's data. Metrics are formatted for readability, and penetration values are scaled to the current London high/low in points for context.
6. Performance Notes: The indicator uses up to 500 lines and boxes for extensions and visuals, ensuring compatibility with TradingView limits. It is overlay=true, so it plots directly on the price chart.
Data Source and Limitations
The probabilistic data is hardcoded and represents a compilation of historical session patterns from backtested or observed market behavior on NQ futures. Exact data collection methodology is not specified in the script, but values are presented as-is for illustrative purposes. Users should verify applicability to their specific symbol/timeframe, as markets evolve and past patterns may not repeat. Low-sample patterns (rated "Low") have higher uncertainty.
This indicator does not generate buy/sell signals, alerts, or trading strategies—it solely provides visual and statistical context. Always combine with other tools, fundamental analysis, and proper risk controls. Trading involves risk of loss; no performance guarantees are implied. If republishing or modifying, please credit the original structure and adhere to TradingView's publication guidelines. For questions on usage, refer to TradingView documentation on session indicators and probabilistic tools.

Price Forecast - Future price Ichimoku ATR RSI Kumo It predicts
Future price (projected close)
future high-low (ATR projection)
Ichimoku Future Span overlay
alerts "future price above/below threshold".
Ichimoku Kumo Projection (Leading Span A & B). Senkou Span A (Future A) Senkou Span B (Future B).
ATR Projection Channel (ATR Bands/Volatility Forecast).
Linear regression forecast for +1 bar.
Multi timeframe
RSI+Kumo filter for clearer signals.

Precious Matrix Signal-S-L15-sum⭐ PRECIOUS MATRIX SIGNAL™
Today Range + R1–R6 Multi-Layer Market Structure Engine
Final Output → 🔵 BUY | 🔴 SELL | ⏹ NEUTRAL
A powerful, multi-range decision engine that reads today’s live structure and compares it with six major past ranges, Δ/E shifts, and daily strength summaries to generate a precise directional signal.
📘 What This Indicator Does
This indicator builds a complete price-behavior matrix combining:
🔹 Today’s High–Low structure
🔹 Six custom historical ranges (R1–R6)
🔹 Live Δ/E trend shifts
🔹 A/R (Above–Below Range) positioning
🔹 Remaining Potential %
🔹 Last-5, Last-10, Last-15 day trend summary
🔹 Auto Spot–Future selection
🔹 Lot size & Margin info
( Not for dark mode &only on NSE Futures & Spot )
All layers combine to produce a single actionable signal.
🔶 How It Works (Simple Flow)
1️⃣ Symbol Auto-Detection
If chart is futures, uses futures data
If futures range missing → switches to continuous 1!
If chart is spot, uses spot cleanly
Auto-reads lot size and margin
2️⃣ Today’s Live Range Engine
Live High / Low
Time of High & Low
Δ (Range size)
A/R (Where current price sits inside the range)
Remaining Potential % (powerful continuation measure)
3️⃣ R1–R6 Custom Range Engine
Each user-set range displays:
High & Low
Δ
A/R positioning
Remaining Potential %
Overshoot/Breakdown markers
Δ/E (Direction shift)
Color-coded range strength
4️⃣ Δ/E Shift Logic (Live Mode)
For each R1–R6:
Prev = previous close before the range
E = end-close of the range
Δ/E = Direction:
▲ Positive → Bullish
▼ Negative → Bearish
■ Neutral → Sideways
If the range ends today → uses intraday close (E*).
5️⃣ Trend Validation (Last-5 / 10 / 15 Days)
Automatic summary tables:
Daily Date
Close
H/L
Δ
A/R
Net Trend Color
Strongest zone marked
This prevents false signals and confirms bias.
6️⃣ Final Signal Engine
Uses a weighted scoring across:
Today’s bias
R1–R6 bias
Δ/E direction
Remaining potential
Last-5/10/15 confirmation
🔵 BUY
→ Majority Ranges UP
→ Today’s structure UP
→ Δ/E = ▲
→ Last-5 positive
🔴 SELL
→ Majority Ranges DOWN
→ Today’s structure DOWN
→ Δ/E = ▼
→ Last-5 negative
⏹ NEUTRAL
→ Mixed or no clear dominance
→ Low potential/compressed price
📊 Dashboard Panels
Panel 1 – Today + R1–R6 Master Matrix
Shows:
H / L / Δ
A/R
Remaining Potential %
Δ/E (live option)
Range badges & colors
Panel 2 – Last-5 / 10 / 15 Summary
Your secondary confirmation panel.
Panel 3 – Lot Size + Margin
Auto margin estimate at 24%.
⚙️ Input Controls
Show/Hide HLX Panel
Custom Range Start/End
Δ/E Live Override
Force Intraday Mode
Last-5/10/15 Selector ( last work properly display on mobile )
Nudge (Panel Offset)
Potential % thresholds
Designed to adjust smoothly for all timeframes.
🎯 Recommended Usage
Use on 3m / 5m / 15m / 30m / 1H / 2H / 4H
Works great on Index Futures, Stock Futures, and Spot
Keep Option-2 Δ/E enabled for live trading
Last-5 and R2–R6 give strongest confirmation for trend days
📈 Who Is This For?
Traders who want:
Multi-range professional context
Reliable bias confirmation
High-probability directional entries
Auto-range intelligence without manual marking
Futures–spot multi-engine precision
🟢 SUPER-SIMPLE FLOWCHART
START
|
Detect Spot/Future + Lot
|
Compute TODAY H/L
|
Compute R1–R6 Ranges
|
Apply Δ/E Live Logic
|
Build Range Strength Score
|
Build Last5/10/15 Trend
|
Combine All Scores (matrix)
|
BUY ? SELL ? NEUTRAL ?
|
Display Full Dashboard
🛑 Disclaimer
This is an educational tool.
No buy/sell recommendations.
Always use proper risk management.

Bollinger Bands SMThis script plots four custom Bollinger Band envelopes on price to map volatility, trend and extremes on a single chart.
What it shows
BB Set 1 – 50-length, 1.25σ (cyan/red)
Short–to–medium-term volatility channel. Good for spotting squeezes, early breakouts and pullbacks in the active trend.
BB Set 2 – 200-length, 1.25σ (lime/yellow)
Higher-timeframe “trend envelope”. When price rides the upper band the trend is strong; closes below the lower band often signal deeper corrections.
BB Set 3 – 14-length, 3.2σ (white/blue, green fill)
Fast, very wide band for short-term volatility spikes. Tags of these outer bands highlight overextended moves that often mean-revert.
BB Set 4 – 200-length, 5σ (white/red, purple fill)
Extreme long-term volatility boundary. Price reaching this zone is rare and can mark exhaustion, blow-off moves or panic washes.
How I use it
Look for squeezes where bands contract tightly before large moves.
Watch for confluence when multiple bands line up as support/resistance.
Treat outer band touches as risk zones, not automatic reversal signals – wait for confirmation from structure or your own system.
This is a visual tool to understand volatility and trend context, not a standalone buy/sell system and not financial advice.

Vassago & Tesla Ex-Machina 197 45 21 [Hakan Yorganci]Vassago & Tesla Ex-Machina 197 45 21
"Any sufficiently advanced technology is indistinguishable from magic." — Arthur C. Clarke
🌑 The Genesis: Algorithmic Esotericism
This script is not merely a technical indicator; it is a digital artifact born from the convergence of Software Engineering and Hermetic Tradition.
As a developer and researcher dedicated to "Technomancy"—the study of applying esoteric logic to computational systems—I designed this algorithm using a custom, experimental programming environment I am currently developing. My goal was to move beyond standard, arbitrary financial inputs (like the default 200 SMA or 14 RSI) and instead derive parameters based on Universal Harmonics and Historical Archetypes.
This indicator, Ex-Machina, is the result of that transmutation. It applies ancient numeric precision to modern market chaos.
🔢 Decoding the Protocol: 197 - 45 - 21
Why these specific numbers? They were not chosen randomly; they were calculated through specific harmonic reductions to filter out market noise.
1. The Harmonic Trend (Tesla Protocol)
* The Logic: Standard analysis uses the 200-period Moving Average simply out of habit. However, applying Nikola Tesla’s 3-6-9 vibrational principles, the engine reduced the period to 197.
* The Numerology: 1+9+7 = 17 \rightarrow 1+7 = \mathbf{8}. In esoteric numerology, 8 represents infinite power, authority, and financial flow. This creates a baseline that aligns more organically with market accumulation than the static 200.
2. The Hidden Dip (Solomonic Sight)
* The Archetype: Based on the attributes of Vassago, the archetype of discovering "hidden things," the algorithm identified 45 as the precise threshold for a "Sniper Entry."
* The Function: Unlike the standard 30 RSI, this level identifies the exact moment a correction matures within a bullish trend—catching the dip before the crowd returns.
3. The Prophetic Vision
* The Logic: Using the Fibonacci Sequence, the indicator projects the support line 21 bars into the future.
* The Utility: This allows you to visualize where the support will be, granting you foresight before price action arrives.
⚖️ The Dual Mode Engine: Sealed vs. Living
Respecting the user's will, I have engineered this script as a Hybrid System. You can choose how the "spirit" of the code interacts with the market via the settings menu.
1. The Sealed Ritual (Default - Unchecked)
* Philosophy: "Trust in the Constants."
* Behavior: Strictly adheres to the 197 SMA and 45 RSI.
* Visual: Displays a Blue Trend Line.
* Best For: Traders who value stability, long-term trends, and the unyielding nature of harmonic mathematics.
2. The Living Spirit (Adaptive Mode - Checked)
* Philosophy: "As the market breathes, so does the code."
* Behavior:
* Transmutation: The trend line shifts from a Simple Moving Average (SMA) to an Exponential Moving Average (EMA 197) for faster reaction.
* Adaptive Volatility: The RSI entry level (45) becomes dynamic. It expands and contracts based on ATR (Average True Range). In high volatility, it demands a deeper dip to trigger a signal, protecting you from fake-outs.
* Visual: Displays a Fuchsia (Pink) Trend Line.
* Best For: Volatile markets (Crypto/Forex) and traders who want the algorithm to "sense" the fear and greed in the air.
⚙️ How to Trade
* Timeframe: Optimized for 4H (The Builder) and 1D (The Architect).
* The Signal: Wait for the "EX-MACHINA ENTRY" label. This signal manifests ONLY when:
* Price is holding above the 197 Harmonic Trend.
* Momentum crosses the Optimized Threshold (45 or Adaptive).
* Trend Strength is confirmed via ADX.
Author's Note:
I built this tool for those who understand that code is the modern spellbook. Use it wisely, risk responsibly, and let the harmonics guide your entries.
— Hakan Yorganci
Technomancer & Full Stack Developer

Opening Range ICT 3-Bar FVG + Engulfing Signals (Overlay)Beta testing
open range break out and retest of FVG.
Still working on making it accurate so bear with me

Grok Gold Master 2025Grok Gold Master 2025 – Full Indicator Description Always & Forever Free, only for self use only
(TradingView Pine Script v6 – specially built for XAUUSD / Gold)
This is a clean, professional, all-in-one Gold trading indicator designed for swing/day traders who want clear institutional-style levels, bias confirmation, and visual structure on the chart.
Core Purpose
Help you trade Gold (XAUUSD) with a high-probability bullish bias when price is above key levels, using a simple but powerful “3-zone” framework:
- Support (demand zone)
- Buy Zone (the sweet spot where you actually want to go long)
- Resistance (supply zone)
Main Visual Elements on the Chart
1. **Daily Range Box**
- A semi-transparent green box that covers the entire trading day from Support to Resistance
- Automatically refreshes every new day without any “future leak” errors
- Gives instant context of the current daily range
2. **Three Horizontal Levels (always visible)**
**
- Support → dashed lime line (default 4114)
- Buy Zone → thick solid yellow line (default 4180) ← your main long trigger level
- Resistance → dashed red line (default 4314)
3. **Zone Fills**
- Yellow fill between Support ↔ Buy Zone (caution/neutral area)
Green fill between Buy Zone ↔ Resistance (bullish control area)
4. **4-hour EMA 50 (thick dodger blue line)**
- Pulled from the 4H timeframe (multi-timeframe)
- Acts as dynamic trend filter
5. **Entry Signals**
- Big green “LONG” label + arrow appears only the first bar when:
close > Buy Zone AND close > 4H EMA 50
- Optional green triangles below bars when there is also high volume confirmation (volume > 1.5× 20-period average)
6. **Info Panel (top-right mini table + big label)**
Shows current values for:
- Support / Buy Zone / Resistance
- Current 4H EMA 50
- Live BIAS: “BULLISH – LONG ✅” (green) or “NEUTRAL – WAIT ⏸️” (gray)
Key Logic & Rules Built Into the Indicator
Bullish / Long condition (all must be true):
- Price closes above the Buy Zone level
- Price closes above the 4-hour EMA 50
When both are satisfied → entire info label turns green and says “BULLISH – LONG ✅”
If not → stays neutral/gray and tells you to wait.
Customization Options (Inputs)
- Show/hide the big info label
- Show/hide high-volume confirmation triangles
- Use Dynamic Levels → turn on to manually override the three levels with your own values (very useful when Gold breaks to new all-time highs or you spot new initiation levels)
Why This Indicator Feels “Institutional”
- Clean three-zone structure (exactly how smart money & banks draw their levels)
- Daily range box gives perfect context
- Multi-timeframe trend filter (4H EMA50)
- Volume spike confirmation option
- No repainting, no future leaks
- Instant visual bias at a glance
Best Used On
- XAUUSD (Gold) on 5m, 15m, 1H or 4H charts
- Works beautifully in both ranging and trending markets
In short: “Grok Gold Master 2025” is your 2025-2026 Gold trading dashboard — it tells you exactly where the important levels are, when the trend is truly bullish, and when to press the long button with confidence.
Just add it to your chart and you’ll immediately see why many Gold traders already using almost this exact setup. Now it’s packaged, automated, and looks gorgeous.

Next Candle Probability (EB, EWMA, Regime)Purpose
This indicator provides a quantitative assist to day traders by estimating the probability that the next candle will close green or red.
It analyzes recent red/green sequences across pattern depths N = 1…7 and produces a unified probability score.
By understanding which side has statistically higher likelihood, traders can align their decision-making with dominant directional bias rather than emotion.
Methodology
Strict no-lookahead logic (no repaint, doji filtered out)
Hierarchical smoothing across depths (1 → 7) using empirical-frequency regularization
Optional exponential decay (EWMA) for adaptive weighting toward recent market behavior
Higher-timeframe EMA regime filter (trend-aligned / countertrend-blocked / off)
ALL / SELECTED scope modes with a single, consolidated decision per bar
On-chart informational tags showing raw frequency (“R”) and smoothed estimate (“E”)
Full alert support for directional probability shifts
How it helps day traders
The indicator highlights whether the next bar’s probability distribution favors the bullish or bearish side.
This supports decision-making that is aligned with:
recent statistical behavior,
trend direction,
and adaptive weighting of market conditions.
It is designed for traders who want a structured, probability-based confirmation rather than relying on subjective interpretation.
Research & Theory
This script is based on:
empirical pattern-frequency modeling,
hierarchical Bayesian-style smoothing,
and regime filtering through higher-timeframe trend structure.

OXE MTF Support/Resistance+Demand/Supply Zone ArsenalOXE MTF Support/Resistance + Demand/Supply Zones Indicator
Your Complete Multi-Timeframe Zone Arsenal
This professional-grade indicator transforms your chart into a zone confluence powerhouse, simultaneously tracking high-probability price reaction areas across 5 timeframes (Daily, H4, H1, M15, M5) – giving you the institutional edge you need to dominate the markets.
🎯 What It Is
A sophisticated dual-system zone detector that identifies both:
Classic Support/Resistance levels using pivot point detection
Smart Money Demand/Supply zones triggered by Break-of-Structure (BOS) confirmations
Unlike basic S/R indicators, this tool employs institutional methodology – capturing order blocks and imbalance zones where smart money is positioned, not just where price bounced.
⚡ Core Capabilities
Multi-Timeframe Mastery
Track up to 5 timeframes simultaneously without switching charts
Identify confluence zones where multiple timeframe levels align
Customize which timeframes to display for clean, focused analysis
Intelligent Zone Management
Automatic zone validation – tracks when zones flip from resistance→support or supply→demand
Invalid zone filtering – hide broken/invalidated zones to focus only on active opportunities
Configurable zone limits – control the number of zones per timeframe (up to 8 each)
Smart Money Detection
BOS-confirmed zones – only marks demand/supply after break-of-structure confirmation
Precise zone timing – captures the exact candle that created the imbalance
Visual differentiation – dashed borders distinguish demand/supply from traditional S/R
Professional Dashboard
Real-time zone counter – shows active zones per timeframe at a glance
Filter status indicators – tracks which validation filters are enabled
Color-coded timeframe labels – instant visual organization
💰 How This Transforms Your Trading
1. Find High-Probability Entries
Enter trades at zones where multiple timeframes converge – when H4 demand aligns with Daily support, you've found institutional backing.
2. Stay on the Right Side of the Market
The zone flipping system shows you when market structure changes – a supply zone that flips to demand tells you the narrative has shifted bullish.
3. Eliminate Guesswork
No more wondering "is this level still valid?" The automatic invalidation tracking removes subjectivity – zones are either active (tradeable) or broken (ignored).
4. Scale Your Timeframe Analysis
Whether you're scalping M5 or swing trading Daily, access all relevant zones without the mental overhead of switching between charts and manually tracking levels.
5. Trade Like Institutions
By combining pivot-based S/R with BOS-confirmed order blocks, you're seeing where retail AND institutional money is positioned – giving you the complete picture.
🔥 Perfect For
Day traders seeking M15/H1 confluence for precise entries
Scalpers needing M5 zones with higher-timeframe confirmation
Swing traders looking for Daily/H4 zone alignment for position trades
ICT/SMC practitioners combining order blocks with traditional analysis
Any trader who values clean, validated, multi-timeframe zones over cluttered charts
