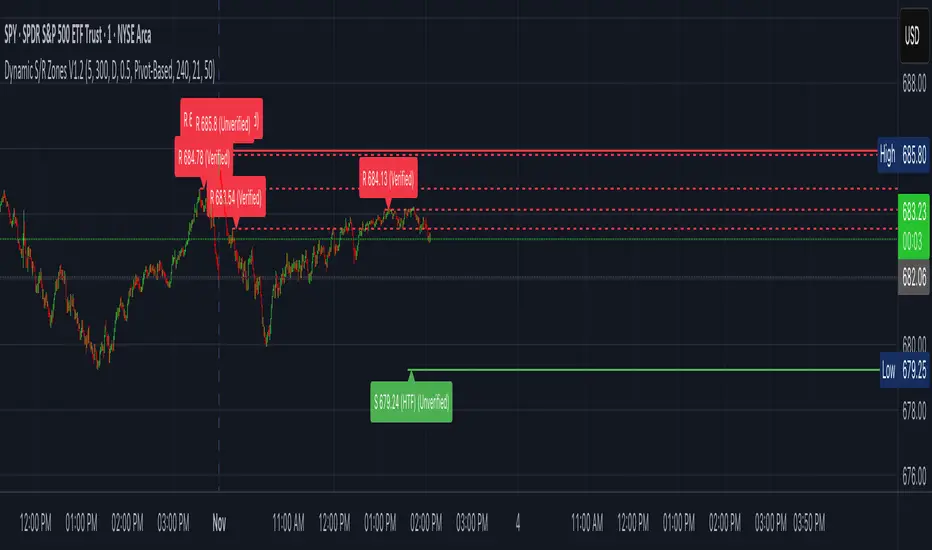
Dynamic S/R Zones (Verified Pivots)Dynamic S/R Zones V1.2
Overview
Dynamic S/R Zones V1.2 is a Pine v6 structure visualizer that highlights nearby Support/Resistance zones from confirmed swing pivots on the current chart and an optional higher timeframe (HTF). It can also plot simple Fibonacci guide levels (33% / 50% / 66%) between the most recent swing points. All HTF requests use lookahead_off to avoid forward-looking data, and S/R anchors are derived from verified pivots to minimize repainting. Optional “touch-verified” coloring flips a level’s display once price trades through it.
This tool is an illustrative S/R map for chart review and education.
How it works
Verified Pivots (Non-Repainting):
• Minor S/R uses ta.pivothigh/ta.pivotlow with a symmetric lookback (“Pivot Strength”).
• Lines anchor only on confirmed pivots, so once drawn they remain stable.
• A de-dup buffer filters out levels that are too close together.
HTF Major Zones:
• HTF OHLC is requested via request.security(..., lookahead=barmerge.lookahead_off).
• The same pivot logic runs on the HTF series; lines appear after the HTF bar closes.
• Major lines can be shown alongside (or instead of) minor lines.
Touch-Verified Coloring (optional):
• When a level is touched (high ≥ level ≥ low), it flips from neutral to a side color:
– Support (price above) ≈ green; Resistance (price below) ≈ red.
• The verification state is persistent for that line.
Fibonacci Guides (optional):
• Draws 33% / 50% / 66% between the last opposing swing high/low.
• Verification/coloring modes:
Pivot-Based: uses the most recent swing direction.
HTF Trend-Based: uses a fast/slow EMA comparison on a user-selected HTF.
Bounce/Reject Mode: color on touch regardless of trend interpretation.
• One arrow per bar (optional) indicates a newly verified fib touch.
What it displays
• Minor S/R lines from current-TF verified pivots (non-repainting anchors).
• Major S/R lines from HTF pivots (confirmed on HTF close).
• Optional labels that state level type, price, HTF tag, and Verified/Unverified status.
• Optional Fibonacci guide lines with labels, plus single-arrow confirmations.
• Coloring that reflects touch verification and current side (support/resistance).
Why it’s original
• Focuses on confirmed structure (minor + HTF) with de-duplication for clarity.
• Offers hybrid fib verification (pivot-based, HTF-trend-based, or bounce/reject) to let users study structure from multiple perspectives without asserting signals.
• Maintains persistent verification per level and avoids lookahead on HTF for stable, review-friendly visuals.
• Provides a compact workflow for scanning: minor structure, HTF context, then fib context.
Configuration & usage notes
• Pivot Strength: Higher values = stricter confirmation (fewer lines, more stable).
• Lookback Range: Prunes older lines; increase for broader context.
• HTF for Major S/R: Daily/4H/Weekly etc.; lines confirm on that timeframe’s close.
• Min Distance Between Levels: Helps reduce clutter from nearby duplicates.
• Touch-Verified Coloring: Enable for quick support/resistance side cues.
• Fibs: Choose coloring mode (Pivot-Based, HTF Trend-Based, or Bounce/Reject).
• HTF Trend TF / EMAs: Only affect coloring when using HTF trend mode for fibs.
• Performance: Labels and line counts can be tuned down on very long histories.
Limitations & assumptions
• Pivot detection depends on chart timeframe, liquidity, and chosen pivot length.
• HTF lines update after the HTF bar closes (by design, to avoid lookahead).
• Optional Realtime pivots for fibs (if enabled) are provisional and can shift until a swing verifies.
• Coloring and arrows are descriptive—they do not imply entries, exits, or probabilities.
Legal Disclaimer
These tools visualize calculations on historical data for charting and educational use only. They are not signals, recommendations, or promises of future results. Markets involve risk, and past results do not guarantee future outcomes. Provided “as is,” without warranties. Consider consulting a qualified professional before making decisions.
Fib
Dynamic Auto FibonacciDynamic Auto Fibonacci - Logarithmic Fib Retracements & Extensions
Overview
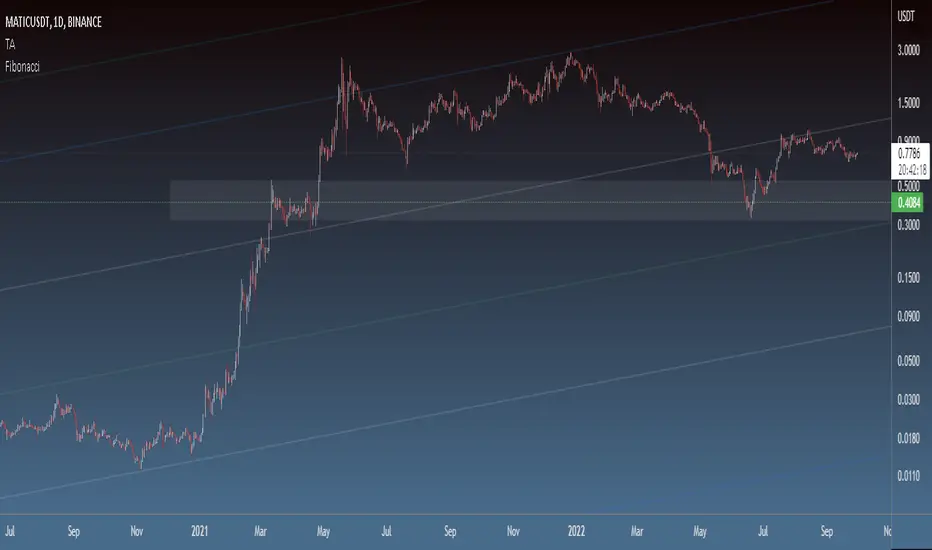
Dynamic Auto Fibonacci is an advanced Fibonacci analysis tool that automatically identifies swing highs and lows to plot precise retracement and extension levels on your chart. Unlike traditional manual Fibonacci tools, this indicator dynamically updates as price action evolves, with full support for logarithmic scaling - essential for accurate analysis on long-term charts and high-growth assets.
The indicator features a clean, modern aesthetic with customizable vibrant colors and text-only labels that won't clutter your chart, making it perfect for both intraday scalping and long-term position trading.
Key Features
✅ Automatic Fibonacci Detection - Automatically finds the highest high and lowest low within your selected timeframe
✅ Manual Anchor Point - Click directly on the chart to set a custom low point for your Fibonacci analysis
✅ Logarithmic Scale Support - True logarithmic Fibonacci calculations for accurate levels on log-scale charts
✅ Flexible Display Modes - Show retracements only, extensions only, or both simultaneously
✅ Fully Customizable Levels - Adjust any Fibonacci level value, color, or toggle individual levels on/off
✅ Unified Color Mode - One-click option to change all levels to a single color (perfect for minimalist chart styles)
✅ Clean Modern Design - Text-only labels with vibrant colors and adjustable positioning
✅ 13 Default Levels - Includes 0.0, 0.236, 0.382, 0.5, 0.618, 0.786, 0.886, 1.0, 1.236, 1.414, 1.618, 2.0, and 2.618
How to Use
Quick Start (Automatic Mode)
Add the indicator to your chart
By default, it will automatically find the lowest and highest points over the past 12 months
Fibonacci levels will appear with clean colored text labels positioned to the right of current price
Setting a Custom Anchor Point (Manual Mode)
This is the most powerful feature - drawing from a specific swing low:
Click the Settings icon (gear) on the indicator
Navigate to Fibonacci Settings group
Click inside the "Anchor Start Time" field - this will activate anchor selection mode
Click directly on the candle where you want to set your swing low point on the chart
The indicator will automatically:
Lock that candle as your anchor (swing low)
Find the highest high that occurred after your selected anchor point
Draw Fibonacci retracement and extension levels between those two points
Important: The anchor represents the starting point (0.0 level) of your Fibonacci, and the indicator finds the peak after that point as the 1.0 level.
Display Modes
Navigate to Display Settings → Display Mode to choose:
Retracements & Extensions (default) - Shows all levels from 0.0 to 2.618
Retracements Only - Shows only 0.0 to 1.0 levels (great for identifying pullback entry zones)
Extensions Only - Shows 1.0+ levels (useful for profit targets and breakout projections)
Customizing Individual Levels
Under Retracement Levels and Extension Levels groups, each level has three controls:
Toggle checkbox - Show/hide the level
Value field - Adjust the exact Fibonacci ratio (e.g., change 0.618 to 0.65 if desired)
Color picker - Set unique colors for each level
Unified Color Override
Perfect for chart screenshots or minimalist aesthetics:
Go to Unified Color Override settings group
Enable "Use Unified Color for All Levels"
Choose your color (defaults to gray)
All lines and text immediately change to that color - individual settings are preserved when you toggle back off
Line & Label Customization
Display Settings group offers:
Line Style: Solid, Dashed, or Dotted
Line Length: Short (10 bars), Medium (50 bars), or Long (extends right infinitely)
Line Width: 1-5 pixels
Label Size: Tiny to Huge
Label Offset: Adjust how many bars to the right labels appear (default: 12)
Show Anchor Line: Display vertical lines at your swing low and swing high points
Settings Overview
Fibonacci Settings:
Retracement Timeframe (default: 12M)
Anchor Start Time (click to select candle)
Use Log Scale Calculation (highly recommended for crypto and growth stocks)
Display Settings:
Display Mode (Retracements & Extensions / Retracements Only / Extensions Only)
Line Style, Length, Width
On-Chart Labels (clean text) or Price Scale Labels (traditional right-side axis)
Label Size and Offset
Unified Color Override:
One-click monochrome mode for all levels
Individual Level Controls:
8 customizable retracement levels (0.0 to 1.0)
5 customizable extension levels (1.236 to 2.618)
Use Cases
📊 Swing Trading - Identify key support/resistance zones for entries and exits
📊 Scalping - Use short-term anchors to find precise intraday reversal levels
📊 Position Trading - Logarithmic calculations essential for multi-year crypto/stock analysis
📊 Options Trading - Extension levels provide excellent profit target zones
📊 Multi-Timeframe Analysis - Set different anchors to compare short-term vs. long-term Fibonacci structures
Tips for Best Results
For cryptocurrency and growth stocks: Always enable "Use Log Scale Calculation" and view your chart in log scale
For precision: Use the manual anchor feature to draw from confirmed swing lows/highs rather than relying on automatic detection
For clean charts: Toggle off levels you don't actively use (e.g., disable 0.786 and 0.886 if you only trade 0.382/0.618)
For screenshots: Enable Unified Color Override and set to grayscale for professional-looking chart exports
Note on Logarithmic Scale
This indicator includes true logarithmic Fibonacci calculations, which are critical when analyzing assets with significant price appreciation. Standard arithmetic Fibonacci tools become increasingly inaccurate on log-scale charts - this indicator solves that problem by calculating levels using logarithmic mathematics when "Use Log Scale Calculation" is enabled.
Disclaimer: This indicator is a tool for technical analysis and does not constitute financial advice. Always perform your own analysis and risk management before making trading decisions.

SITFX_FuturesSpec_v17SITFX_FuturesSpec_v17 – Universal Futures Contract Library
Full-scale futures contract specification library for Pine Script v6. Covers CME, CBOT, NYMEX, COMEX, CFE, Eurex, ICE, and more – including minis, micros, metals, energies, FX, and bonds.
Key Features:
✅ Instrument‑agnostic: ES/MES, NQ/MNQ, YM/MYM, RTY/M2K, metals, energies, FX, bonds
✅ Full contract data: Tick size, tick value, point value, margins
✅ Continuation‑safe: Single‑line logic, no arrays or continuation errors
✅ Foundation for SITFX tools: Gann, Fibs, structure, and risk modules
Usage example:
import SITFX_FuturesSpec_v17/1 as fs
spec = fs.get(syminfo.root)
label.new(bar_index, high, str.format("{0}: Tick={1}, Value=${2}", spec.name, spec.tickSize, spec.tickValue))

ICT OTE StrategyStrategy Overview
This strategy is designed to automate a specific trading setup based on the concepts of Inner Circle Trader (ICT). Its primary goal is to identify significant market structure swings, frame a Fibonacci retracement over the most recent price leg, and execute a trade when the price pulls back to a key user-defined level. It is a counter-trend entry strategy, meaning it looks to enter a trade during a pullback within an established trend.
How It Works: Step-by-Step
1. Swing Detection:
The strategy first identifies significant swing highs and swing lows.
A swing high is confirmed only if it's higher than a specific number of bars to its left and right (defined by "Left Strength" and "Right Strength" in the settings).
The same logic applies to swing lows, which must be lower than the bars around them. This filtering ensures only structurally important turning points are considered.
2. Defining the Trading Range:
Once a new swing is confirmed, the strategy defines the most recent dealing range.
If a new swing high forms, the range is drawn from the previous swing low up to this new high. This is considered a bullish leg.
If a new swing low forms, the range is drawn from the previous swing high down to this new low. This is considered a bearish leg.
3. Fibonacci Retracement & Trade Setup:
An automatic Fibonacci retracement tool is drawn over this newly defined dealing range. The 0.0 level is placed at the end of the move, and the 1.0 level is at the beginning.
The strategy then prepares to enter a trade based on this range.
4. Trade Execution:
Entry: A limit order is placed at a specific Fibonacci level within the range, waiting for the price to retrace. The default entry is the 0.618 level, but this can be changed in the settings.
For a bullish leg, it places a LONG (Buy) order, anticipating that the price will bounce from the retracement level.
For a bearish leg, it places a SHORT (Sell) order, anticipating that the price will be rejected from the retracement level.
Stop Loss: The Stop Loss is automatically placed at the 1.0 level of the Fibonacci range. This is the point where the original trade idea is invalidated.
Take Profit: The Take Profit is automatically placed at the 0.0 level of the Fibonacci range. This is the target at the end of the price leg.
Key Features & Customization
Automated Trade Logic: The entire process, from identifying the setup to placing the entry, stop loss, and take profit, is fully automated.
Visual Aid: The script draws the swing points and the Fibonacci retracement on the chart, so you can visually confirm the setups the strategy is taking.
Customizable Entry: You can change the "Entry Level" in the settings to test different Fibonacci levels, such as the Optimal Trade Entry (OTE) at 0.705.
Toggle Visuals: You can turn the Fibonacci drawing on or off to keep your chart clean while still allowing the strategy to run in the background.

Fibonacci Sequence Moving Average [BackQuant]Fibonacci Sequence Moving Average with Adaptive Oscillator
1. Overview
The Fibonacci Sequence Moving Average indicator is a two‑part trading framework that combines a custom moving average built from the famous Fibonacci number set with a fully featured oscillator, normalisation engine and divergence suite. The moving average half delivers an adaptive trend line that respects natural market rhythms, while the oscillator half translates that trend information into a bounded momentum stream that is easy to read, easy to compare across assets and rich in confluence signals. Everything from weighting logic to colour palettes can be customised, so the tool comfortably fits scalpers zooming into one‑minute candles as well as position traders running multi‑month trend following campaigns.
2. Core Calculation
Fibonacci periods – The default length array is 5, 8, 13, 21, 34. A single multiplier input lets you scale the whole family up or down without breaking the golden‑ratio spacing. For example a multiplier of 3 yields 15, 24, 39, 63, 102.
Component averages – Each period is passed through Simple Moving Average logic to produce five baseline curves (ma1 through ma5).
Weighting methods – You decide how those five values are blended:
• Equal weighting treats every curve the same.
• Linear weighting applies factors 1‑to‑5 so the slowest curve counts five times as much as the fastest.
• Exponential weighting doubles each step for a fast‑reacting yet still smooth line.
• Fibonacci weighting multiplies each curve by its own period value, honouring the spirit of ratio mathematics.
Smoothing engine – The blended average is then smoothed a second time with your choice of SMA, EMA, DEMA, TEMA, RMA, WMA or HMA. A short smoothing length keeps the result lively, while longer lengths create institution‑grade glide paths that act like dynamic support and resistance.
3. Oscillator Construction
Once the smoothed Fib MA is in place, the script generates a raw oscillator value in one of three flavours:
• Distance – Percentage distance between price and the average. Great for mean‑reversion.
• Momentum – Percentage change of the average itself. Ideal for trend acceleration studies.
• Relative – Distance divided by Average True Range for volatility‑aware scaling.
That raw series is pushed through a look‑back normaliser that rescales every reading into a fixed −100 to +100 window. The normalisation window defaults to 100 bars but can be tightened for fast markets or expanded to capture long regimes.
4. Visual Layer
The oscillator line is gradient‑coloured from deep red through sky blue into bright green, so you can spot subtle momentum shifts with peripheral vision alone. There are four horizontal guide lines: Extreme Bear at −50, Bear Threshold at −20, Bull Threshold at +20 and Extreme Bull at +50. Soft fills above and below the thresholds reinforce the zones without cluttering the chart.
The smoothed Fib MA can be plotted directly on price for immediate trend context, and each of the five component averages can be revealed for educational or research purposes. Optional bar‑painting mirrors oscillator polarity, tinting candles green when momentum is bullish and red when momentum is bearish.
5. Divergence Detection
The script automatically looks for four classes of divergences between price pivots and oscillator pivots:
Regular Bullish, signalling a possible bottom when price prints a lower low but the oscillator prints a higher low.
Hidden Bullish, often a trend‑continuation cue when price makes a higher low while the oscillator slips to a lower low.
Regular Bearish, marking potential tops when price carves a higher high yet the oscillator steps down.
Hidden Bearish, hinting at ongoing downside when price posts a lower high while the oscillator pushes to a higher high.
Each event is tagged with an ℝ or ℍ label at the oscillator pivot, colour‑coded for clarity. Look‑back distances for left and right pivots are fully adjustable so you can fine‑tune sensitivity.
6. Alerts
Five ready‑to‑use alert conditions are included:
• Bullish when the oscillator crosses above +20.
• Bearish when it crosses below −20.
• Extreme Bullish when it pops above +50.
• Extreme Bearish when it dives below −50.
• Zero Cross for momentum inflection.
Attach any of these to TradingView notifications and stay updated without staring at charts.
7. Practical Applications
Swing trading trend filter – Plot the smoothed Fib MA on daily candles and only trade in its direction. Enter on oscillator retracements to the 0 line.
Intraday reversal scouting – On short‑term charts let Distance mode highlight overshoots beyond ±40, then fade those moves back to mean.
Volatility breakout timing – Use Relative mode during earnings season or crypto news cycles to spot momentum surges that adjust for changing ATR.
Divergence confirmation – Layer the oscillator beneath price structure to validate double bottoms, double tops and head‑and‑shoulders patterns.
8. Input Summary
• Source, Fibonacci multiplier, weighting method, smoothing length and type
• Oscillator calculation mode and normalisation look‑back
• Divergence look‑back settings and signal length
• Show or hide options for every visual element
• Full colour and line width customisation
9. Best Practices
Avoid using tiny multipliers on illiquid assets where the shortest Fibonacci window may drop under three bars. In strong trends reduce divergence sensitivity or you may see false counter‑trend flags. For portfolio scanning set oscillator to Momentum mode, hide thresholds and colour bars only, which turns the indicator into a heat‑map that quickly highlights leaders and laggards.
10. Final Notes
The Fibonacci Sequence Moving Average indicator seeks to fuse the mathematical elegance of the golden ratio with modern signal‑processing techniques. It is not a standalone trading system, rather a multi‑purpose information layer that shines when combined with market structure, volume analysis and disciplined risk management. Always test parameters on historical data, be mindful of slippage and remember that past performance is never a guarantee of future results. Trade wisely and enjoy the harmony of Fibonacci mathematics in your technical toolkit.

Fibonacci Trend [ChartPrime]Fibonacci Trend Indicator
This powerful indicator leverages supertrend analysis to detect market direction while overlaying dynamic Fibonacci levels to highlight potential support, resistance, and optimal trend entry zones. With its straightforward design, it is perfect for traders looking to simplify their workflow and enhance decision-making.
⯁ KEY FEATURES AND HOW TO USE
⯌ Supertrend Trend Identification :
The indicator uses a supertrend algorithm to identify market direction. It displays purple for downtrends and green for uptrends, ensuring quick and clear trend analysis.
⯌ Fibonacci Levels for Current Swings :
Automatically calculates Fibonacci retracement levels (0.236, 0.382, 0.618, 0.786) for the current swing leg.
- These levels act as key zones for potential support, resistance, and trend continuation.
- The high and low swing points are labeled with exact prices, ensuring clarity.
- If the swing range is insufficient (less than five times ATR), Fibonacci levels are not displayed, avoiding irrelevant data.
⯌ Extended Fibonacci Levels :
User-defined extensions project Fibonacci levels into the future, aiding traders in planning price targets or projecting key zones.
⯌ Optimal Trend Entry Zone :
A filled area between 0.618 and 0.786 levels visually highlights the optimal entry zone for trend continuation. This allows traders to refine their entry points during pullbacks.
⯌ Diagonal Trend Line :
A dashed diagonal line connects the swing high and low, visually confirming the range and trend strength of the current swing.
⯌ Visual Labels for Fibonacci Levels :
Each Fibonacci level is marked with a label displaying its value for quick reference.
⯁ HOW TRADERS CAN POTENTIALLY USE THIS TOOL
Fibonacci Retracements:
Use the Fibonacci retracement levels to find key support or resistance zones where the price may pull back before continuing its trend.
Example: Enter long trades when the price retraces to 0.618–0.786 levels in an uptrend.
Fibonacci Extensions:
Use Fibonacci extensions to project future price targets based on the current trend's swing leg. Levels like 127.2% and 161.8% are commonly used as profit-taking zones.
Reversal Identification:
Spot potential reversals by monitoring price reactions at key Fibonacci retracement levels (e.g., 0.236 or 0.382) or the swing high/low.
Optimal Trend Entries:
The filled zone between 0.618 and 0.786 is a statistically strong area for entering a position in the direction of the trend.
Example: Enter long positions during retracements to this range in an uptrend.
Risk Management:
Set stop-losses below key Fibonacci levels or the swing low/high, and take profits at extension levels, enhancing your trade management strategies.
⯁ CONCLUSION
The Fibonacci Trend Indicator is a straightforward yet effective tool for identifying trends and key Fibonacci levels. It simplifies analysis by integrating supertrend-based trend identification with Fibonacci retracements, extensions, and optimal entry zones. Whether you're a beginner or experienced trader, this indicator is an essential addition to your toolkit for trend trading, reversal spotting, and risk management.

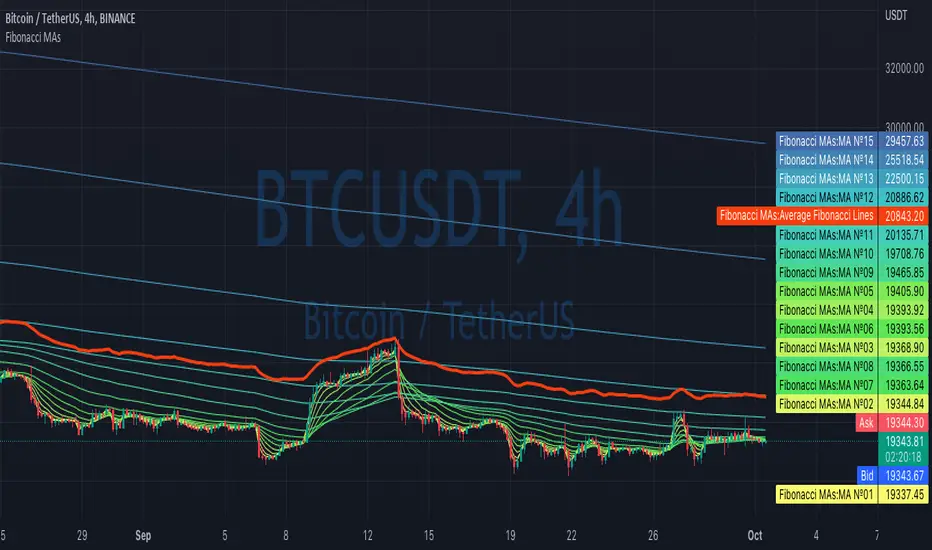
Fibonacci Moving Average PlusFibonacci Moving Average Plus is a sophisticated technical indicator that employs the first 15 numbers of the Fibonacci sequence to create dynamic moving average channels. This indicator aims to capture both immediate and long-term price movements by calculating Exponential Moving Averages (EMAs) based on these Fibonacci values. By using Fibonacci-based moving averages for both high and low price points, the indicator generates a visual channel that reflects the ebb and flow of market trends, acting as potential zones of support and resistance. Additionally, the indicator provides midline, retracement, and extension levels rooted in Fibonacci ratios, which are frequently observed as key levels for reversals or trend continuation.
Ideology Behind Using Fibonacci Sequence-Based Moving Averages
The Fibonacci sequence, known for its mathematical harmony and prevalence in natural patterns, is widely utilized in technical analysis to identify potential turning points in markets. In this indicator, the first 15 Fibonacci numbers (5, 8, 13, 21, etc.) are used as the lookback periods for EMAs to capture different layers of market sentiment. These moving averages represent timeframes that are theoretically in alignment with the natural rhythms of market cycles, where key levels—often coinciding with Fibonacci numbers—can act as magnetic points for price.
The Fibonacci high and low channels aim to encapsulate price action, giving traders a sense of whether the market is trending, consolidating, or experiencing reversal pressure. These levels, grounded in both mathematics and market psychology, help traders spot areas where price might face resistance or find support.
Key Features
Fibonacci Moving Average High and Low: This indicator calculates the high and low EMAs based on Fibonacci sequence numbers (e.g., 5, 8, 13, etc.) for enhanced trend analysis.
Golden Pocket Retracement (GPR) and Extension (GPE) Bands: Displays common Fibonacci retracement and extension levels (0.618, 0.65 for retracement, and 1.618, 1.65 for extension).
Midline: Plots the average of the Fibonacci high and low to act as an additional reference level.
Stop-Loss Levels: Provides suggested stop-loss levels based on Fibonacci levels for both long and short positions.
Basic User Guide
Adjust Input Settings:
Input Timeframe: Set a specific timeframe for the Fibonacci moving average calculation, separate from the chart's primary timeframe.
Show Fibonacci MA High/Low: Toggle the visibility of the high and low Fibonacci moving averages.
Show Mid Line: Display a midline for added trend reference.
Show Golden Pocket Bands: Choose to display retracement or extension bands for potential support or resistance zones.
Show Stop-Loss Levels: Enable to visualize potential stop-loss levels for both long and short trades.
Interpretation:
Fibonacci MA High and Low: Use these lines to gauge the general trend. When the price is above both, it may indicate an uptrend; below both, a downtrend.
Golden Pocket Retracement: This zone (between 0.618 and 0.65) is often a key level for potential reversals or support/resistance.
Golden Pocket Extension: The 1.618 and 1.65 levels can indicate potential profit-taking or trend exhaustion points.
Stop-Loss Levels: The calculated stop-loss levels (long SL below and short SL above) can aid in risk management.
Customization:
You can customize the appearance and visibility of each component through the input settings to fit your specific strategy and visual preferences.
This indicator should be used alongside other technical analysis tools to provide a more comprehensive trading approach.
This Indicator would not exist without the original contributions and blessing from Sofien Kaabar

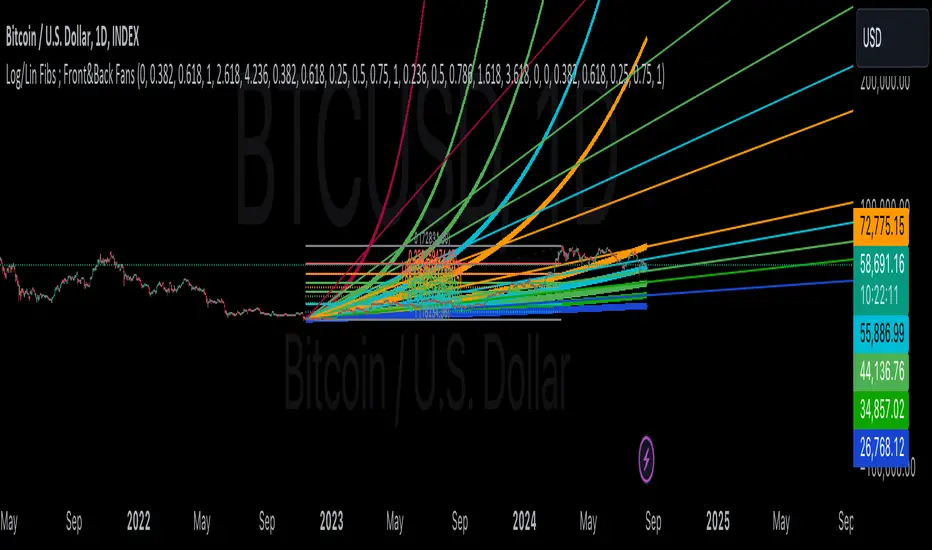
Linear and Logarithmic Fibonacci Levels and (Price&Time) FansIntroduction
The Fibonacci Retracement tool is a go-to for traders looking to spot potential support and resistance levels. By measuring the distance between swing highs and lows, you can apply Fibonacci ratios like 0.236, 0.382, and 0.618 to predict key market levels.
Traditionally, these levels are set by dividing this distance into equal parts—known as Linear Levels. A more refined approach, Logarithmic Price and Time Levels, divides the distance into proportionally equal segments. Plus, this indicator now includes Fibonacci fans, adding another layer of analysis by projecting potential price levels using trendlines based on Fibonacci ratios.
This tool makes it easier to identify both Linear and Logarithmic levels while also leveraging Fibonacci fans for a more complete market view.
Applications
Logarithmic Levels and Fibonacci fans are ideal for volatile markets. In crypto, they’re especially effective for BTCUSDT (check out the wick from January 23, 2024). They also help spot accumulation and distribution patterns in high-volume altcoins like FETUSDT . In traditional markets, they’re useful for tracking stocks like TSLA and NVDA with extreme price swings, as well as indices in inflation-affected markets like XU100 , or recession-hit currency pairs like JPYUSD .
How to Use
This indicator is intuitive and similar to TradingView’s Fibonacci Tool. Select your reference levels (Level 1 and Level 0), then tweak the settings to customize your analysis, including adding Fibonacci fans for extra insights.
Why It’s Different
Unlike TradingView’s tool, which forces you to switch to a logarithmic scale (messing with other indicators and trend lines), this indicator lets you view both Linear and Logarithmic levels—and Fibonacci fans on Price and Time Series—without changing your chart’s scale. The original Fibonacci Code was derived from zekicanozkanli, modified and upgraded to plot fib front and back fans as well. Due to TV Max Plot restrictions I need to publish just Front and Back and Front Fibs separately.
Multi Pivot (S/R) & Previous Period (OHLC)█ Multi Pivot (Support/Resistance) & Previous Period (Open/High/Low/Close)
The previous script was deleted because of a copyrighted word.
From JayRogers description.
█ Multi Pivot Selector
Allows you to set up to 3 distinct sets of pivots, each with their own resolution settings and the ability to select how many support|resistance levels are shown.
The maximum amount of S|R levels available varies with different pivot types, the options available are:
Traditional
Fibonacci
Woodie
Classic
Copyrighted word
Camarilla
Fibonacci Extended
█ Previous Period Levels
A simple but highly customisable display of previous higher time-frame OHLC values.
Customised resolution input which excludes time frames lower than 1 hour while extending the common higher reference inputs.
This script is based on JayRogers script, I only added some features so please check out his script.
I added the timeframe in the labels, in order to make it easier to differentiate when using multiple pivot set.
As well as making it possible to change the lines color of each pivot set separately.
Labels can now be displayed on each side (right, left and both) or just disabled.
The type of pivot can be shown on the right side.
Lines extension can be disabled and lines width value can be changed.
I also added another one of his script to display OHLC levels, I made similar changes.
Converted to Pine Script v5.
Previous Period Levels - X Alerts
Pivotal - Multi Pivot Selector (which was also deleted because of the copyrighted word)

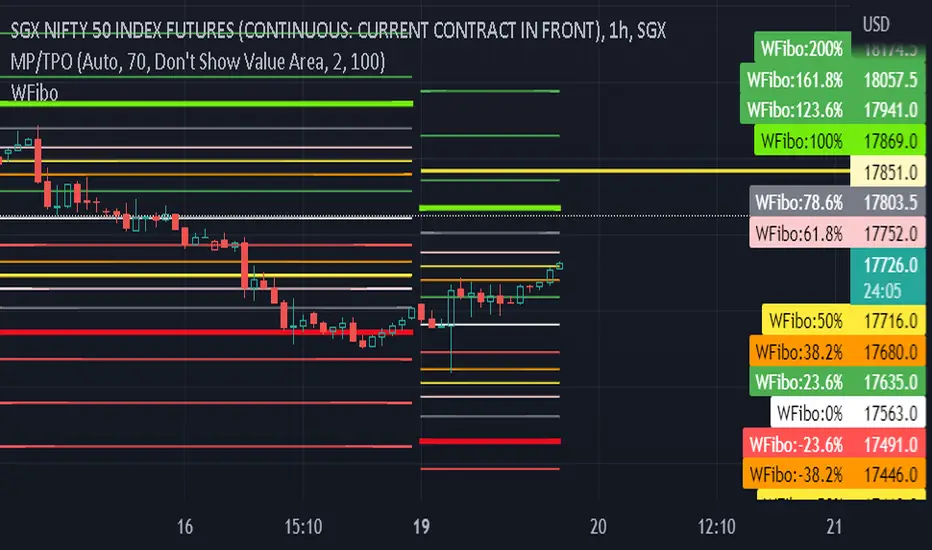
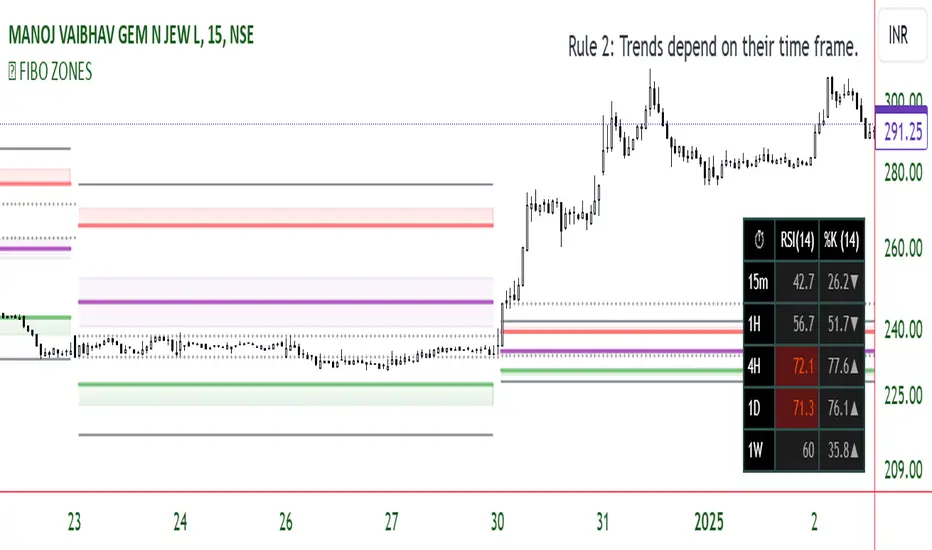
FIBO ZONESThe "Fibonacci ZONES" indicator combines Fibonacci ratio-derived zones(channels), together with a Fibonacci pattern of the Previous period high/low.
Auto Fibonacci tools are powerful ways designed to simplify your technical analysis by automatically drawing Fibonacci retracement and extension levels on your chart. This indicator is built to enhance your trading experience with clearer market moves and informative insights.
You can easily spot your waves and patterns when the percentages are moving with you.
Key Features:
Automated Fibonacci Levels: Plots Fibonacci retracement and extension levels based on recent price movements.
Multi-Timeframe Support: This indicator is your versatile companion, offering multi-timeframe functionality. You can seamlessly track Fibonacci levels across different resolutions, providing a comprehensive view of the market.
Two Types of Fibs: Retracement and Timeframe extension Fibonacci levels. Use retracements to identify potential reversal points and extensions to anticipate price targets, giving you a well-rounded perspective on market movements.
Benefits:
Save Time: No more manual Fibonacci drawing; It does this for you in real-time.
Enhanced Analysis: Gain a deeper understanding of potential support, resistance, and price targets.
User-Friendly: Suitable for traders of all levels, this indicator simplifies complex technical analysis.
Breakouts from a Fibonacci Channel are also indicated by labels, indicating a potential reversal.
Each range extremity/area can also be used as support/resistance.
Higher Fibonacci EMAOverall image:
If the closing price is higher than the three Fibonacci EMAs (uptrend):
Thanks to @ZenAndTheArtOfTrading and his indicator "Higher Timeframe EMA", URL =
This is a trend-discriminating indicator that uses 3 EMAs.
The Williams Alligator is the underlying philosophy, and we have applied it to capture the larger trend.
It is set up for the current time frame + 2 higher time frames.
One of the upper time legs has a daily EMA length of 13 Fibonacci numbers.
The top-level time leg has a weekly EMA with a length of 5 Fibonacci.
If the current closing price of the ticker leg is higher than these three EMAs, the bar color will be green. If it is lower, it will be red. If it is neither, it will be gray.
If the bar color is green, it suggests that the trend is upward. If it is red, you can consider entering short. If it is gray, it is best not to enter anything.

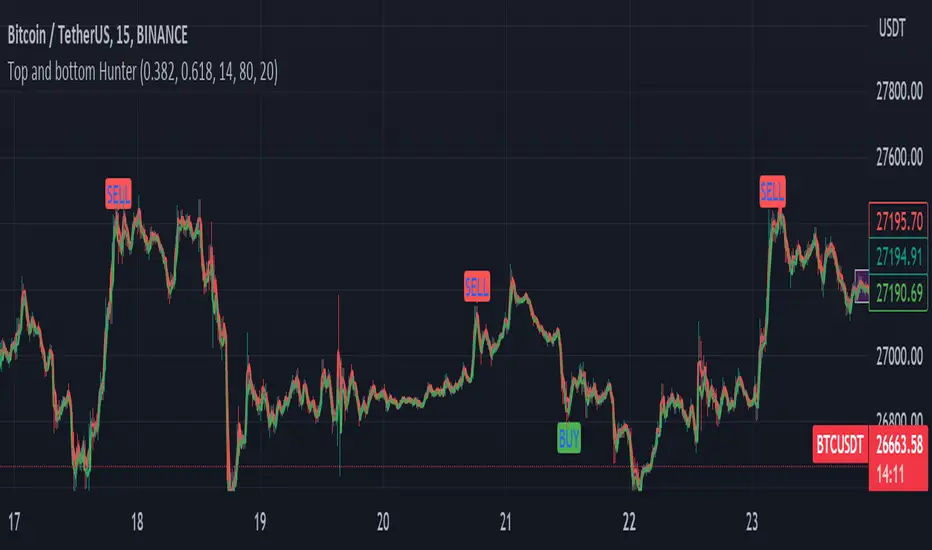
Fib top and bottom Hunter - No Repaint "Top and bottom Hunter" indicator combines two popular technical analysis tools, Fibonacci retracement levels and the Relative Strength Index (RSI), to identify potential trading opportunities in the market.
Fibonacci retracement levels are based on the Fibonacci sequence, a mathematical series where each number is the sum of the two preceding ones. In trading, Fibonacci retracement levels are used to identify potential support and resistance levels based on the recent price action. The indicator uses two Fibonacci levels, fib_0 and fib_1, which are typically set to 0.382 and 0.618, respectively. These levels represent common retracement ratios.
To calculate the Fibonacci levels, the indicator considers the highest and lowest prices within a specified range, typically the highest and lowest of the last two bars. It calculates the fib_range, which is the difference between the highest and lowest prices. Then, fib_level_0 and fib_level_1 are determined by subtracting the Fibonacci ratios from the highest price.
The RSI is a momentum oscillator that measures the speed and change of price movements. It helps identify overbought and oversold conditions in the market. The RSI parameters used in this indicator are rsi_length (length of the RSI calculation), rsi_overbought (upper threshold indicating overbought conditions), and rsi_oversold (lower threshold indicating oversold conditions). The RSI value is calculated based on the closing prices.
The indicator generates buy and sell signals based on specific conditions:
Buy Condition: A buy signal is triggered when the RSI crosses above the oversold level (rsi_oversold) and the closing price is higher than fib_level_1. This indicates a potential reversal or bounce from the Fibonacci support level.
Sell Condition: A sell signal is triggered when the RSI crosses below the overbought level (rsi_overbought) and the closing price is lower than fib_level_0. This suggests a potential reversal or pullback from the Fibonacci resistance level.
In summary, this indicator combines the power of Fibonacci retracement levels and the RSI to identify potential trading opportunities. It helps traders find confluence between the Fibonacci support or resistance levels and the RSI readings, indicating potential trend reversals or bounces. Traders can use this information to make informed decisions about entering or exiting positions in the market.
Feel free to change the settings for what works best for you and use this with other confluences. I personally use RSI overbought and oversold values as 80 and 20
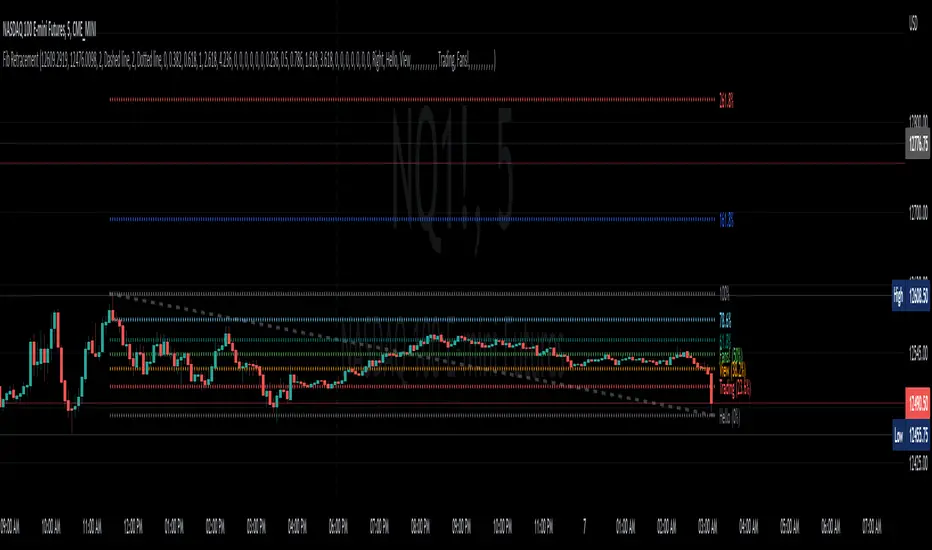
Fib RetracementI've re-created the fib retracement tool as an indicator and this is as close as I can currently get to matching the built-in fib retracement tool.
Why did I make this? For custom labels for every fib retracement level.
Caveats to this vs the built-in tool are:
the "Save as Default" doesn't appear to work (I believe this is due to the interactive/confirm based settings)
copy and paste to another chart is locked into the price of source location
when dragging the points of retracement the tool/indicator disappears
Hopefully some can find usefulness in this code or it's functionality.
Golden PocketGolden Pocket
This marks up the fibonacci retracement levels of 0.65 and 0.618 by default, these levels are often referred to as the golden pocket.
They are known by this because when price has an impulse either to the up or downside, price will end up retracing at some point. This Golden pocket often lines up with other means of confluence where it's considered a good entry price from the retrace.
Unlike standard fib retracement indicators, these boxes will extend with current price until they are hit. As well as this, there is a moving average filter which you can set to higher timeframes meaning that you can choose to only look for golden pockets which are following the higher time frame trend. You can easily monitor all of your settings by setting up just 1 alert.
Settings
You have the option to enable/disable the line which marks out the pivot points the fib is being calculated from, you can also change the colour and style of the line.
Below this you have the option to choose what colour the fib boxes are and what colour they change to once price hits it. If you want them to disappear change the colours opacity to 0%.
If you want to change the golden pocket levels you can do that by changing the 0.618 or 0.65 levels in the settings.
The pivot distance controls what part defines a pivot high or low, it must be the highest/lowest to the left/right of the pivot candle count.
MA filter will only accept golden pockets which are trending with the Moving average.
You can change all the settings of the Moving average which acts as a filter including which timeframe it is calculated on.
Alerts
Simply toggle this on int the settings and then click on the 3 dots next to the indicators name, 'add alert', leave the top boxes as they are, you can name the alert anything you like but once you confirm this, it will monitor all golden pockets on the particular asset and timeframe you are looking at. The alerts are set up to trigger as soon as price touches one of the boxes.
Use Cases
We like setting are moving average up on the daily timeframe and using the Moving average filter so we know we are only trading with the higher timeframe trend. From there we can set up alerts on any lower timeframe.
Feel free to use any part of this script in your own code, please just give us a mention so we can check out your contributions to the community as well!
Happy to take in any suggestions or ways of improving

BasicVisibleChartBasic library for the visible range chart; with functions to allow plotting Fibs from body high/low as well as wick high/low
-Thanks to code from @PineCoders Visible Chart library (PineCoders/VisibleChart/4), which is a much more comprehensive library than this, but which does not include some functions that I find useful:
-Added the following exportable functions: highest/lowest body, highest/lowest close, highest/lowest open. These allow one to anchor fibs from bodies rather than wicks
-Added a Fib Box function in the example code
The above chart shows the example code plotting a Fib range drawn from bodies and a highlighted retracement zone (61.8 % - 78.6% )
~~All Exportable Functions~~
barIsVisible()
highestClose()
highestOpen()
highestBody()
lowestClose()
lowestOpen()
lowestBody()
high()
highBarTime()
low()
lowBarTime()
open()
close()

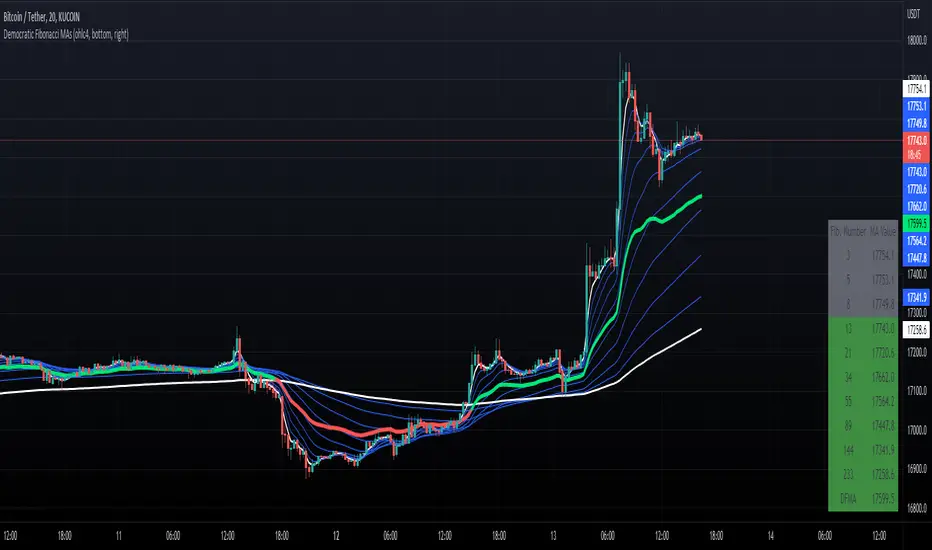
Democratic Fibonacci Moving AveragesWith this indicator, we have taken moving averages at Fibonacci lengths (3 to 233) as well as the average of these values, labeled the DFMA. Additionally, these values have been inputted into a table overlay. The cross of the FibMA(233) and the DFMA can be used as a signal for long or short.
The FibMA lengths of 3 and 233 are plotted in white by default, the FibMAs with lengths between 3 and 233 are plotted in blue by default, and the democratic line (DFMA) that averages these lines is plotted in green or red (depending on if the value is above or below the 233-length FibMA).
Auto Fibo Multi Timeframe [Misu]█ This indicator shows a Multi Timeframe automatic Fibonacci retracement levels.
This indicator is built using pivots from a user-selected timeframe to draw and orient the Fibonacci retracement.
Fibonacci analysis uses a logical sequence of numbers to predict trends and price action.
█ Usages:
The Fibonacci retracement is used to identify hidden support and resistance levels that an investor can use for entry, exit, and stop placement.
Depending on your usage, you can track breakouts above and below retracement levels to provide early entry points for major breakouts and breakdowns.
Higher timeframe Fibs allow you to have more relevant and weighted signals.
█ Features:
Choose Timeframe
Choose Fib levels
Color Fib Levels Individually
Color Fib Levels all in one
█ Parameters:
Timeframe: The Timeframe chosen.
Left Bars: A parameter used to calculate pivots.
Right Bars: A parameter used to calculate pivots.
UI Settings: Select Fibs levels and colors.

Fibonacci MAsIt's a pretty simple script. Idea is to compute MAs with the length of Fibonacci numbers and then compute an average of them all.
In the script, you can choose the type of MAs and how many Fibonacci numbers to use for it.
You can also adjust the length of these MAs manually and choose the color of every one of them.
Thanks to @MUQWISHI for helping me code it.
Disclaimer
Please remember that past performance may not be indicative of future results.
Due to various factors, including changing market conditions, the strategy may no longer perform as well as in historical backtesting.
This post and the script don’t provide any financial advice.
FibonacciLibrary "Fibonacci"
General Fibonacci functions. Get fib numbers, ratios, etc.
fib_precise(f, precision)
Get the precise Fibonacci ratio, to the specified number of decimal places
Parameters:
f : Fibonacci ratio (string, in form #.###)
precision : Number of decimal places (optional int, dft = 16, max = 32)
Returns: Precise Fibonacci ratio (float)
fib_n(n)
Calculate the Nth number in the Fibonacci sequence
Parameters:
n : Index/number in sequence (int)
Returns: Fibonacci number (int)
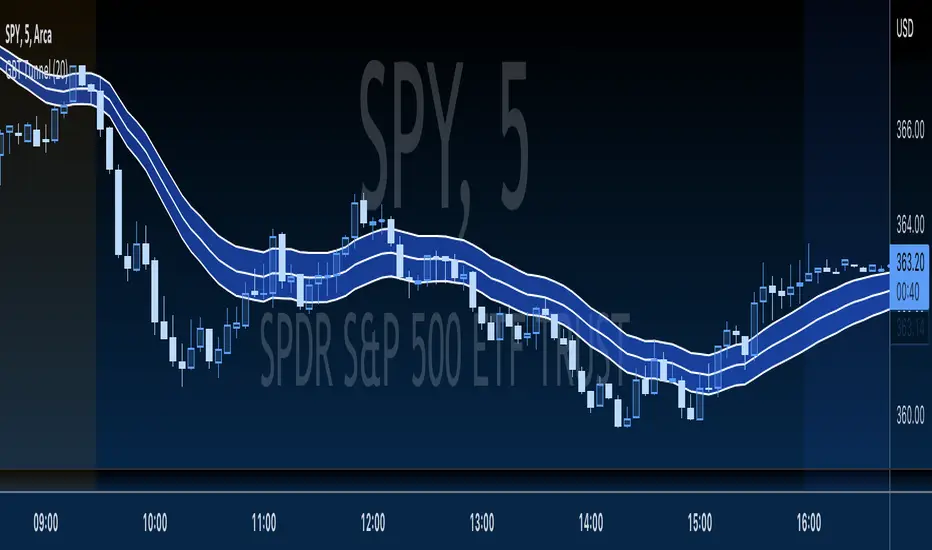
GBT TunnelThis is a channel type tool I created, heavily influenced by LazyBear COG Fibs script and the COG Fibs script by Joy_Bangla which also uses LazyBear COG Fib logic. All credit to those guys, publishing this open source as well since its nothing here is my original work really.
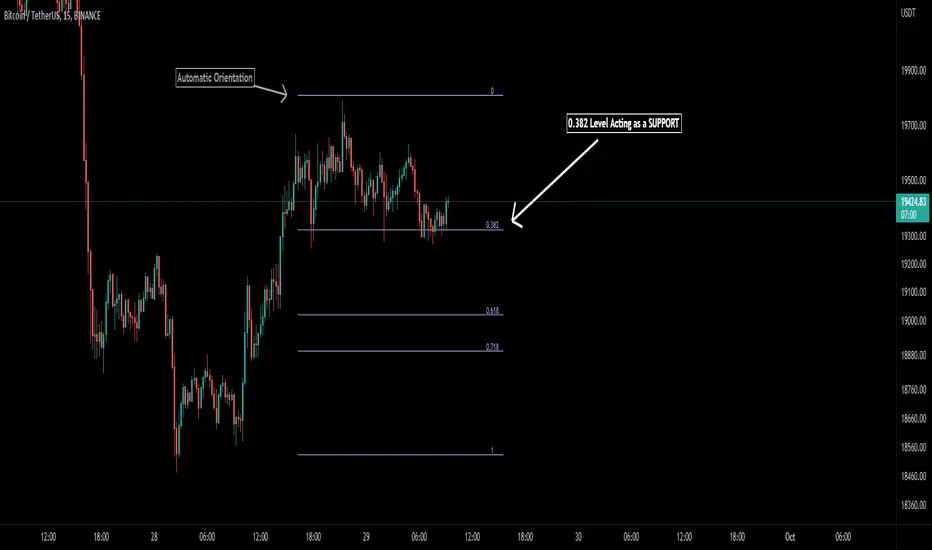
Auto Fibonacci [Misu]█ This indicator shows an automatic Fibonacci retracement levels.
This indicator is designed based on highs, lows, and trend interpretation to orientate the fibonacci retracement in the good direction.
Fibonacci analysis uses a logical sequence of numbers to predict trends and price action.
█ Usages:
The Fibonacci retracement is used to identify hidden support and resistance levels that an investor can use for entry, exit, and stop placement.
Depending on your usage, you can track breakouts above and below retracement levels to provide early entry points for major breakouts and breakdowns.
█ Features:
> Choose Fib levels
> Color Fib Levels all in one
> Color Fib Levels Individually
█ Parameters:
Deviation: A parameter used to calculate pivots.
Depth: A parameter used to calculate pivots.
UI Settings: Select Fibs levels and colors.
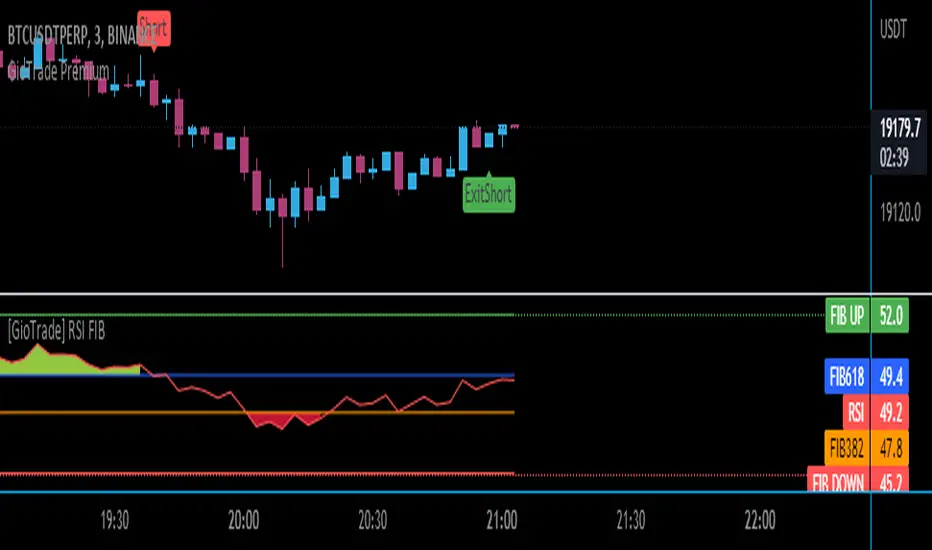
RSI FIB [G I O]BINANCE:BTCUSDT
A free indicator where you can see the fibonacci levels of the RSI.
Giotrade is aware of the importance of the RSI in trading and offers a new indicator that can guide you to conduct free market analysis.
The red and green zones warn of overbought and oversold, allowing you to predict the direction of price volatility.
Fibonacci Ratios with Volatility(Weekly Time Frame.)Script is based on weekly time Frame. Fib ratios are drawn at the Open of the Market. Open price is compared with Previous week High , low and close. If weekly open is above Previous week high or low, Fib 0 % is plotted above High or the low as the case may be . If weekly open is between previous week high and low Fib 0% is equal to previous week Close and other fib ratios are plotted accordingly. As its vol based, works fantastically. This script is inspired by Fibonacci and Volatility script by PB GHOSH.