VIX Term Structure Pro [v7.0 Enhanced]# VIX Term Structure Pro v7.0
[! (img.shields.io)](www.tradingview.com)
[! (img.shields.io)](www.tradingview.com)
[! (img.shields.io)](LICENSE)
**Professional VIX-based Market Sentiment & Timing Indicator**
专业的 VIX 市场情绪与择时指标
---
## 🌟 Overview / 概述
VIX Term Structure Pro is an advanced multi-factor market timing indicator that analyzes the VIX futures term structure, volatility regime, and market breadth to generate actionable buy/sell signals.
VIX Term Structure Pro 是一款高级多因子市场择时指标,通过分析 VIX 期货期限结构、波动率区间及市场广度,生成可操作的买卖信号。
---
## 🚀 Key Features / 核心功能
### 📊 Multi-Factor Scoring System / 多因子评分系统
- **Term Structure Z-Score**: Measures deviation from historical mean / 期限结构 Z 分数:衡量与历史均值的偏离
- **VIX/VX1 Basis**: Spot premium detection for panic signals / VIX 现货溢价:恐慌信号检测
- **Contango Analysis**: Futures curve shape insights / 期货升水分析
- **SKEW Integration**: Options skew for tail risk / SKEW 整合:尾部风险监测
- **Put/Call Ratio**: Sentiment extremes / 看跌/看涨比率:情绪极端
- **VVIX Support**: Volatility of volatility (optional) / VVIX 支持:波动率的波动率
### 🎯 Three-Tier Signal System / 三级信号系统
| Signal | Score | Description |
|--------|-------|-------------|
| 🚨 **CRASH BUY** | ≥ 6 | Extreme panic, rare opportunity / 极端恐慌,罕见机会 |
| 🟢 **STRONG BUY** | ≥ 5 | Multi-factor confluence / 多因子共振 |
| 🟡 **BUY DIP** | ≥ 4 | Accumulate on weakness / 逢低吸纳 |
| 🟠 **SELL/HEDGE** | ≤ -2 | Consider reducing risk / 考虑减仓对冲 |
| 🔴 **STRONG SELL** | ≤ -5 | Strong bearish signals / 强烈看跌信号 |
| 🔥 **EUPHORIA SELL** | ≤ -6 | Extreme greed, sell signal / 极度贪婪,卖出信号 |
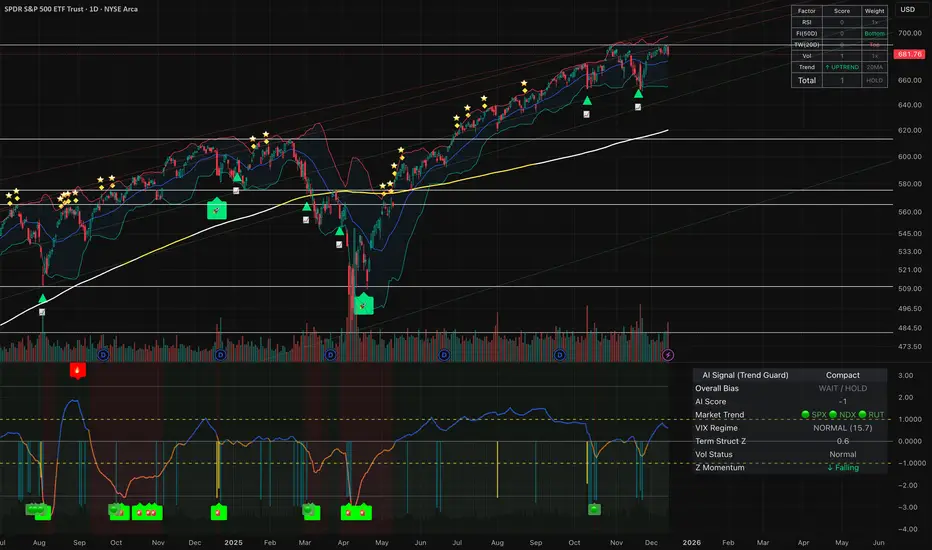
### 📈 Dashboard Indicators / 仪表盘指标解读
| Indicator | Bullish 🟢 | Bearish 🔴 |
|-----------|------------|------------|
| Overall Bias | STRONG BUY / BUY DIP | STRONG SELL / SELL/HEDGE |
| AI Score | ≥ 5 (Extreme Fear) | ≤ -5 (Extreme Greed) |
| Market Trend | 🟢SPX 🟢NDX (Above MA200) | 🔴SPX 🔴NDX (Below MA200) |
| VIX Regime | LOW VOL (<15) | HIGH VOL (>25) |
| Term Struct Z | < -2.0 (Panic) | > 2.0 (Complacency) |
---
## ⚙️ Configuration / 配置选项
### 📡 Data Sources / 数据源
- **VIX Symbol**: Default `CBOE:VIX` (Alternative: `TVC:VIX`)
- **Put/Call Ratio**: Default `INDEX:CPCI` (Index P/C)
- **Timeframe**: Daily (stable) or Chart (real-time)
### ⚠️ Strategy Mode / 策略模式
- **High (Scalping)**: Sensitive, for short-term trades / 高敏感,短线
- **Normal (Swing)**: Balanced approach / 平衡模式
- **Low (Trend/Safe)**: Conservative, trend-following / 保守,趋势跟踪
### 🔬 Backtest Mode / 回测模式
- **OFF (Real-time)**: Shows current day data, suitable for live monitoring / 显示当日数据,适合实盘监控
- **ON (Historical)**: Uses only confirmed data, avoids look-ahead bias / 仅使用已确认数据,避免未来函数
---
## 📖 Usage Guide / 使用指南
### Best Practices / 最佳实践
1. **Apply to SPX/SPY/QQQ daily charts** for optimal signal accuracy
在 SPX/SPY/QQQ 日线图上使用,信号准确度最佳
2. **Wait for next trading day** to execute signals (signals trigger on daily close)
信号触发后在下一交易日执行(信号基于日线收盘)
3. **Use in conjunction with price action** for confirmation
结合价格走势确认信号
4. **Enable Market Trend Filter** (MA200) for safer entries in uncertain markets
开启趋势过滤(MA200)以在不确定市场中更安全入场
### Signal Interpretation / 信号解读
```
🚨 CRASH BUY (Score ≥ 6)
→ Rare extreme panic event
→ Historical average return: significant positive over 2 months
→ Consider aggressive positioning
🟢 STRONG BUY (Score ≥ 5)
→ Multiple indicators align
→ Historical average return: positive over 1 month
→ Consider building positions
🟡 BUY DIP (Score ≥ 4)
→ Moderate fear detected
→ Suitable for adding to existing positions
→ Filtered out in bear markets if Trend Filter is ON
```
---
## 📊 Historical Statistics / 历史统计
The indicator tracks signal frequency and average subsequent returns:
- **CRASH BUY**: 40-day return period (~2 months)
- **STRONG BUY**: 20-day return period (~1 month)
- **BUY DIP**: 10-day return period (~2 weeks)
指标追踪信号频率和后续平均收益,可在仪表盘中查看历史统计。
---
## 🔔 Alerts / 警报
Built-in alert conditions with cooldown mechanism to prevent spam:
| Alert | Condition |
|-------|-----------|
| Crash Buy Alert | Score ≥ 6, extreme panic |
| Strong Buy Alert | Score ≥ 5, multi-factor confluence |
| Buy Dip Alert | Score ≥ threshold |
| Euphoria Sell Alert | Score ≤ -6, extreme greed |
| Strong Sell Alert | Score ≤ -5 |
| VIX Basis Panic | VIX spot premium spike |
---
## 📋 Changelog / 更新日志
### v7.0 (Current)
- ✨ Three-tier buy/sell signal system
- 📊 Signal statistics with average return tracking
- 🔬 Backtest Mode toggle for historical testing
- 🎨 Configurable ±1 Z-Score reference lines
- ⚡ Modular scoring functions
- 🛡️ Dual index trend display (SPX + NDX)
- 📱 Compact & Full dashboard modes
---
## ⚠️ Disclaimer / 免责声明
**English:**
This indicator is for educational and informational purposes only. It does not constitute financial advice. Past performance does not guarantee future results. Always do your own research and consider your risk tolerance before trading.
**中文:**
本指标仅供教育和信息参考,不构成投资建议。过往表现不代表未来收益。交易前请自行研究并评估风险承受能力。
---
## 📄 License / 许可证
MIT License - Feel free to use, modify, and share.
---
## 🤝 Contributing / 贡献
Issues and pull requests are welcome!
欢迎提交问题和贡献代码!
---
**Made with ❤️ for the trading community**
**为交易社区用心打造**
Fear
VixTrixVixTrix - Because markets move in both directions.
VixTrix was born from a fundamental limitation in traditional volatility indicators: they only measure downside panic, completely missing the greed-driven extremes that form market tops.
How It Works:
Dual-Component Analysis:
vixBear = Panic selling intensity (distance from recent highs)
vixBull = FOMO buying intensity (distance from recent lows)
Oscillator = vixBear - vixBull = Net fear/greed imbalance
When the oscillator is positive, fear dominates (potential bottom forming). When negative, greed dominates (potential top forming).
Professional-Grade Filtering:
The magic happens with the symmetric RMS (Root Mean Square) bands. Unlike fixed percentage bands or standard deviation, RMS:
Creates mathematically symmetric positive/negative thresholds
Naturally adapts to changing volatility regimes
Provides statistical significance to extremes
VixTrix also adds selectable MA smoothing for the RMS calculation:
WMA (default): Balanced – middle-ground approach
VWMA: Volume-weighted – filters low-volume noise
EMA: Responsive – catches quick reversals
SMA: Stable – for swing trading
HMA: Fast and smooth – ideal for day trading
Signals require triple confirmation:
Statistical Extreme: Oscillator beyond RMS band
Price Action Confirmation: Correct candle color (bullish for bottoms, bearish for tops)
Momentum Continuation: Oscillator still moving toward extreme (exhaustion)
This multi-filter approach reduces premature entries and false signals while maintaining early positioning at potential reversal points.
Why This Matters for Your Trading:
In bull markets, traditional fear indicators sit near zero, giving no warning of impending tops.
VixTrix identifies when greed becomes excessive – when FOMO buying reaches statistical extremes that often precede corrections.
In range-bound markets, VixTrix excels at identifying overreactions in both directions, providing high-probability mean reversion opportunities.
During crashes, it captures the panic selling with the same precision as VixFix, but with better timing through its momentum confirmation.
VixTrix spots continuations through:
"No Signal" = Healthy Trend – Oscillator stays between RMS bands (no exhaustion)
Failed Extremes – Touches band but no triple confirmation = trend likely continues
Hidden Divergence – Price makes higher low while oscillator makes shallower low = uptrend continues
Controlled Emotions – Oscillator negative but not extreme in uptrends (greed present but not excessive)
Key Insight: When VixTrix doesn't give a signal during a pullback, institutions aren't panicking – they're just pausing before resuming the trend.
Green columns = Bullish exhaustion (potential bottoms)
Red columns = Bearish exhaustion (potential tops)
Golden RMS bands = Dynamic thresholds adapting to current volatility
Background highlights = Active signal conditions
The Result: A professional-grade oscillator that works in all market conditions – trending up, trending down, or ranging – by measuring the complete emotional spectrum driving price action.

ALT Risk Strategy with Fear & Greed + ISM PMI📊 Overview
This advanced crypto trading strategy combines multiple macro indicators to identify optimal buy and sell zones for altcoins. It tracks the relationship between altcoin performance versus Bitcoin (ALT/BTC pairs) while incorporating broader market sentiment and economic data to generate risk-adjusted entry and exit signals.
🎯 Core Methodology
Base Risk Metric (65% weight):
MACD Momentum (5%): Normalized trend strength on weekly ALT/BTC pair
RSI (60%): Relative strength indicating overbought/oversold conditions
Price Deviation (35%): Distance from 150-period moving average
Fear & Greed Index (20% weight):
Analyzes market sentiment using multiple factors:
Price momentum and rate of return
Money flow and volume analysis
Volatility metrics (crypto: BVOL24H, traditional: VIX)
Dominance indicators (crypto: BTC.D, traditional: Gold)
Two modes: Crypto-focused or Traditional markets
Customizable smoothing and weighting
US ISM PMI Integration (15% weight):
Manufacturing economic indicator (contraction vs expansion)
PMI < 50 = Economic weakness = Better crypto buying opportunities
PMI > 50 = Economic strength = Risk-on environment
Configurable offset to lead/lag the signal
Daily data smoothed over customizable period
💰 Trading Logic
Tiered Buy System:
Level 1 (Risk < 70): Initial entry with conservative amount
Level 2 (Risk < 50): Double down as risk decreases
Level 3 (Risk < 30): Maximum accumulation at extreme lows
All purchases customizable by dollar amount
Tiered Sell System:
Level 1 (Risk > 70): Take partial profits (default 25%)
Level 2 (Risk > 85): Continue scaling out (default 35%)
Level 3 (Risk > 100): Final exit (default 40%)
Sells reset when new buys occur (can re-accumulate)
⚙️ Key Features
Multi-Asset Support: ETH, SOL, ADA, LINK, UNI, XRP, DOGE, AVAX, MATIC, RENDER, or custom
Exchange Selection: Works with Binance, Coinbase, Kraken, Bitfinex, Bybit
3Commas Integration: Optional webhook alerts for automated bot trading
Visual Risk Zones: Color-coded indicator (green/lime/yellow/orange/red/maroon)
Real-time Info Table: Displays current risk metric, F&G index, PMI value, weights, and position status
Flexible Weighting: Adjust influence of each component (Base/F&G/PMI)
Weekly Timeframe: Reduces noise and focuses on macro trends
📈 Use Cases
DCA Strategy: Dollar-cost averaging with intelligent timing
Swing Trading: Catching major market cycles (weeks to months)
Risk Management: Exit before major downturns, enter during fear
Macro Trading: Align crypto positions with economic conditions
Bot Automation: Connect to 3Commas for hands-free execution
🎓 Credits & Attribution
Original Concept & Base Risk Metric:
Inspired by community-developed ALT/BTC risk oscillators
Fear & Greed methodology adapted from crypto market sentiment research
Enhancements & Integration:
ISM PMI integration and weighting system
Multi-indicator combination framework
Tiered buy/sell logic with reset mechanism
3Commas webhook integration
Development:
Primary Development: Claude AI (Anthropic)
Collaboration & Testing: User feedback and iteration
Pine Script Implementation: TradingView v5
⚠️ Disclaimer
This strategy is for educational and informational purposes only. Past performance does not guarantee future results. Cryptocurrency trading involves substantial risk of loss. Always conduct your own research and consider your risk tolerance before trading. The strategy uses lagging indicators (weekly timeframe) which may not react quickly to sudden market changes.
🔧 Recommended Settings
For better performance than default conservative settings:
Increase buy amounts: Try $50/$75/$100 for more meaningful positions
Adjust thresholds: Consider 40/60/80 for more frequent entries
Test different weights: Experiment with F&G and PMI influence
Optimize for your asset: Different cryptos may require different parameters
Version: 1.0
Last Updated: December 2025
Compatible With: TradingView Pine Script v5

MILLION MEN - Greed Fear MatrixWhat it is
MILLION MEN — Greed Fear Matrix is a sentiment oscillator based on a Stochastic Momentum Index (SMI) core with optional smart percentile levels, an EMA signal line, HTF filter, histogram, and lightweight emoji markers for tops/bottoms/warnings. It’s a context tool, not a buy/sell signal generator.
How it works
SMI core: computes SMI (K/D smoothing + signal EMA).
Levels: choose fixed Greed/Fear bands or Smart Levels (percentiles over a configurable lookback).
Fills & histogram: shaded regions above/below bands; histogram = SMI − Signal.
HTF filter (optional): confirm bias via higher timeframe (midline or signal rule).
Emoji pivots & lite divergence: labels at SMI pivots beyond bands; simple price/SMI divergence on the last two pivots.
How to use
Greed zone suggests crowd chasing / potential exhaustion; Fear zone suggests panic/liquidity pockets.
Use crossings (SMI vs bands / SMI vs Signal) and HTF bias as confluence, not standalone entries.
Tune percentile thresholds, lookback, and HTF timeframe to your market and style.
Originality & value
Unlike standard SMI/RSI overlays, this matrix adds percentile-driven adaptive levels, HTF validation, and on-chart context (fills/emoji/mini-divergence) to keep sentiment readable across regimes while staying lightweight and non-repainting.
Tested markets
Primarily tested on Gold (XAUUSD) . Behavior on other markets may vary; validate before use.
Limitations
Extremes can persist in strong trends; always add structure/volume confirmation.
Non-standard chart types aren’t supported for signal logic.
No future data is used; this is not financial advice.
Arabic summary (optional)
أداة زخم/معنويات مبنية على SMI مع مستويات ثابتة أو ذكية (Percentiles)، خط إشارة، فلتر إطار أعلى، تظليل للمناطق، وإيموجي للقمم/القيعان، ودايفرجنس خفيف. الهدف تحليل سياقي وليس إشارات بيع/شراء. مُجرّبة أساسًا على Gold (XAUUSD) وقد يختلف السلوك في أسواق أخرى.

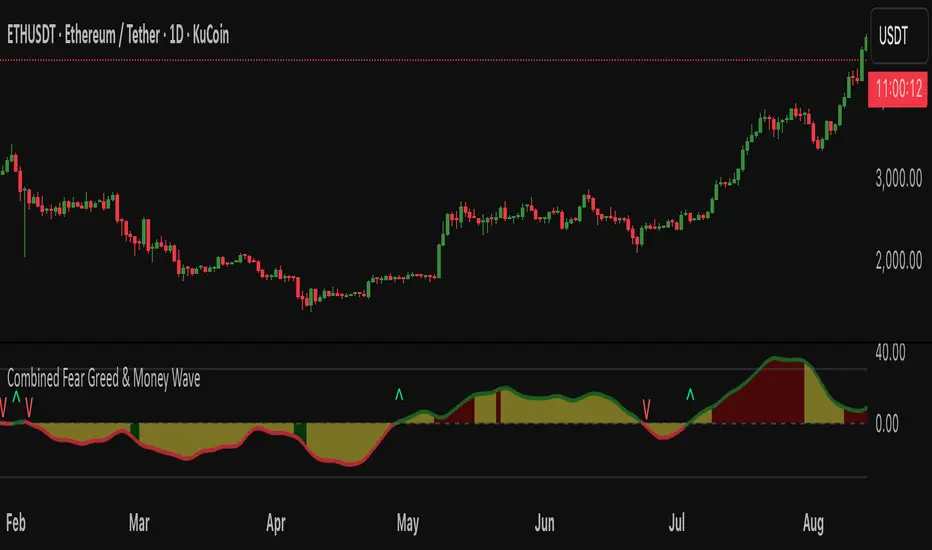
Fear Greed zones and Money Waves FusedThis indicator, named "Fear Greed zones and Money Waves" combines a smoothed Money Flow Index (MFI)-based wave and the Relative Strength Index (RSI) to visualize market sentiment through fear and greed zones and generate buy/sell signals.
Core Functions
- It calculates a zero-centered and smoothed version of the MFI (MoneyWave) using configurable smoothing methods (SMA, EMA, RMA) with parameters for length and smoothing intensity.
- It uses RSI to define fear and greed zones based on user-defined thresholds (e.g., RSI below 30 indicates fear, above 70 indicates greed).
- The MoneyWave area is color-coded based on these fear/greed RSI zones: dark green for fear, dark red for greed, and yellow neutral.
- The edge line of the MoneyWave shows bullish (lime) when above zero and bearish (red) when below zero.
Visual Elements
- Plots the MoneyWave as a colored area with an edge line.
- Displays horizontal lines representing the zero line and upper/lower bounds derived from MFI thresholds.
- Optionally shows direction change arrows when the MoneyWave sign changes and labels indicating BUY or SELL signals based on MoneyWave crossing zero combined with fear/greed conditions.
Trading Signals and Alerts
- Buy signal triggers when MoneyWave crosses upward through zero while in the fear zone (RSI low).
- Sell signal triggers when MoneyWave crosses downward through zero while in the greed zone (RSI high).
- Alerts can be generated for these buy/sell events.
In summary, this indicator provides a combined measure of money flow momentum (MoneyWave) with market sentiment zones (fear and greed from RSI), helping identify potential market entry and exit points with visual markers and alerts .
Ticker Pulse Meter + Fear EKG StrategyDescription
The Ticker Pulse Meter + Fear EKG Strategy is a technical analysis tool designed to identify potential entry and exit points for long positions based on price action relative to historical ranges. It combines two proprietary indicators: the Ticker Pulse Meter (TPM), which measures price positioning within short- and long-term ranges, and the Fear EKG, a VIX-inspired oscillator that detects extreme market conditions. The strategy is non-repainting, ensuring signals are generated only on confirmed bars to avoid false positives. Visual enhancements, such as optional moving averages and Bollinger Bands, provide additional context but are not core to the strategy's logic. This script is suitable for traders seeking a systematic approach to capturing momentum and mean-reversion opportunities.
How It Works
The strategy evaluates price action using two key metrics:
Ticker Pulse Meter (TPM): Measures the current price's position within short- and long-term price ranges to identify momentum or overextension.
Fear EKG: Detects extreme selling pressure (akin to "irrational selling") by analyzing price behavior relative to historical lows, inspired by volatility-based oscillators.
Entry signals are generated when specific conditions align, indicating potential buying opportunities. Exits are triggered based on predefined thresholds or partial position closures to manage risk. The strategy supports customizable lookback periods, thresholds, and exit percentages, allowing flexibility across different markets and timeframes. Visual cues, such as entry/exit dots and a position table, enhance usability, while optional overlays like moving averages and Bollinger Bands provide additional chart context.
Calculation Overview
Price Range Calculations:
Short-Term Range: Uses the lowest low (min_price_short) and highest high (max_price_short) over a user-defined short lookback period (lookback_short, default 50 bars).
Long-Term Range: Uses the lowest low (min_price_long) and highest high (max_price_long) over a user-defined long lookback period (lookback_long, default 200 bars).
Percentage Metrics:
pct_above_short: Percentage of the current close above the short-term range.
pct_above_long: Percentage of the current close above the long-term range.
Combined metrics (pct_above_long_above_short, pct_below_long_below_short) normalize price action for signal generation.
Signal Generation:
Long Entry (TPM): Triggered when pct_above_long_above_short crosses above a user-defined threshold (entryThresholdhigh, default 20) and pct_below_long_below_short is below a low threshold (entryThresholdlow, default 40).
Long Entry (Fear EKG): Triggered when pct_below_long_below_short crosses under an extreme threshold (orangeEntryThreshold, default 95), indicating potential oversold conditions.
Long Exit: Triggered when pct_above_long_above_short crosses under a profit-taking level (profitTake, default 95). Partial exits are supported via a user-defined percentage (exitAmt, default 50%).
Non-Repainting Logic: Signals are calculated using data from the previous bar ( ) and only plotted on confirmed bars (barstate.isconfirmed), ensuring reliability.
Visual Enhancements:
Optional moving averages (SMA, EMA, WMA, VWMA, or SMMA) and Bollinger Bands can be enabled for trend context.
A position table displays real-time metrics, including open positions, Fear EKG, and Ticker Pulse values.
Background highlights mark periods of high selling pressure.
Entry Rules
Long Entry:
TPM Signal: Occurs when the price shows strength relative to both short- and long-term ranges, as defined by pct_above_long_above_short crossing above entryThresholdhigh and pct_below_long_below_short below entryThresholdlow.
Fear EKG Signal: Triggered by extreme selling pressure, when pct_below_long_below_short crosses under orangeEntryThreshold. This signal is optional and can be toggled via enable_yellow_signals.
Entries are executed only on confirmed bars to prevent repainting.
Exit Rules
Long Exit: Triggered when pct_above_long_above_short crosses under profitTake.
Partial exits are supported, with the strategy closing a user-defined percentage of the position (exitAmt) up to four times per position (exit_count limit).
Exits can be disabled or adjusted via enable_short_signal and exitPercentage settings.
Inputs
Backtest Start Date: Defines the start of the backtesting period (default: Jan 1, 2017).
Lookback Periods: Short (lookback_short, default 50) and long (lookback_long, default 200) periods for range calculations.
Resolution: Timeframe for price data (default: Daily).
Entry/Exit Thresholds:
entryThresholdhigh (default 20): Threshold for TPM entry.
entryThresholdlow (default 40): Secondary condition for TPM entry.
orangeEntryThreshold (default 95): Threshold for Fear EKG entry.
profitTake (default 95): Exit threshold.
exitAmt (default 50%): Percentage of position to exit.
Visual Options: Toggle for moving averages and Bollinger Bands, with customizable types and lengths.
Notes
The strategy is designed to work across various timeframes and assets, with data sourced from user-selected resolutions (i_res).
Alerts are included for long entry and exit signals, facilitating integration with TradingView's alert system.
The script avoids repainting by using confirmed bar data and shifted calculations ( ).
Visual elements (e.g., SMA, Bollinger Bands) are inspired by standard Pine Script practices and are optional, not integral to the core logic.
Usage
Apply the script to a chart, adjust input settings to suit your trading style, and use the visual cues (entry/exit dots, position table) to monitor signals. Enable alerts for real-time notifications.
Designed to work best on Daily timeframe.

VIX bottom/top with color scale [Ox_kali]📊 Introduction
━━━━━━━━━━━━━━━━━━━━━━━━━━━━━━━━━━━━━━━━━━━
The “VIX Bottom/Top with Color Scale” script is designed to provide an intuitive, color-coded visualization of the VIX (Volatility Index), helping traders interpret market sentiment and volatility extremes in real time.
It segments the VIX into clear threshold zones, each associated with a specific market condition—ranging from fear to calm—using a dynamic color-coded system.
This script offers significant value for the following reasons:
Intuitive Risk Interpretation: Color-coded zones make it easy to interpret market sentiment at a glance.
Dynamic Trend Detection: A 200-period SMA of the VIX is plotted and dynamically colored based on trend direction.
Customization and Flexibility: All colors are editable in the parameters panel, grouped under “## Color parameters ##”.
Visual Clarity: Key thresholds are marked with horizontal lines for quick reference.
Practical Trading Tool: Helps identify high-risk and low-risk environments based on volatility levels.
🔍 Key Indicators
━━━━━━━━━━━━━━━━━━━━━━━━━━━━━━━━━━━━━━━━━━━
VIX (CBOE Volatility Index) : Measures market volatility and investor fear.
SMA 200 : Long-term trendline of the VIX, with color-coded direction (green = uptrend, red = downtrend).
Color-coded VIX Levels:
🔴 33+ → Something bad just happened
🟠 23–33 → Something bad is happening
🟡 17–23 → Something bad might happen
🟢 14–17 → Nothing bad is happening
✅ 12–14 → Nothing bad will ever happen
🔵 <12 → Something bad is going to happen
🧠 Originality and Purpose
━━━━━━━━━━━━━━━━━━━━━━━━━━━━━━━━━━━━━━━━━━━
Unlike traditional VIX indicators that only plot a line, this script enhances interpretation through visual segmentation and dynamic trend tracking.
It serves as a risk-awareness tool that transforms the VIX into a simple, emotional market map.
This is the first version of the script, and future updates may include alerts, background fills, and more advanced features.
⚙️ How It Works
━━━━━━━━━━━━━━━━━━━━━━━━━━━━━━━━━━━━━━━━━━━
The script maps the current VIX value to a range and applies the corresponding color.
It calculates a SMA 200 and colors it green or red depending on its slope.
It displays horizontal dotted lines at key thresholds (12, 14, 17, 23, 33).
All colors are configurable via input parameters under the group: "## Color parameters ##".
🧭 Indicator Visualization and Interpretation
━━━━━━━━━━━━━━━━━━━━━━━━━━━━━━━━━━━━━━━━━━━
The VIX line changes color based on market condition zones.
The SMA line shows long-term direction with dynamic color.
Horizontal threshold lines visually mark the transitions between volatility zones.
Ideal for quickly identifying periods of fear, caution, or stability.
🛠️ Script Parameters
━━━━━━━━━━━━━━━━━━━━━━━━━━━━━━━━━━━━━━━━━━━
Grouped under “## Color parameters ##”, the following elements are customizable:
🎨 VIX Zone Colors:
33+ → Red
23–33 → Orange
17–23 → Yellow
14–17 → Light Green
12–14 → Dark Green
<12 → Blue
📈 SMA Colors:
Uptrend → Green
Downtrend → Red
These settings allow users to match the script’s visuals to their preferred chart style or theme.
✅ Conclusion
━━━━━━━━━━━━━━━━━━━━━━━━━━━━━━━━━━━━━━━━━━━
The “VIX Bottom/Top with Color Scale” is a clean, powerful script designed to simplify how traders view volatility.
By combining long-term trend data with real-time color-coded sentiment analysis, this script becomes a go-to reference for managing risk, timing trades, or simply staying in tune with market mood.
🧪 Notes
━━━━━━━━━━━━━━━━━━━━━━━━━━━━━━━━━━━━━━━━━━━
This is version 1 of the script. More features such as alert conditions, background fill, and dashboard elements may be added soon. Feedback is welcome!
💡 Color code concept inspired by the original VIX interpretation chart by @nsquaredvalue on Twitter. Big thanks for the visual clarity! 💡
⚠️ Disclaimer
━━━━━━━━━━━━━━━━━━━━━━━━━━━━━━━━━━━━━━━━━━━
This script is a visual tool designed to assist in market analysis. It does not guarantee future performance and should be used in conjunction with proper risk management. Past performance is not indicative of future results.

Crypto Fear and GreedThe Crypto Fear and Greed indicator is a custom Pine Script (version 6) indicator designed to measure market sentiment in the cryptocurrency market. It combines three main components: volatility, momentum, and volume, to create a composite score ranging from 0 to 100.
Interpretation
- 0-20: Extreme Fear** - The market is in a state of panic, potentially indicating a buying opportunity for contrarian investors.
- 20-40 : Fear** - Investors are cautious, but not panicking.
- 40-60: Neutral** - The market sentiment is balanced.
- 60-80: Greed** - Investors are becoming optimistic, potentially indicating overbought conditions.
- 80-100: Extreme Greed** - The market is euphoric, potentially indicating a selling opportunity for contrarian investors.
Limitations
1. The indicator uses the TOTAL3 cryptocurrency market cap data, which may not perfectly represent individual cryptocurrency movements.
2. Historical data limitations may affect the accuracy of the volume component, especially when first applying the indicator to a chart.
3. The indicator is based on technical factors and does not account for fundamental or external market influences.

Candle Emotion Index (CEI) StrategyThe Candle Emotion Index (CEI) Strategy is an innovative sentiment-based trading approach designed to help traders identify and capitalize on market psychology. By analyzing candlestick patterns and combining them into a unified metric, the CEI Strategy provides clear entry and exit signals while dynamically managing risk. This strategy is ideal for traders looking to leverage market sentiment to identify high-probability trading opportunities.
How It Works
The CEI Strategy is built around three core oscillators that reflect key emotional states in the market:
Indecision Oscillator . Measures market uncertainty using patterns like Doji and Spinning Tops. High values indicate hesitation, signaling potential turning points.
Fear Oscillator . Tracks bearish sentiment through patterns like Shooting Star, Hanging Man, and Bearish Engulfing. Helps identify moments of intense selling pressure.
Greed Oscillator . Detects bullish sentiment using patterns like Marubozu, Hammer, Bullish Engulfing, and Three White Soldiers. Highlights periods of strong buying interest.
These oscillators are averaged into the Candle Emotion Index (CEI):
CEI = (Indecision + Fear + Greed) / 3
This single value quantifies overall market sentiment and drives the strategy’s trading decisions.
Key Features
Sentiment-Based Trading Signals . Long Entry: Triggered when the CEI crosses above a lower threshold (e.g., 0.1), indicating increasing bullish sentiment. Short Entry: Triggered when the CEI crosses above a higher threshold (e.g., 0.2), signaling rising bearish sentiment.
Volume Confirmation . Trades are validated only if volume exceeds a user-defined multiplier of the average volume over the lookback period. This ensures entries are backed by significant market activity.
Break-Even Recovery Mechanism . If a trade moves into a loss, the strategy attempts to recover to break-even instead of immediately exiting at a loss. This feature provides flexibility, allowing the market to recover while maintaining disciplined risk management.
Dynamic Risk Management . Maximum Holding Period: Trades are closed after a user-defined number of candles to avoid overexposure to prolonged uncertainty. Profit-Taking Conditions: Positions are exited when favorable price moves are confirmed by increased volume, locking in gains. Loss Threshold: Trades are exited early if the price moves unfavorably beyond a set percentage of the entry price, limiting potential losses.
Cooldown Period . After a trade is closed, a cooldown period prevents immediate re-entry, reducing overtrading and improving signal quality.
Why Use This Strategy?
The CEI Strategy combines advanced sentiment analysis with robust trade management, making it a powerful tool for traders seeking to understand market psychology and identify high-probability setups. Its unique features, such as the break-even recovery mechanism and volume confirmation, add an extra layer of discipline and reliability to trading decisions.
Best Practices
Combine with Other Indicators . Use trend-following tools (e.g., moving averages, ADX) and momentum oscillators (e.g., RSI, MACD) to confirm signals.
Align with Key Levels . Incorporate support and resistance levels for refined entries and exits.
Multi-Market Compatibility . Apply this strategy to forex, crypto, stocks, or any asset class with strong volume and price action.

Candle Emotion Index (CEI)The Candle Emotion Index (CEI) is a comprehensive sentiment analysis indicator that combines three sub-oscillators—Indecision Oscillator, Fear Oscillator, and Greed Oscillator—to provide a single, unified measure of market sentiment. By analyzing bullish, bearish, and indecisive candlestick patterns, the CEI delivers a holistic view of market emotions and helps traders identify key turning points.
How It Works
Indecision Oscillator: Measures market uncertainty using Doji and Spinning Top candlestick patterns. Scores their presence and normalizes the results over a user-defined lookback period.
Fear Oscillator: Measures bearish sentiment using Shooting Star, Hanging Man, and Bearish Engulfing candlestick patterns. Scores their presence and normalizes the results over a user-defined lookback period.
Greed Oscillator: Measures bullish sentiment using Marubozu, Bullish Engulfing, Hammer, and Three White Soldiers candlestick patterns. Scores their presence and normalizes the results over a user-defined lookback period.
Candle Emotion Index Calculation: The CEI is calculated as the average of the Indecision, Fear, and Greed Oscillators: CEI = (Indecision Oscillator + Fear Oscillator + Greed Oscillator) / 3
Plotting: The CEI is plotted as a single line on the chart, representing overall market sentiment.
Reference lines are added to indicate Low Emotion, Neutral, and High Emotion levels.
The Candle Emotion Index provides a unified perspective on market sentiment by blending indecision, fear, and greed into one easy-to-interpret metric. It serves as a powerful tool for traders seeking to gauge market psychology and identify high-probability trading opportunities. For best results, use the CEI in conjunction with other technical indicators to confirm signals.

Fear/Greed Zone Reversals [UAlgo]The "Fear/Greed Zone Reversals " indicator is a custom technical analysis tool designed for TradingView, aimed at identifying potential reversal points in the market based on sentiment zones characterized by fear and greed. This indicator utilizes a combination of moving averages, standard deviations, and price action to detect when the market transitions from extreme fear to greed or vice versa. By identifying these critical turning points, traders can gain insights into potential buy or sell opportunities.
🔶 Key Features
Customizable Moving Averages: The indicator allows users to select from various types of moving averages (SMA, EMA, WMA, VWMA, HMA) for both fear and greed zone calculations, enabling flexible adaptation to different trading strategies.
Fear Zone Settings:
Fear Source: Select the price data point (e.g., close, high, low) used for Fear Zone calculations.
Fear Period: This defines the lookback window for calculating the Fear Zone deviation.
Fear Stdev Period: This sets the period used to calculate the standard deviation of the Fear Zone deviation.
Greed Zone Settings:
Greed Source: Select the price data point (e.g., close, high, low) used for Greed Zone calculations.
Greed Period: This defines the lookback window for calculating the Greed Zone deviation.
Greed Stdev Period: This sets the period used to calculate the standard deviation of the Greed Zone deviation.
Alert Conditions: Integrated alert conditions notify traders in real-time when a reversal in the fear or greed zone is detected, allowing for timely decision-making.
🔶 Interpreting Indicator
Greed Zone: A Greed Zone is highlighted when the price deviates significantly above the chosen moving average. This suggests market sentiment might be leaning towards greed, potentially indicating a selling opportunity.
Fear Zone Reversal: A Fear Zone is highlighted when the price deviates significantly below the chosen moving average of the selected price source. This suggests market sentiment might be leaning towards fear, potentially indicating a buying opportunity. When the indicator identifies a reversal from a fear zone, it suggests that the market is transitioning from a period of intense selling pressure to a more neutral or potentially bullish state. This is typically indicated by an upward arrow (▲) on the chart, signaling a potential buy opportunity. The fear zone is characterized by high price volatility and overselling, making it a crucial point for traders to consider entering the market.
Greed Zone Reversal: Conversely, a Greed Zone is highlighted when the price deviates significantly above the chosen moving average. This suggests market sentiment might be leaning towards greed, potentially indicating a selling opportunity. When the indicator detects a reversal from a greed zone, it indicates that the market may be moving from an overbought condition back to a more neutral or bearish state. This is marked by a downward arrow (▼) on the chart, suggesting a potential sell opportunity. The greed zone is often associated with overconfidence and high buying activity, which can precede a market correction.
🔶 Why offer multiple moving average types?
By providing various moving average types (SMA, EMA, WMA, VWMA, HMA) , the indicator offers greater flexibility for traders to tailor the indicator to their specific trading strategies and market preferences. Different moving averages react differently to price data and can produce varying signals.
SMA (Simple Moving Average): Provides an equal weighting to all data points within the specified period.
EMA (Exponential Moving Average): Gives more weight to recent data points, making it more responsive to price changes.
WMA (Weighted Moving Average): Allows for custom weighting of data points, providing more flexibility in the calculation.
VWMA (Volume Weighted Moving Average): Considers both price and volume data, giving more weight to periods with higher trading volume.
HMA (Hull Moving Average): A combination of weighted moving averages designed to reduce lag and provide a smoother curve.
Offering multiple options allows traders to:
Experiment: Traders can try different moving averages to see which one produces the most accurate signals for their specific market.
Adapt to different market conditions: Different market conditions may require different moving average types. For example, a fast-moving market might benefit from a faster moving average like an EMA, while a slower-moving market might be better suited to a slower moving average like an SMA.
Personalize: Traders can choose the moving average that best aligns with their personal trading style and risk tolerance.
In essence, providing a variety of moving average types empowers traders to create a more personalized and effective trading experience.
🔶 Disclaimer
Use with Caution: This indicator is provided for educational and informational purposes only and should not be considered as financial advice. Users should exercise caution and perform their own analysis before making trading decisions based on the indicator's signals.
Not Financial Advice: The information provided by this indicator does not constitute financial advice, and the creator (UAlgo) shall not be held responsible for any trading losses incurred as a result of using this indicator.
Backtesting Recommended: Traders are encouraged to backtest the indicator thoroughly on historical data before using it in live trading to assess its performance and suitability for their trading strategies.
Risk Management: Trading involves inherent risks, and users should implement proper risk management strategies, including but not limited to stop-loss orders and position sizing, to mitigate potential losses.
No Guarantees: The accuracy and reliability of the indicator's signals cannot be guaranteed, as they are based on historical price data and past performance may not be indicative of future results.

Fear and Greed Index (Crypto & Stock)The Fear and Greed Index utilizes various metrics to gauge the overall sentiment of the stock and crypto market.
It's divided into two categories:
Extreme Fear (0-25) -> Red background
Extreme Greed (75-100) -> Green background
When the index is in the Extreme Fear zone, the indicator background changes to red, while in the Extreme Greed zone, it changes to green.
The blue line represents the Fear and Greed Index for the overall stock or crypto market. The index automatically switches between the crypto and stock depending on the active chart, providing insights into both markets.
The histogram represents Price Momentum for the current active symbol on the chart.
How is the Crypto Fear and Greed Index calculated?
The index is calculated using three factors including momentum of stable coin (safe haven), momentum of major coins, and the balance of unique addresses holding the major coins. The index tracks how much these individual indicators deviate from their averages compared to how much they normally diverge. The index gives each factor equal weighting in calculating a score from 0 to 100, with 100 representing maximum greediness and 0 signaling maximum fear.
The main factors used in the calculation are:
1. Momentum of Stable Coins
The index calculates the momentum of three major stable coins, including USDT, USDC and DAI. The index looks at the stable coins’ levels compared to where they’ve been over the past two months. When the stable coin is below its moving average of the prior 60 trading days, that’s a sign of positive momentum. But if the index is above this average, it shows investors are getting skittish. The Fear & Greed Index uses the growing momentum of stable coin as a signal for Fear and a slowing momentum for Greed.
During a market sell-off, investors may anticipate a decline in the value of their cryptocurrency investments and may transition into stable coins as a safe haven. This is because stable coins are designed to maintain a stable value, often pegged to a fiat currency like the US Dollar.
By analyzing the overall trend of stable coins' movement, the index can help determine whether the market sentiment leans towards greed or fear. If stable coins are experiencing a significant increase in momentum, it may suggest that investors are moving away from riskier assets (like cryptocurrencies) and into safer assets (like stable coins), indicating a fear-driven market sentiment. Conversely, if stable coins are experiencing a decrease in momentum, it may suggest that investors are more confident in the market and are less concerned about potential declines in the value of their cryptocurrency investments, indicating a greed-driven market sentiment.
2. Momentum of major coins
The index calculates the momentum of 16 major cryptocurrencies, including Bitcoin, Ethereum, and BNB. This index assesses the overall trend of these cryptocurrencies' movement, which can provide insights into market sentiment. The index checks how many coins are doing well versus those that are struggling. This shows the number of coins on the market at 2-months highs compared to those at 2-months lows. When there are many more highs than lows, that’s a bullish sign and signals Greed.
By analyzing the momentum of these 16 major cryptocurrencies, the index can help determine whether there's more bullish or bearish sentiment prevailing in the market over the given period. If the overall momentum is positive, it may suggest that investors are more optimistic about the market, leading to increased buying activity and higher prices. Conversely, if the overall momentum is negative, it may suggest that investors are more pessimistic about the market, leading to increased selling activity and lower prices.
3. Balance of unique addresses holding major coins
The index is tracking the number of unique addresses holding Bitcoin and Ethereum. This measure looks at the amount of investors holding Bitcoin or Ethereum and compares the amount to its 2-month moving average.
The logic behind this assessment is that when there are more unique addresses holding Bitcoin and Ethereum, it suggests that more individuals are interested in holding these cryptocurrencies, which may indicate bullish sentiment. Conversely, when there are fewer unique addresses holding Bitcoin and Ethereum, it suggests that fewer individuals are interested in holding these cryptocurrencies, which may indicate bearish sentiment.
How is the Stock Fear and Greed Index calculated?
The Stock Fear & Greed Index is a compilation of two indicators that measure some aspect of stock market behavior. They are market momentum and stock price strength. The Stock Fear & Greed Index calculates how much these individual indicators deviate from their averages and compares this divergence to their typical variations. Both indicators receive equal weighting in calculating a score ranging from 0 to 100.
A score of 100 indicates maximum greediness, suggesting that market momentum and stock prices are significantly above their historical averages.
Conversely, a score of 0 signals maximum fear, indicating that market momentum and stock prices are significantly below their historical averages.
1. Market Momentum
The Stock Fear & Greed index looks at stock market levels compared to where they’ve been over the past few months. When the S&P 500, DJI and NASDAQ is above its moving average of the prior 180 trading days, that’s a sign of positive momentum. But if the index is below this average, it shows investors are getting skittish. The Fear & Greed Index uses slowing momentum as a signal for Fear and a growing momentum for Greed.
2. Momentum of major stocks
The index calculates momentum by analyzing the price levels of major stocks relative to their moving averages over the past six months. When a stock's price is above its moving average of the prior 180 trading days, it indicates positive momentum. Conversely, if the stock's price is below this moving average, it suggests that investors are becoming skittish, or there is a loss of momentum.
How to use the Fear and Greed Index?
The Fear & Greed Index ranges from 0 to 100, a reading of 0-25 indicates extreme fear, while a reading of 75-100 indicates extreme greed. The index can help investors and traders identify market trends and potential turning points. By understanding the sentiment of the market, investors can avoid making decisions based on emotions and biases.
When the Fear and Greed Index is at an extreme level of fear (0-25), it can indicate that investors are overly worried and selling their assets out of fear. This could present a buying opportunity for investors who believe in the long-term potential of the market.
Conversely, when the Fear and Greed Index is at an extreme level of greed (75-100), it can indicate that investors are overly optimistic and buying assets out of greed. This could be a sign that the market is due for a correction.
How is the Price Momentum (Histogram) calculated?
Momentum focuses on the rate of change in stock prices over a specific period. It assesses how quickly prices are moving in a particular direction, whether upward or downward. A momentum value above 50 indicates that prices are fueled by strength to move upward. This suggests that buying pressure is dominant in the market, driving prices higher. Conversely, a momentum value below 50 indicates that prices are fueled by strength moving downward. This suggests that selling pressure is dominant, pushing prices lower.
Our momentum indicator can help investors identify trends and potential turning points in the market. Rising momentum values may indicate an upward trend, while declining momentum values may suggest a weakening trend or a potential reversal.
Extreme momentum values may indicate overbought or oversold conditions in the market. Overbought conditions occur when momentum values are excessively high, suggesting that prices may be due for a correction. Conversely, oversold conditions occur when momentum values are excessively low, indicating potential buying opportunities.
How to use our Fear & Greed Indicator
Using price momentum and the Fear and Greed Index together can provide valuable confirmation signals for investors in the stock or crypto market. Here's how you can use them together:
Identify Trends: Start by identifying the overall trend in the market using price momentum. Rising momentum values often indicate an uptrend, while declining momentum values suggest a downtrend.
Monitor Fear and Greed Index: Simultaneously, monitor the Fear and Greed Index to gauge market sentiment. In an uptrend, high readings on the Fear and Greed Index (75-100) may indicate excessive greed among investors, potentially signaling that the uptrend is becoming overextended and due for a correction. Conversely, in a downtrend, low readings on the Fear and Greed Index (0-25) may indicate extreme fear, potentially signaling capitulation and a possible reversal.
Look for Confirmation Signals: Look for confirmation signals between price momentum and the Fear and Greed Index. For example:
In an uptrend, if momentum is declining while the Fear and Greed Index is at a high level, it may suggest weakening buying pressure and potential exhaustion in the uptrend.
In a downtrend, if momentum is reducing while the Fear and Greed Index is at a low level, it may indicate that selling pressure is subsiding, potentially signaling a reversal in the downtrend.

YinYang Fear and Greed Index (FGI)Overview:
YinYang Fear and Greed Index is used for seeing how people are feeling towards the current price. It works similar to an RSI, but fluctuates differently. Essentially you want to be Greedy when the Index displays Fear and Fearful when it displays Greed. Our Indicator displays a Green Circle (Greed Signal) on the YinYang Fear and Greed Index when there is a large amount of Greed at this price point. It displays a Red Circle (Fear Signal) when there is a large amount of Fear. The Fear and Greed Signals can happen at any Fear and Greed Index but generally they correlate with the Index level. The Fear and Greed Signals are much more important at dictating a swing in momentum than the actual Index itself. The Index is more of a guide and is useful for seeing when the Index level crosses the Ma (the yellow line) as you can see a shift in momentum. However for large swings in momentum, the Fear and Greed Signals should be used. Do NOT Ignore these signals, they are quite powerful at predicting momentum swings.
Tutorial:
As you can see, the Fear and Greed Index looks somewhat similar to an RSI, but it has the ability to gain drastic momentum when there are strong changes in Fear and Greed.
When it comes to identifying buy/sell locations you generally want to ensure 2 things:
For a buy, the Fear and Greed Index (FGI) is less than 30.
For a sell, the FGI is greater than 70.
A signal has occurred. For buy that is the red circle and for sell that is the green circle.
The reason we generally want to ensure these 2 rules is to ensure you have the highest chance of being right with the lowest risk of being wrong. The way you want to use this indicator is; Be Fearful when others are Greedy and Greedy when others are Fearful.
There will be times when a fear or greed signal appears when the index is between 30-70. When these occur, they are still generally strong signal locations that represent a high chance of momentum in the direction they signal, however they face a higher risk of being wrong and therefore shouldn’t be used on its own to make a trade.
In the photo above we can see that the FGI’s color changed from Red to Orange in the candle after the Fear Signal. This happened because there was high price movement right after it (which is normal) and caused the Fear level to drop.
The color the FGI displays is based not off the FGI but by the STATE it is currently in. When the color is Green it is in a state of HIGH GREED, when the color is Red it is in a state of HIGH FEAR. When the color is Teal it is in a state of SLIGHT GREED, when the color is Orange it is in a state of SLIGHT FEAR. These colors hold true for the Information Tables as well.
As we can also see from the example above, it is 100% possible to have a state of HIGH GREED when the FGI is low. For instance look at the Fear (BUY) signals circled. Right before the Fear Signals happened, it was in a state of HIGH GREED (Green). The opposite is also true with Fear. We can have a high state of Fear when the FGI is high. However, please do remember, the lowest risk and best time to make trades is still:
FGI is higher than 70 and there is a Greed Signal = SELL
FGI is lower than 30 and there is a Fear Signal = BUY
You may notice there are sometimes occurrences that we call ‘Oddballs’. These oddballs are quite rare but they do happen and when they do they’re generally in clusters (close together). These Oddballs are when a Greed Signal occurs when the FGI is very low or when a Fear Signal occurs when the FGI is very high. Basically, they are occurring in the opposite location that they are supposed to. These may not seem like they matter but they matter a lot. As you can see based on where the blue vertical lines are, the price moved in the direction the signal identified shortly after the signal.
You may be wondering, are Oddball’s stronger price influencers than the regular signal? The issue with Oddballs is they sometimes CAN BE. But generally they aren’t. They generally do signal price movement will occur in the direction they are influencing, but generally not as much movement as if it occurred properly (Fear signal under 30 or Greed signal above 70).
The takeaway from Oddballs is to acknowledge their existence and potentially use them as markers for smaller purchases or DCA locations. We don’t recommend treating them as a legitimate purchase signal as they generally are weaker and less predictable, but nevertheless don’t dismiss them.
Our Information Tables are there to show you the FGI on 6 different Time Frames at the same time. This can be very useful for knowing how the other Time Frames are fairing while you are trading without needing to constantly change the Time Frame you are on.
For example, you see a Fear Signal on the 1 Day Time Frame, you then swap to the 15 minute Time Frame to find your entry location. Well, once you’re locked into that trade, you’ll likely be fixated on the 15 minute Time Frame. There’s a chance while you’re still waiting for your exit that levels and states of the FGI could change on higher Time Frames. This could drastically influence when and where your exit on the lower Time Frame should be.
This concludes our Tutorial on how to use YinYang Fear and Greed Index (FGI). However, continue reading for a description and better understanding of the Settings available to you for customization within this Indicator.
Settings:
1. Information Tables:
1.1. Show Information Tables:
Our Information Tables display 6 different Time Frames (resolutions) so that you can see the current level of Fear and Greed (FGI) that is prevalent on each Time Frame. There are 4 different states the FGI can be in:
Fear (Red)
Minor Fear (Orange)
Greed (Green)
Minor Greed (Teal)
The color of each Time Frame Cell (on Oscillator and in the table) is based on the following:
Red: Red represents that it is currently in a state of Fear. When it is in a state of fear it means traders are being overly bearish and selling when they likely shouldn’t. While it is in a state of Fear, there is a high chance of BULLISH price movement occurring. Remember, Be Fearful when others are Greedy and Greedy when others are Fearful.
Orange: Orange represents that it is currently in a state of Minor Fear. Minor Fear means that the FGI is less than 50, but it’s not currently in a state of Fear or Greed. While it is in this state, there is a better chance for BULLISH price action than there is bearish but it's nowhere near as likely as when in a state of Fear.
Green: Green represents that it is currently in a state of Greed. When it is in a state of Greed, it means traders are being overly bullish and buying when they shouldn’t. While it is in a state of Greed, there is a high chance of BEARISH price movement occurring.
Teal: Teal represents that it is currently in a state of Minor Greed. Minor Greed means that the FGI is greater than 50, but it’s not currently in a state of Fear or Greed. While it is in this state, there is a better chance for BEARISH price actions than there is bullish; but it’s nowhere near as likely as when its in a state of Greed.
2. Res1 / Res2/ Res3 / Res4 / Res5 / Res6:
These represent the different resolutions (Time Frames) being used in your information tables and can be modified to display whatever resolution works best for your trading style. By default they are:
Res1: Current Timeframe
Res2: 15 Minute
Res3: 1 Hour
Res4: 4 Hour
Res5: 1 Day
Res6: 1 Week
Backup Res (not changeable): 5 Minute (this is only used if your Current Timeframe in Res1 is a duplicate of one of the other resolutions)
Our Fear and Greed Index can be very useful for understanding how people are feeling in the market and when large price swings will occur. Remember, Be Greedy when others are Fearful and Fearful when others are Greedy!
If you have any Questions or Concerns, don’t hesitate to contact us.
HAPPY TRADING!

Rich Robin Index, The Crypto Fear & Greed Index with RSI Trend The Relative Strength Index (RSI) is a technical indicator based on price movements that is used to determine whether a particular asset is overbought or oversold. It measures the ratio of rising to falling prices over a certain period of time.
The Fear & Greed Index, on the other hand, is a composite index that tracks the sentiment of the crypto market. It is based on seven indicators, each of which measures a different aspect of market behavior. These indicators are: Safe Haven Demand, Stock Price Breadth, Market Momentum, Stock Price Strength, Put and Call Options, Junk Bond Demand, and Market Volatility.
The combination of the RSI and the Fear & Greed Index can provide valuable insights for crypto traders. The RSI can help identify overbought and oversold conditions, while the Fear & Greed Index can give an overall sense of the sentiment in the market. Together, they can provide a more complete picture of the market conditions. For example, if the RSI is indicating that an asset is overbought, but the Fear & Greed Index is showing that the market is still in a state of fear, it may be a good time to sell. On the other hand, if the RSI is indicating that an asset is oversold, but the Fear & Greed Index is showing that the market is in a state of greed, it may be a good time to buy.
Overall, the combination of the RSI and the Fear & Greed Index can provide useful information for traders to make more informed decisions, by giving a sense of the market conditions, and providing a way to identify overbought and oversold conditions.

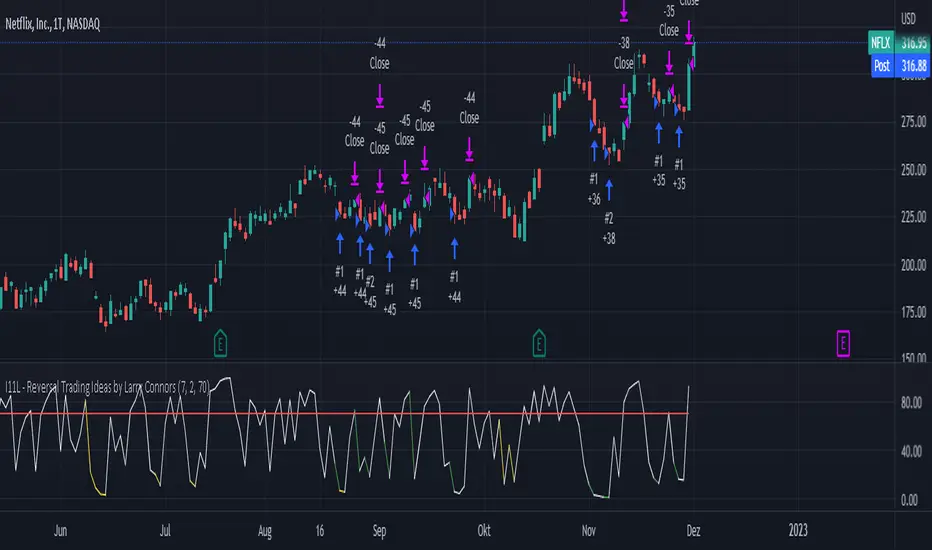
I11L - Reversal Trading Ideas by Larry ConnorsThis is my own Twist on Larry Connors Simple Tradingideas.
It Combines the RSI, Averaging In and the Lowest Bars in a Single System.
The current Configuration is designed for the Daily Timeframe.
Feel free to play with the Parameters and keep in mind that Larry Intended to buy fear and sell the greed!
The Rules are the following:
---Buy---
Buy, if the lowest Bar of your Configuration has been hit (default is set to 7).
---Average Down--
Buy, if the lowest Bar of your Configuration * Your open trades has been hit AND only if the buyin is atleast 1% cheaper.
---Close---
Close, if the RSI closes above a certain level (default is set to 70).
---TP---
There is no TP
---SL---
There is no SL, so be cautions of your tail Risk!
Stochastic Vix Fix SVIX (Tartigradia)The Stochastic Vix or Stochastic VixFix (SVIX), just like the Williams VixFix, is a realized volatility indicator, and can help in finding market bottoms as well as tops without requiring bollinger bands or any other construct, as the SVIX is bounded between 0-100 which allows for an objective thresholding regardless of the past.
Mathematically, SVIX is the complement of the original Stochastic Oscillator, with such a simple transform reproducing Williams' VixFix and the VIX index signals of high volatility and hence of market bottoms quite accurately but within a bounded 0-100 range. Having a predefined range allows to find markets bottoms without needing to compare to past prices using a bollinger band (Chris Moody on TradingView) nor a moving average (Hesta 2015), as a simple threshold condition (by default above 80) is sufficient to reliably signal interesting entry points at bottoming prices.
Having a predefined range allows to find markets bottoms without needing to compare to past prices using a bollinger band (Chris Moody on TradingView) nor a moving average (Hesta 2015), as a simple threshold condition (by default above 80) is sufficient to reliably signal interesting entry points at bottoming prices.
Indeed, as Williams describes in his paper, markets tend to find the lowest prices during times of highest volatility, which usually accompany times of highest fear.
Although the VixFix originally only indicates market bottoms, the Stochastic VixFix can also indicate good times to exit, when SVIX is at a low value (default: below 20), but just like the original VixFix and VIX index, exit signals are as usual much less reliable than long entries signals, because: 1) mature markets such as SP500 tend to increase over the long term, 2) when market fall, retail traders panic and hence volatility skyrockets and bottom is more reliably signalled, but at market tops, no one is panicking, price action only loses momentum because of liquidity drying up.
Compared to Hesta 2015 strategy of using a moving average over Williams' VixFix to generate entry signals, SVIX generates much fewer false positives during ranging markets, which drastically reduce Hesta 2015 strategy profitability as this incurs quite a lot of losses.
This indicator goes further than the original SVIX, by restoring the smoothed D and second-level smoothed D2 oscillators from the original Stochastic Oscillator, and use a 14-period ZLMA instead of the original 20-period SMA, to generate smoother yet responsive signals compared to using just the raw SVIX (by default, this is disabled, as the original raw SVIX is used to produce more entry signals).
Usage:
Set the timescale to daily or weekly preferably, to reduce false positives.
When the background is highlighted in green or when the highlight disappears, it is usually a good time to enter a long position.
Red background highlighting can be enabled to signal good exit zones, but these generate a lot of false positives.
To further reduce false positives, the SVIX_MA can be used to generate signals instead of the raw SVIX.
For more information on Williams' Vix Fix, which is a strategy published under public domain:
The VIX Fix, Larry Williams, Active Trader magazine, December 2007, web.archive.org
Fixing the VIX: An Indicator to Beat Fear, Amber Hestla-Barnhart, Journal of Technical Analysis, March 13, 2015, ssrn.com
For more information on the Stochastic Vix Fix (SVIX), published under Creative Commons:
Replicating the CBOE VIX using a synthetic volatility index trading algorithm, Dayne Cary and Gary van Vuuren, Cogent Economics & Finance, Volume 7, 2019, Issue 1, doi.org
Note: strangely, in the paper, the authors failed to mention that the SVIX is the complement of the original Stochastic Oscillator, instead reproducing just the original equation. The correct equation for the SVIX was retroengineered by comparing charts they published in the paper with charts generated by this pinescript indicator.
For a more complete indicator, see:

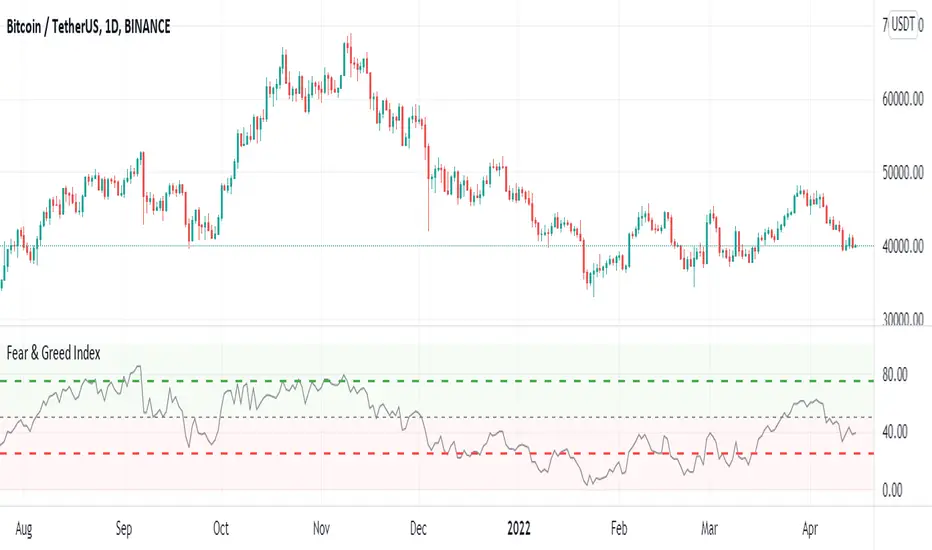
Crypto Fear & Greed IndexCrypto Fear & Greed Index
Crypto Fear & Greed Index is a metric to gauge sentiment levels in the crypto market.
The index starts from 0 to 100, with 0 meaning “Extreme Fear” (a potential bottom signal as investors are overly worried), and 100 meaning “Extreme Greed” (a potential top signal as investors are overly bullish).
Why Measure Fear and Greed?
In most markets, participants tend to be emotional with their behavior. Market participants often get overly greedy and FOMO when prices are on a euphoric rise, whilst they also tend to be overly fearful when prices are down and irrationally selling their positions at a loss.
Using the Crypto Fear and Greed Index
The Crypto Fear and Greed Index is commonly used to time entry into the market. As such, the Index is seen as less of an investment research tool and more of a market-timing tool. As stated by Warren Buffet, “Be fearful when others are greedy, and greedy when others are fearful.”
Calculation of the Crypto Fear and Greed Index
The Crypto Fear and Greed Index is based on three different factors – each factor is gauged from 0 to 100 and equally weighted to generate the index value.
The three factors are:
1. Stable coin flows
If there is a market sell-off and investors are expecting the value of their crypto investment to decline, they may rotate into stable coins as a safe haven.
As such, we look at the general trend of stable coins volume and activity to measure if the market is greedy or fearful.
2. Market Momentum
The performance of the top 18 coins relative to its 30-day average. A greater relative performance indicates greed and vice versa.
3. Top 18 Coins Price Strength
The number of coins of the top 18 coins hitting 90-days highs relative to those hitting 90-days lows. A greater number of coins hitting 90-days highs versus 90-days lows indicates greed and vice versa.
Levels Of Fear [AstrideUnicorn]"Buy at the level of maximum fear when everyone is selling." - says a well-known among traders wisdom. If an asset's price declines significantly from the most recent highest value or established range, traders start to worry. The higher the drawdown gets, the more fear market participants experience. During a sell-off, a feedback loop arises, in which the escalating fear and price decline strengthen each other.
The Levels Of Fear indicator helps analyze price declines and find the best times to buy an asset after a sell-off. In finance, volatility is a term that describes the degree of variation of an asset price over time. It is usually denoted by the letter σ (sigma) and estimated as the standard deviation of the asset price or price returns. The Levels Of Fear indicator helps measure the current price decline in the standard deviation units. It plots seven levels at distances of 1, 2, 3, 4, 5, 6, and 7 standard deviations (sigmas) below the base price (the recent highest price or upper bound of the established range). In what follows, we will refer to these levels as levels of fear.
HOW TO USE
When the price in its decline reaches a certain level of fear, it means that it has declined from its recent highest value by a corresponding number of standard deviations. The indicator helps traders see the minimum levels to which the price may fall and estimate the potential depth of the current decline based on the cause of the actual market shock. Five-seven sigma declines are relatively rare events and correspond to significant market shocks. In the lack of information, 5-7 sigma levels are good for buying an asset. Because when the price falls that deep, it corresponds to the maximum fear and pessimism in the market when most people are selling. In such situations, contrarian logic becomes the best decision.
SETTINGS
Window: the averaging window or period of the indicator. The algorithm uses this parameter to calculate the base level and standard deviations. Higher values are better for measuring deeper and longer declines.
Levels Stability: the parameter used in the decline detection. The higher the value is, the more stable and long the fear levels are, but at the same time, the lag increases. The lower it is, the faster the indicator responds to the price changes, but the fear levels are recalculated more frequently and are less stable. This parameter is mostly for fine-tuning. It does not change the overall picture much.
Mode: the parameter that defines the style for the labels. In the Cool Guys Mode , the indicator displays the labels as emojis. In the Serious Guys Mode , labels show the distance from the base level measured in standard deviation units or sigmas.

Fear and Greed Intraday IndexThis script uses all of the sub-components of my 'Fear and Greed Index' which can be used on intraday timeframes. Most of the components of this script are based on the popular fear and greed index website and are briefly described in the code comments.
Several of the subcomponents have been recalculated to use RSIs instead of being compared to moving averages, which means as opposed to being used a contrarian timing indicator as the daily timeframe Fear and Greed Index is, this indicator now may potentially be used more like a momentum indicator.
It's up to you!
Enjoy!

Fear and Greed Index CandlesticksThis colours the candlesticks based on my 'Fear and Greed Index'.
All calculations are explained in the code.
The index is mainly based upon the components of the popular fear and greed index website. I've annotated the components in the code for you to look at.
If you're interested, you can replace the final variable 'Total' (within the 'barcolor' function at the very end) with any of the final outputs of the subcomponents to see the results of that single part.
Red = Greed
Green = Fear
Enjoy!

Fear and Greed IndexI couldn't find one based on the original, so I made my own, it's not quite identical, but it does the job.
Red = greed
Green = fear
I updated a lot of the subcomponents and fixed a bug. I've reduced the smoothing to 1, it was previously 5 if you prefer smoother signals. Also added a McClellan oscillator.
I've commented out the plotting of individual sub-components, just uncomment them to see what they do. Some look like pretty useful indicators on their own.
Enjoy!

FEAR & GREED INDICATORBINANCE:BTCUSDTPERP
Hello
The crypto index, which is currently only for Bitcoin, captures bearish and bullish trends by gauging investor sentiment for the coin. As the name suggests, the market trend is identified based on two emotions – fear and greed.
This configurations are set for 1D BTC charts
This is simple script, based on cheatcountry script
Enjoy ;)

Fear N GreedOverview
The goal of this script was to apply the concept of Herd Mentality. While one voice may seem unique, when you combine all the voices together they average out and show an overall emotion of the herd. We should be able to apply this concept to indicators, giving us the Fear and Greed of the markets.
How to Use
Buy when there is fear and sell when there is greed. Pay attention to changes in direction of the indicator. If the data is fearful and the data is starting to change direction, it signals that it's probably a good time to buy because greed is slowly starting to enter the market. You can use this indicator in any time frame, just check the past data to determine how useful it will be for that specific period.
Options
Smoothing : This will smooth the data. Try to stay around 5-15. High values will cause the indicator to lag
Line Width : Visually changes the width of the data line
Top Band +- : Moves the top band up or down
Bot Band +- : Moves the bottom band up or down
Mid Band Width : Adjusts the width of the middle region
Fear Alert Level >= : Sets when the alert will start to trigger
Greed Alert Level >= : Sets when the alert will start to trigger
Indicators
There are multiple indicators used in this script. I used the Stochastic RSI to measure strength in the market. This combines well with the MACD indicator by giving you really good entry and exit points. There is an indicator combining money flow and rate of return to give a basic emotion of the data. I also included breadth and momentum and several others to help gauge the direction of the market. I then normalize all of the indicators between 0-100 so that I can get an overall average, smooth the noise, and ultimately plot the data.
Bands
While making this script I noticed flowing regions of the data that would act as support and resistance so I did my best to calculate where they might fall. I essentially take the high and low data points from various lengths averaging them and then apply a smoothing filter to the band. I then noticed that between the bands there was a significant region that acted as a middle resistance and support. I decided the best way to make this region was to take the average high + average low of the data and divide it by 2 to get the center region. The reason I did this instead of just using the mid point of the bands was because when the data stays in a similar region it creates resistance, so it's more accurate to base the mid point on a shorter time frame rather than the overall bands of higher timeframes.
Alerts
Alerts are set up based on the change in data direction. If you set Fear as the alert for Fear Alert >= it will wait for a change in direction if the data is greater than or equal to the selected Fear level.
When setting alerts, make sure to use Once Per Bar Close as the option. There are 3 alert types: Fear Alert, Greed Alert, and Fear and Greed Alert. Fear and Greed Alert will combine the alerts into one message so that it's usable for free accounts. Fear Alert and Greed Alert will only message for those specific positions.
