[astropark] Ichimoku Cloud StrategyDear Followers,
today a Great Swing Trading Strategy , runnable on a bot , which works great on High Timeframes (1D is suggested!) but also even better on 1m Renko chart.
If you are a scalper, you will love suggested entries for fast profit. You can run it on 1h timeframe (below is not suggested) if you are used to scalp trading and close each trade whenever you feel happy (a proper trailing stop strategy is suggested anyway).
This strategy is based on the Ichimoku Cloud Indicator and let's you set a lot of settings:
works on all timeframes (but 1D and above is suggested on normal candlesticks chart)
you can run this indicator on 1m Renko chart (be sure to enable the "USING RENKO CHART? ENABLE THIS OPTION" setting)
you can use 4 kind of Ichimoku Cloud (Custom, Slow, Standard and Fast - keep only one enabled)
you can make the Ichimoku Cloud show or not
you can enable showing the possibile re-entries
you can enable an heiking ashi analysis
you can enable a trailing stop strategy ("Auto Trailing Stop Loss" and "Close Trade When Price Breaks Above the Ichimoku Cloud" are two options very much suggested to keep enabled, especially on bot trading)
you can create your own trailing stop stategy and take profit strategy
you can enable a simple take profit strategy based on RSI Overbought and Oversold levels
This strategy only trigger 1 buy or 1 sell, but if you missed the possibility to open your long or short position don't get mad, but just enable the "show re-entry signals" option, so yout will be able to enter again (be sure to always use a proper money management ).
By the way, you can set any alarms you like in order to get notified when any kind of signal is triggered (you need to use the "alarms" version for this).
Strategy results are calculated on the timeframe from January 2016 to now, so on 3 years, using 10000$ as initial capital, doing only 6 trades (great swings!) and working at 1x leverage (so no leverage at all! perfect spot trading style!). If you like to use leverage, be sure tp use a safe option, like 3x or 5x at most in order to have liquidation price very far).
This is not the "Holy Grail", so use a proper risk management strategy.
This script will let you backtest how the indicator will perform on any chart you may test. Of course results will be very different depending on the chart you will open. I tested a lot of charts and always you can find a combination that keep this strategy in profit on swing trading style (and this means that if you can have a daily look at the chart you can always manage to maximize your profit on each trade!
The alarms version of this indicator, which will let you set all notifications you may need in order to be alerted on each triggered signals, can be found by searching for "astropark Ichimoku Cloud Strategy" and then choosing the "astropark" indicator with "alarms" suffix in the name.
This is a premium indicator , so send me a private message in order to get access to this script.
EURUSD

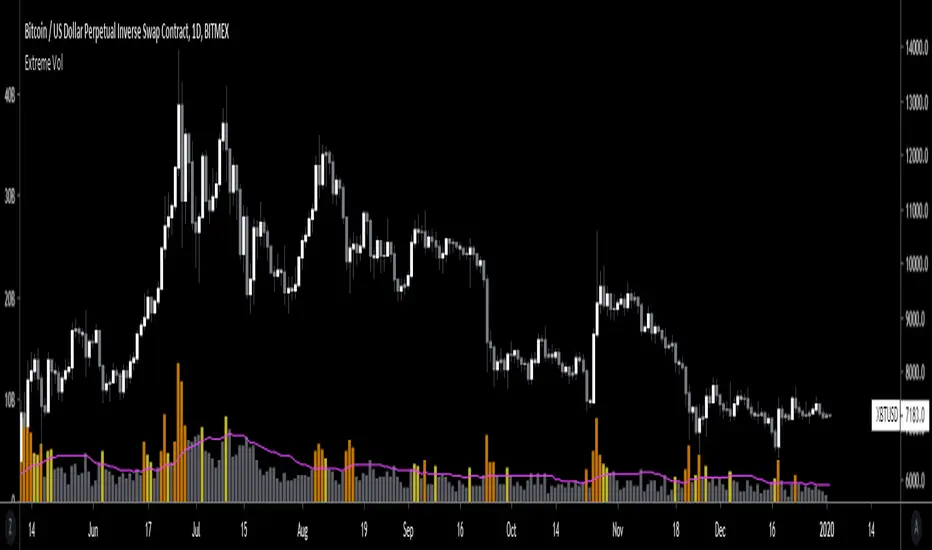
Extreme VolumeThis indicator colors volume bars that are significantly higher volume than the vol moving average ( SMA ). Utilizes two multiplier that can be adjusted by user. Defaults are that the indicator colors volume bars yellow if 20% higher than average, and orange if over 50% higher than average.
Reason why i created this indicator is i typically don't care about volume unless it is significantly higher than average. I find extreme volume useful for confirmation of a breakout, etc. This is why the rest of the volume bars are gray, they are still available for reference, but I dont pay much attention until volume is higher than average.
Also, when you load this indicator it will be in its own pane below the chart. To try and figure out how to add it to same pane as the chart was a huge pain in the ass. Once you figure it out it is pretty easy. I'll try to explain below...
Next to the indicator name you have the following options ... Hide, Settings, Show Source Code{}, Delete(X), and More (3 dots)
1) Click on "More" (3 dots)
2) Click on "Move To" then chose "Existing Pane Above"
3) Volume will likely be too large. Volume scale should be on left side, use your mouse to adjust volume smaller
4) Volume will likely be in the middle of your chart, click on it and drag it down.
[astropark] Support Resistance Trendlines Swing PointDear Followers,
I'm very happy to publish this new tool, which will help you easily find
basic trend momentum (red if a bearish momentum is found, green viceversa)
Support Levels (where you can place your buy orders or short targets)
Resistance Levels (where you can place your sell orders or long targets)
Trendlines , known as diagonal supports and resistances (if price breaks a green one, then it's time to buy/long! otherwise if price breaks a red one, then it's time to sell/short)
Donchian Channel , which will memorize for you latest highs and lows, which may get retested for example
Swing Point , very useful point where to open a position while price holding above or below it
This script:
works on all timeframes
lets you edit each support-resistance cloud settings
lets you activate a third support-resistance cloud if you like
lets you choose if enable only one or disable all of them or whatever combination...
lets you choose to enable or disable trendlines, basic trend, donchian channel, swing point, etc... So very customizable user experience!
This is a premium indicator , so send me a private message in order to get access to this script.

TRADER DREAMSThis indicator based macd,rsi,stochastic based. But it includes my own secret values. Comes with Machine learning technology and zero lag option. Next generation of technical analysis.
Also you can look my other scripts
this is symbol scanner
this is wolfe and scalping indicator
this is trending trend based kst indicator
this is also can harmonic formation and trend analysis automatic and shows you target
this is the best for trading
and others....
I'm publishing this indicator for a while. Good luck.

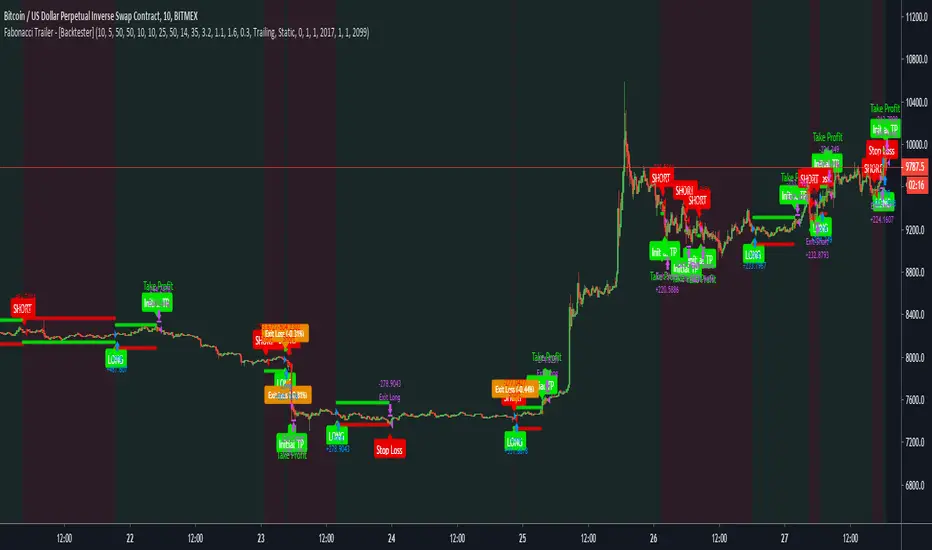
Fabonacci Trailer - [Backtester]This study comes with the following indicators and features:
ADX indicator
Chop indicator
Super Trend indicator
Trailing Take Profit and Stop Loss
Entry, Take Profit, and Stop Loss Alerts
Renko chart support
And a few more indicators in the back-end to increase accuracy and optimize entries
The study version with all alerts can be found in my profile. It is not repainting and we advise to use alerts on “Once Per Bar Close”.
Please note that this script is based on invite only.
Fabonacci Trailer - [Alerts]This script comes with the following indicators and features:
ADX indicator
Chop indicator
Super Trend indicator
Trailing Take Profit and Stop Loss
Entry, Take Profit, and Stop Loss Alerts
Renko chart support
And a few more indicators in the back-end to increase accuracy and optimize entries
This script works really well as a scalper on lower Time Frames as well as on higher Time Frames. Besides that you can also use it on pretty much any coin or asset.
This script is not repainting. We advise to use alerts on “Once Per Bar Close”.
If you’d like to automate this script you can do that by using AutoView, ProfitView, ProfitTrailer, CryptoHopper etc.
Please note that this script is based on invite only.

MA Crossover [Alerts]This is a Moving Average Crossover study .
The study comes with all alerts (Long, Short, Take Profit, and Stop Loss).
A few visuals like Exit Loss and Profit/Loss Boxes have been added as well.
The following Moving Averages are supported:
SMA
EMA
DEMA
TEMA
WMA
VWMA
SMMA
HullMA
LSMA
ALMA
SSMA
TMA
ZLEMA
If you’d like to automate this script you can do that by using AutoView, ProfitView, ProfitTrailer, CryptoHopper etc.
Feel free to leave a comment and share it with your friends. Enjoy!

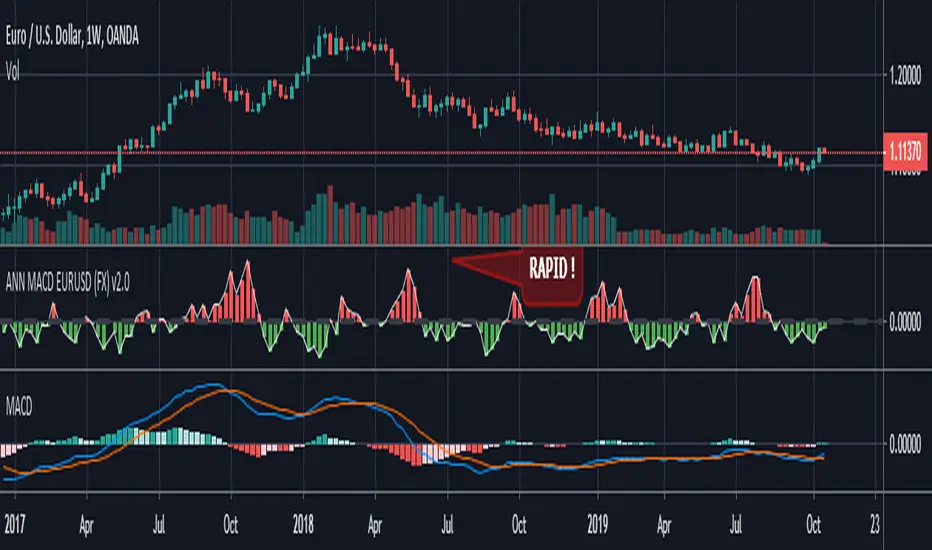
ANN MACD EURUSD (FX) Hello , this script is trained with eurusd 4-hour data. (550 columns) Details :
Learning cycles: 8327
AutoSave cycles: 100
Training error: 0.005500 ( That's a very good error coefficient.)
Input columns: 19
Output columns: 1
Excluded columns: 0
Training example rows: 550
Validating example rows: 0
Querying example rows: 0
Excluded example rows: 0
Duplicated example rows: 0
Input nodes connected: 19
Hidden layer 1 nodes: 2
Hidden layer 2 nodes: 5
Hidden layer 3 nodes: 0
Output nodes: 1
Learning rate: 0.6000
Momentum: 0.8000
Target error: 0.0055
NOTE : Use with EURUSD only.
Alarms added.
Thanks dear wroclai for his great effort.
Deep learning series will continue ! Stay tuned.
Regards , Noldo .
That One Indicator (Free) - [Backtester]This Backtester comes with the following indicators:
Bollinger Bands
ADX
Moving Average Trend Confirmation Filter ( EMA , SMA , DEMA , TEMA , WMA , VWMA , SMMA , HullMA, LSMA , ALMA , SSMA, TMA, ZLEMA )
And a few more indicators in the back-end to increase accuracy
This strategy works really well as a scalper on lower Time Frames as well as on higher Time Frames. Besides that you can also trade it on pretty much any coin or asset.
The alerts script is not repainting. We advise to use alerts on “Once Per Bar Close”.
If you’d like to automate this strategy you can do that by using our alerts script with AutoView, ProfitView, ProfitTrailer, CryptoHopper etc.
Alerts are set very clearly as Long and Short to avoid confusion.
Feel free to leave a comment and share it with your friends.

EURUSD Binary Strategy Indicator ALERTS!Good afternoon traders!
The EURUSD Binary Strategy Indicator ALERT, is a continuation of the " EURUSD Binary Strategy 73% Win Ratio " strategy made by my self. This indicator allows you to add alerts in order for you not to miss a trade! Furthermore, for the purchase of the " EURUSD Binary Strategy 73% Win Ratio " strategy, this indicator is also included.
A FREE 5 DAY VERSION of the " EURUSD Binary Strategy 73% Win Ratio " Strategy is available! Go try it now!
Best regards!
Contact:
emilianomesauribe2000@live.com

EURUSD 5 Minute Binary Strategy by Emiliano Mesa 73% Win RatioEURUSD Binary Strategy 73% Win Ratio.
-----Free 5 Day Trial-----
¿How it works?
This is a binary indicator, meaning it may be only
used for EURUSD options. Its use is simple:
1) Wait for the blue background to appear, this
means a possible trade may be upcoming
2) Wait for the purple background to appear, this
is our entry. And enter in the suggested direction
by the arrows after the close of the bar
3) Establish your expiration bar the # of
bars missing in the white area (which are 3 bars
per area) + 1 bar of the yellow area
for instance:
- Each background color both blue and yellow, have
the same ammount of bars in between (3), and so
does the white space between them, each bar is 5
minutes. In this case we are given an entry 1 bar
later, so 5 miutes inside our whitespace. Saying
so there are 2 bars left inside our white area, plus
one yellow bar, which means our expiration time
is 15 minutes since Entry to exit!
Wohooo! PROFIT!
Go ahead and send me a PRIVATE MESSAGE or EMAIL
if you are intrested in trying my Binary Strategy FREE
for 5 DAYS!
¿WANT ALERTS?
If you purchase the EURUSD Binary Strategy
Ill add up the EURUSD Binary Indicator! For you
not to miss a trade!
-----------------------
Contact:
emilianomesauribe2000@live.com

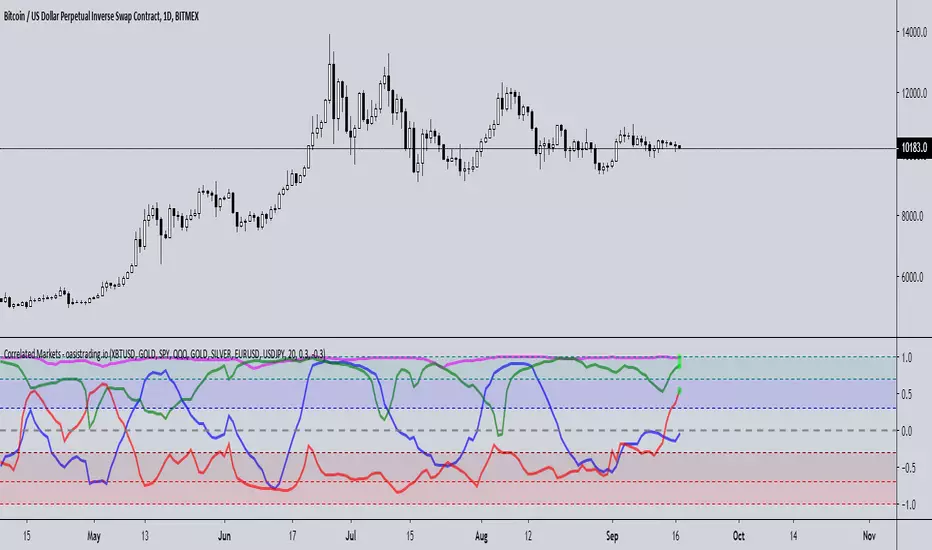
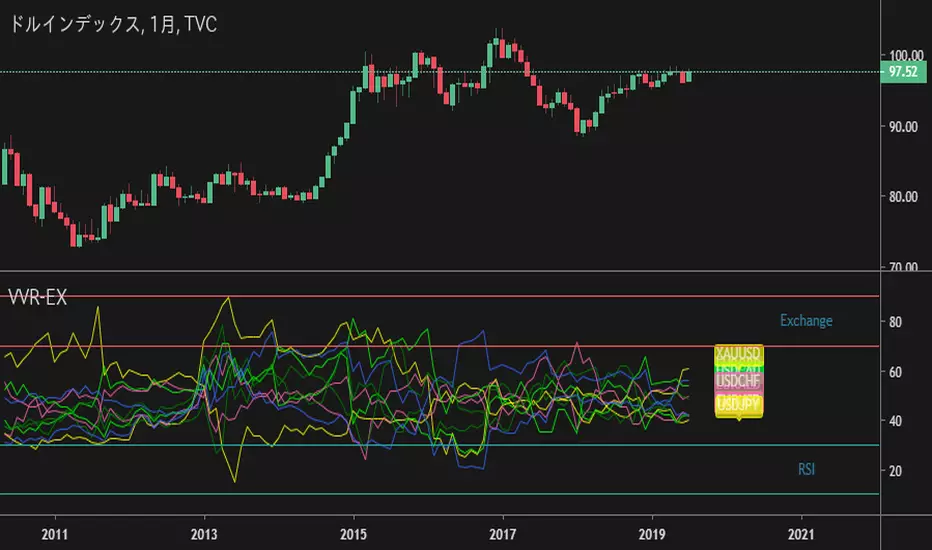
Correlated MarketsThis indicator is free to all Oasis Trading Group members.
This indicator reads correlations between two symbols of your choice, and displays 4 correlations at the same time.
The upper and lower thresholds are user-definable, alerts and visual indications are given when the line crosses the level.
This indicator uses a correlation coefficient which ranges between -1.0 and +1.0.
A correlation of +1.0 implies a perfect correlation while -1.0 implies the two pairs are in complete opposition.
This is useful not only in Forex trading but also for managing or diversifying your portfolio or for finding patterns,
for example when two Forex pairs move independently or an altcoin splits from BTC .
A circle on the +1 line will display for a positive correlation (or whatever you set the threshold to and vice versa for the -1 line.
Alerts are also available for each correlation pair.
For Access or Questions: Private message us. Thank you.
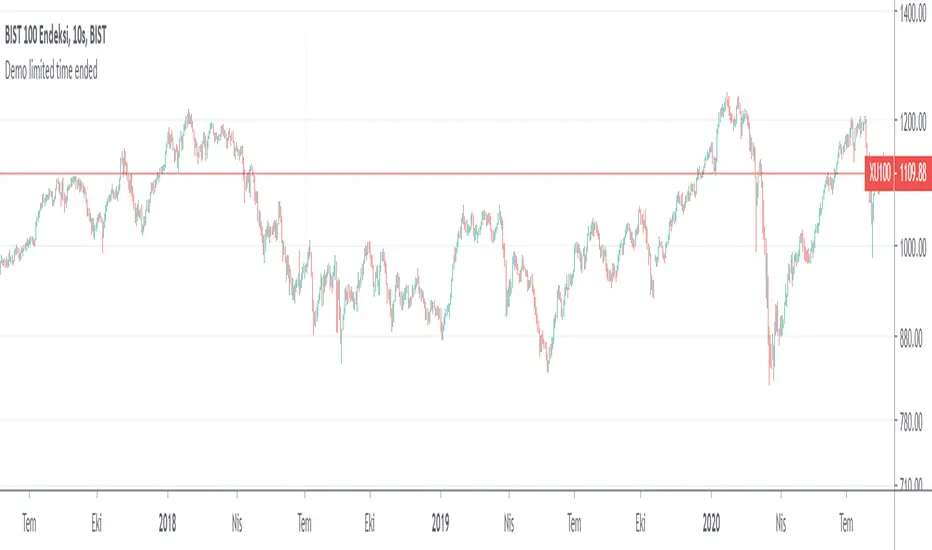
Borsaca Demo Limited Time OnlyThis indicator does NOT REPAINT. If the signal occurs it will be forever. Easy and profitable strategy optimized for Crypto, Foreks and Stock Markets...
This indicator gives you Long and Exit signals all timeframes...
BORSACA TRADER is optimized to catch trend movements as soon as possible and maximize profitability.
Strategy tester results. 96% Profitable on BTCUSD Daily scale. Test other markets you want.
WE RELY ON OUR INDICATOR TO THE END. AND WE ASSURE YOU THERE IS NOTHING BETTER THAN THE BORSACA TRADER INDICATOR.
Best regards and happy trading.
Herif's winning strategy option. Check the strategy tester results success than %96
Safe Mode as optional parameter. You can enable this to prevent some riskier trades to happen at the cost of some profitability. Use it if you are more conservative in trading.
Normal Mode signals for Buy and Sell. Trade Mode signals for buy and sell use with support and resistance levels.
Auto Support And Resistance ..
Auto Fibonacci Levels...
BORSACA TRADER indicator is the best option for everybody in financial markets. Check my Profile Page for more information and follow me, like and favorite my indicator and support your positive response and take a message for 10 days trial.
Happy trading. Good luck :)

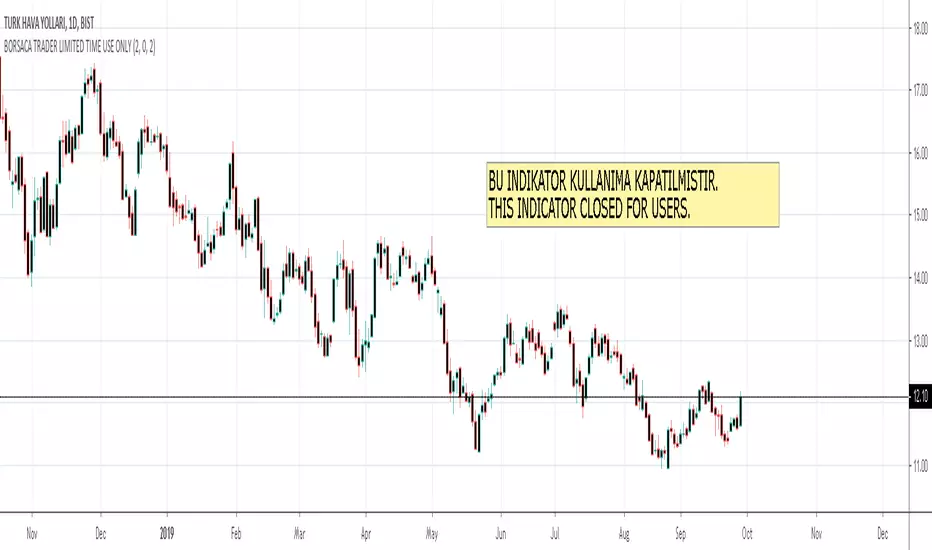
BORSACA TRADER LIMITED TIME USE ONLYThis indicator does NOT REPAINT. If the signal occurs it will be forever. Easy and profitable strategy optimized for Crypto, Foreks and Stock Markets...
This indicator gives you Long and Exit signals all timeframes...
BORSACA TRADER is optimized to catch trend movements as soon as possible and maximize profitability.
Strategy tester results. 96% Profitable on BTCUSD Daily scale. Test other markets you want.
WE RELY ON OUR INDICATOR TO THE END. AND WE ASSURE YOU THERE IS NOTHING BETTER THAN THE BORSACA TRADER INDICATOR.
Best regards and happy trading.
Herif's winning strategy option. Check the strategy tester results success than %96
Safe Mode as optional parameter. You can enable this to prevent some riskier trades to happen at the cost of some profitability. Use it if you are more conservative in trading.
Normal Mode signals for Buy and Sell.
Trade Mode signals for buy and sell use with support and resistance levels.
Auto Support And Resistance..
Auto Fibonacci Levels...
BORSACA TRADER indicator is the best option for everybody in financial markets. Check my Profile Page for more information and follow me, like and favorite my indicator and support your positive response and take a message for 10 days trial.
Happy trading. Good luck :)
Borsaca StrategyThis indicator uses contrarian investment style. You can use Buy/Sell indicator and trade hibryd mentality. What do you say? Dont hear before what is mean?
Ok. Good Luck.
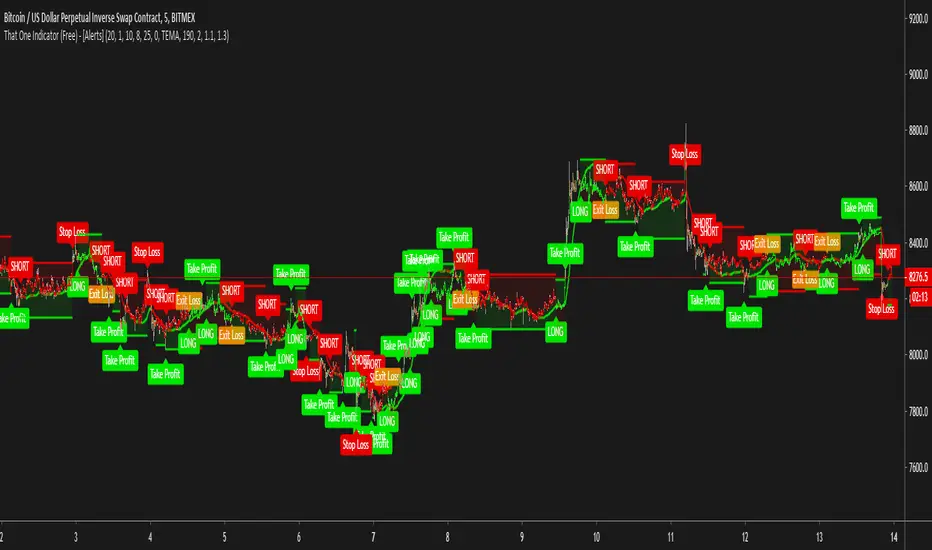
That One Indicator (Free) - [ALERTS]This script comes with the following indicators:
Bollinger Bands
Stochastic
Moving Average Trend Confirmation Filter (EMA, SMA)
Long/Short Alerts
Stop Loss Alerts
And a few more indicators in the back-end to increase accuracy
This script works really well as a scalper on lower Time Frames as well as on higher Time Frames. Besides that you can also trade it on pretty much any coin or asset.
This script is not repainting. We advise to use alerts on “Once Per Bar Close” .
If you’d like to automate this script you can do that by using AutoView, ProfitView, ProfitTrailer, CryptoHopper etc.
Alerts are set very clearly as Long and Short to avoid confusion.
A new script is being published soon with a lot more functionality, which includes noise filtering, all MA Types, RSI and other types of volatility measurements to filter out “less profitable” trades.
Feel free to leave a comment and share it with your friends.
SKARB Long/Short Scalping EURUSDThe indicator is specially created for scalping the euro-dollar
Best timeframes 5 m and 15 m

[astropark] EMA RibbonsHi Followers,
here a new free indicator: EMA RIbbons!
Please, don't trade without a check on chart! Here you have a lot of tools, today the EMA Ribbons!
On every timeframe, the EMA ribbons act as support or resistance for price action, and works nicely every where, from cryptocurrencies to forex, and on every timeframe!
Please let me know your point of view on comments below.
Enjoy and do Profits!
-- astropark
Do you like my free scripts? Offer me a coffee, a beer, a pizza or whatever :)
BTC jar: 1K5kuYQPEqoNo6GRmJbHWMPmqwKM5S3oRR
ETH jar: 0x091b541a6dd6fe08c4e7bd909baafb2fce9b975e
LTC jar: LSVoAChsZrVsvbNyUfdpxtFpDAUSaUTUig
XRP jar: (XRP deposit tag) 103997763 (XRP deposit address) rEb8TK3gBgk5auZkwc6sHnwrGVJH8DuaLh
PS: Do you need a customization or do you need a dev who implements your strategy? send me a private message ;-)

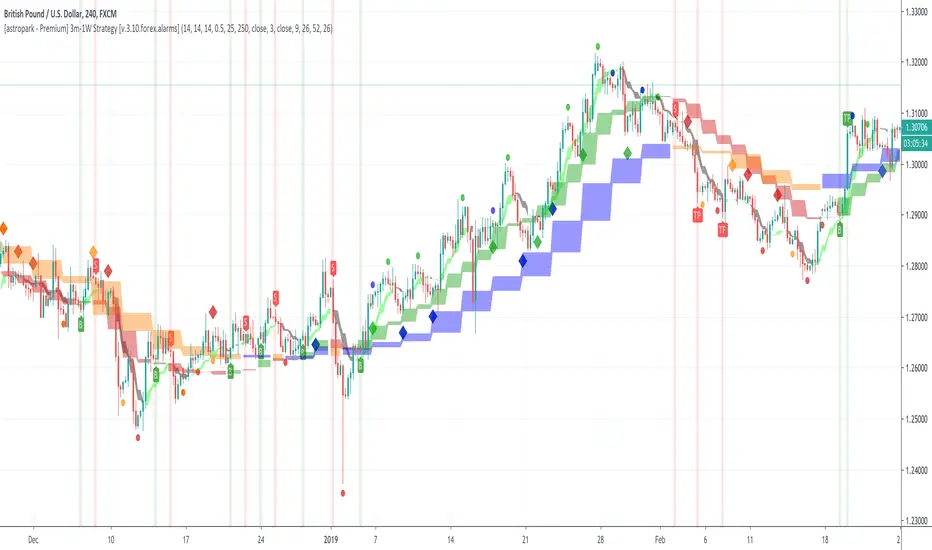
[astropark - Premium] Long-Short Strategy V3-FOREX [Alarms]This indicator is not holy grail , but it is an amazing trend finder and works nicely between 3m and 1W timeframes on FOREX :)))
With this indicator you can enjoy its trading signal and set the alarms you need!
In fact, if you want to set alerts on both buy, sell, take profit and stop-loss signals you must use this not-strategy indicator version!
This indicator is the non-strategy version of this one:
HOW TO USE THIS INDICATOR
Buy/Long when you see a green "B" label on the chart at best price you can, you have time till next candle's open price , trying to buy as low as possible near the green cloud or below it. Green cloud acts like a moving support for price, so use it for more buys/longs. The bigger the cloud, the stronger the bull-trend and so the support.
Sell/Short when you see a red "S" label on the chart at best price you can, you have time till next candle's open price , trying to sell as high as possible near the red cloud or over it. Red cloud acts like a moving resistance for price, so use it for more sells/shorts. The bigger the cloud, the stronger the bear-trend and so the resistance.
This indicator suggests some TP (Take Profit) for both longs (in green color) and shorts (in red color): you can start (at least partially!) closing the current trade (eventually you start new longs/shorts at cloud touch if you are a bold trader!).
Keep in mind that the lower the timeframe you work on, the easier is the trend to change rapidly, so always set a -2% / -5% stop-loss on trades and follow the trend with a nice trailing stop strategy.
Of course, as said at the beginning, this indicator suggests some TPs (Take Profits) for both longs (in green color) and shorts (in red color) operations: when you see a TP, you can start (at least partially!) taking profits over the current trade and move stop-loss higher (at least at break-even).
This is a premium indicator , so send me a private message in order to get access to this script.
Do you like my free scripts? Offer me a coffee, a beer, a pizza or whatever :)
BTC jar: 1K5kuYQPEqoNo6GRmJbHWMPmqwKM5S3oRR
ETH jar: 0x091b541a6dd6fe08c4e7bd909baafb2fce9b975e
LTC jar: LSVoAChsZrVsvbNyUfdpxtFpDAUSaUTUig
XRP jar: (XRP deposit tag) 103997763 (XRP deposit address) rEb8TK3gBgk5auZkwc6sHnwrGVJH8DuaLh
PS: Do you need a customization or do you need a dev who implements your strategy? send me a private message ;-)
[astropark - Premium] Long-Short V3-FOREX [Strategy]This indicator is not holy grail , but it is an amazing trend finder and works nicely between 3m and 1W timeframes on FOREX :)))
With this indicator you can enjoy its trading signal and backtest the strategy.
In order to check how much you could have been profitable with this script if you started trading from a specific timestamp, please use this nice website to get the integer number representing in seconds the date-time you want to start from: www.unixtimestamp.com
If you want to set alerts on both buy, sell, take profit and stop-loss signals you must use the following not-strategy indicator version:
HOW TO USE THIS INDICATOR
Buy/Long when you see a green "B" label on the chart at best price you can, you have time till next candle's open price , trying to buy as low as possible near the green cloud or below it. Green cloud acts like a moving support for price, so use it for more buys/longs. The bigger the cloud, the stronger the bull-trend and so the support.
Sell/Short when you see a red "S" label on the chart at best price you can, you have time till next candle's open price , trying to sell as high as possible near the red cloud or over it. Red cloud acts like a moving resistance for price, so use it for more sells/shorts. The bigger the cloud, the stronger the bear-trend and so the resistance.
This indicator suggests some TP (Take Profit) for both longs (in green color) and shorts (in red color): you can start (at least partially!) closing the current trade (eventually you start new longs/shorts at cloud touch if you are a bold trader!).
Keep in mind that the lower the timeframe you work on, the easier is the trend to change rapidly, so always set a -2% / -5% stop-loss on trades and follow the trend with a nice trailing stop strategy.
Of course, as said at the beginning, this indicator suggests some TPs (Take Profits) for both longs (in green color) and shorts (in red color) operations: when you see a TP, you can start (at least partially!) taking profits over the current trade and move stop-loss higher (at least at break-even).
This is a premium indicator , so send me a private message in order to get access to this script.
Do you like my free scripts? Offer me a coffee, a beer, a pizza or whatever :)
BTC jar: 1K5kuYQPEqoNo6GRmJbHWMPmqwKM5S3oRR
ETH jar: 0x091b541a6dd6fe08c4e7bd909baafb2fce9b975e
LTC jar: LSVoAChsZrVsvbNyUfdpxtFpDAUSaUTUig
XRP jar: (XRP deposit tag) 103997763 (XRP deposit address) rEb8TK3gBgk5auZkwc6sHnwrGVJH8DuaLh
PS: Do you need a customization or do you need a dev who implements your strategy? send me a private message ;-)

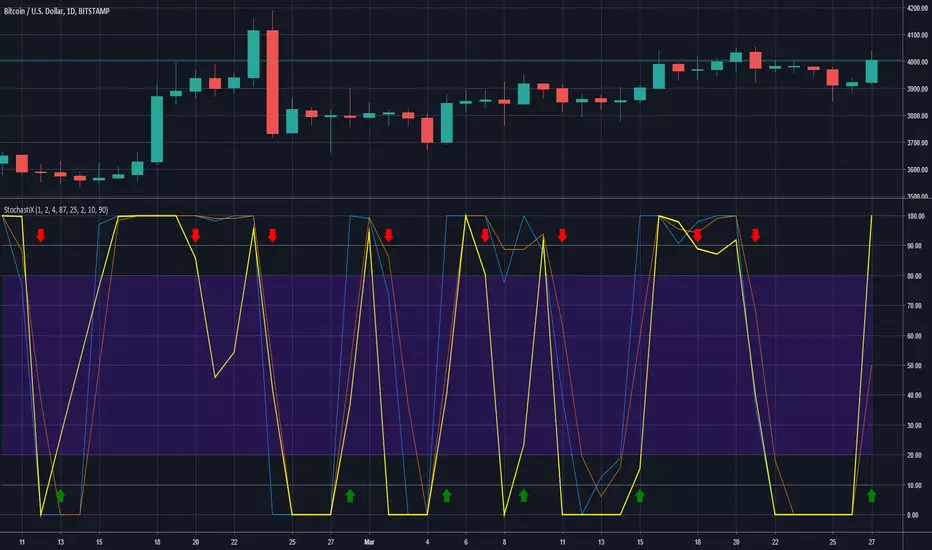
StochastiXThere ya go!!! You actually came to the best indicator there is out there. I hope you enjoy it. If you have any questions just hit me on the chat and i will answer you the best i can. Have a good one ;)
MACD - EURUSD - 1min Long OnlyMACD strategy with a specified level the MACD and signal line must be under. Once the two lines cross under the specified level, a long entry is executed. When the MACD line crosses over the historian, the close entry will be executed. This strategy is designed around the high probability of a reversal in an under-bought trend.
