[blackcat] L2 Ehlers Super Smoother FilterLevel: 2
Background
John F. Ehlers introuced Super Smoother Filter in Jan, 2014.
Function
In “Predictive And Successful Indicators” in Jan, 2014, John Ehlers describes a new method for smoothing market data while reducing the lag that most other smoothing techniques have. And this is a very popular filter to eliminate noise of market signal.
Key Signal
Filt --> Ehlers Super Smoother Filter fast line
Trigger --> Ehlers Super Smoother Filter slow line
Pros and Cons
100% John F. Ehlers definition translation, even variable names are the same. This help readers who would like to use pine to read his book.
Remarks
The 100th script for Blackcat1402 John F. Ehlers Week publication.
Readme
In real life, I am a prolific inventor. I have successfully applied for more than 60 international and regional patents in the past 12 years. But in the past two years or so, I have tried to transfer my creativity to the development of trading strategies. Tradingview is the ideal platform for me. I am selecting and contributing some of the hundreds of scripts to publish in Tradingview community. Welcome everyone to interact with me to discuss these interesting pine scripts.
The scripts posted are categorized into 5 levels according to my efforts or manhours put into these works.
Level 1 : interesting script snippets or distinctive improvement from classic indicators or strategy. Level 1 scripts can usually appear in more complex indicators as a function module or element.
Level 2 : composite indicator/strategy. By selecting or combining several independent or dependent functions or sub indicators in proper way, the composite script exhibits a resonance phenomenon which can filter out noise or fake trading signal to enhance trading confidence level.
Level 3 : comprehensive indicator/strategy. They are simple trading systems based on my strategies. They are commonly containing several or all of entry signal, close signal, stop loss, take profit, re-entry, risk management, and position sizing techniques. Even some interesting fundamental and mass psychological aspects are incorporated.
Level 4 : script snippets or functions that do not disclose source code. Interesting element that can reveal market laws and work as raw material for indicators and strategies. If you find Level 1~2 scripts are helpful, Level 4 is a private version that took me far more efforts to develop.
Level 5 : indicator/strategy that do not disclose source code. private version of Level 3 script with my accumulated script processing skills or a large number of custom functions. I had a private function library built in past two years. Level 5 scripts use many of them to achieve private trading strategy.
Ehlers

[blackcat] L2 Ehlers RSI with NETLevel: 2
Background
John F. Ehlers introuced RSI with Noise Elimination Technology (NET) in Dec, 2020.
Function
Many indicators produce more or less noisy output, resulting in false or delayed signals. Dr. Ehlers proposed “Noise Elimination Technology,” in Dec, 2020. He introduces using a Kendall correlation to reduce indicator noise and provide better clarification of the indicator direction. This approach attempts to reduce noise without using smoothing filters, which tend to introduce indicator lag and therefore, delayed decisions. With this script, I use his “MyRSI” indicator, which he introduced in his May 2018 article in S&C, by adding some Tradingview pine v4 code for the noise elimination technology. The indicator plots the MyRSI value as well as the value after applying NET to MyRSI. This de-noising technology uses the Kendall correlation of the indicator with a rising slope. Compared with a lowpass filter, this method does not delay the signals.
The technology appears to work well in this example for removing the noise. But note that the NET function is not meant as a replacement of a lowpass or smoothing filter; its output is always in the -1 to +1 range, so it can be used for de-noising oscillators, but not, for instance, to generate a smoothed version of the price curve.
Key Signal
NET --> Ehlers RSI with NET fast line
Trigger --> Ehlers RSI with NET slow line
Pros and Cons
100% John F. Ehlers definition translation, even variable names are the same. This help readers who would like to use pine to read his book.
Remarks
The 99th script for Blackcat1402 John F. Ehlers Week publication.
Readme
In real life, I am a prolific inventor. I have successfully applied for more than 60 international and regional patents in the past 12 years. But in the past two years or so, I have tried to transfer my creativity to the development of trading strategies. Tradingview is the ideal platform for me. I am selecting and contributing some of the hundreds of scripts to publish in Tradingview community. Welcome everyone to interact with me to discuss these interesting pine scripts.
The scripts posted are categorized into 5 levels according to my efforts or manhours put into these works.
Level 1 : interesting script snippets or distinctive improvement from classic indicators or strategy. Level 1 scripts can usually appear in more complex indicators as a function module or element.
Level 2 : composite indicator/strategy. By selecting or combining several independent or dependent functions or sub indicators in proper way, the composite script exhibits a resonance phenomenon which can filter out noise or fake trading signal to enhance trading confidence level.
Level 3 : comprehensive indicator/strategy. They are simple trading systems based on my strategies. They are commonly containing several or all of entry signal, close signal, stop loss, take profit, re-entry, risk management, and position sizing techniques. Even some interesting fundamental and mass psychological aspects are incorporated.
Level 4 : script snippets or functions that do not disclose source code. Interesting element that can reveal market laws and work as raw material for indicators and strategies. If you find Level 1~2 scripts are helpful, Level 4 is a private version that took me far more efforts to develop.
Level 5 : indicator/strategy that do not disclose source code. private version of Level 3 script with my accumulated script processing skills or a large number of custom functions. I had a private function library built in past two years. Level 5 scripts use many of them to achieve private trading strategy.

[blackcat] L2 Ehlers Truncated BP FilterLevel: 2
Background
John F. Ehlers introuced Truncated BandPass (BP) Filter in Jul, 2020.
Function
In Dr. Ehlers' article “Truncated Indicators” in Jul, 2020, he introduces a method that can be used to modify some indicators, improving how accurately they are able to track and respond to price action. By limiting the data range, that is, truncating the data, indicators may be able to better handle extreme price events. A reasonable goal, especially during times of high volatility. John Ehlers shows how to improve a bandpass filter’s ability to reflect price by limiting the data range. Filtering out the temporary spikes and price extremes should positively affect the indicator stability. Enter a new indicator ——— the Truncated BandPass (BP) filter.
Cumulative indicators, such as the EMA or MACD, are affected not only by previous candles, but by a theoretically infinite history of candles. Although this effect is often assumed to be negligible, John Ehlers demonstrates in his article that it is not so. Or at least not for a narrow-band bandpass filter.
Bandpass filters are normally used for detecting cycles in price curves. But they do not work well with steep edges in the price curve. Sudden price jumps cause a narrow-band filter to “ring like a bell” and generate artificial cycles that can cause false triggers. As a solution, Ehlers proposes to truncate the candle history of the filter. Limiting the history to 10 bars effectively dampened the filter output and produced a better representation of the cycles in the price curve. For limiting the history of a cumulative indicator, John Ehlers proposes “Truncated Indicators,” John Ehlers takes us aside to look at the impact of sharp price movements on two fundamentally different types of filters: finite impulse response, and infinite impulse response filters. Given recent market conditions, this is a very well timed subject.
As demostrated in this script, Ehlers suggests “truncation” as an approach to the way the trader calculates filters. He explains why truncation is not appropriate for finite impulse response filters but why truncation can be beneficial to infinite impulse response filters. He then explains how to apply truncation to infinite impulse response filters using his bandpass filter as an example.
Key Signal
BPT --> Truncated BandPass (BP) Filter fast line
Trigger --> Truncated BandPass (BP) Filter slow line
Pros and Cons
100% John F. Ehlers definition translation, even variable names are the same. This help readers who would like to use pine to read his book.
Remarks
The 98th script for Blackcat1402 John F. Ehlers Week publication.
Readme
In real life, I am a prolific inventor. I have successfully applied for more than 60 international and regional patents in the past 12 years. But in the past two years or so, I have tried to transfer my creativity to the development of trading strategies. Tradingview is the ideal platform for me. I am selecting and contributing some of the hundreds of scripts to publish in Tradingview community. Welcome everyone to interact with me to discuss these interesting pine scripts.
The scripts posted are categorized into 5 levels according to my efforts or manhours put into these works.
Level 1 : interesting script snippets or distinctive improvement from classic indicators or strategy. Level 1 scripts can usually appear in more complex indicators as a function module or element.
Level 2 : composite indicator/strategy. By selecting or combining several independent or dependent functions or sub indicators in proper way, the composite script exhibits a resonance phenomenon which can filter out noise or fake trading signal to enhance trading confidence level.
Level 3 : comprehensive indicator/strategy. They are simple trading systems based on my strategies. They are commonly containing several or all of entry signal, close signal, stop loss, take profit, re-entry, risk management, and position sizing techniques. Even some interesting fundamental and mass psychological aspects are incorporated.
Level 4 : script snippets or functions that do not disclose source code. Interesting element that can reveal market laws and work as raw material for indicators and strategies. If you find Level 1~2 scripts are helpful, Level 4 is a private version that took me far more efforts to develop.
Level 5 : indicator/strategy that do not disclose source code. private version of Level 3 script with my accumulated script processing skills or a large number of custom functions. I had a private function library built in past two years. Level 5 scripts use many of them to achieve private trading strategy.
[blackcat] L2 Ehlers Correlation Trend StrategyLevel: 2
Background
John F. Ehlers introuced Correlation Trend Strategy in May, 2020.
Function
In Dr. Ehlers article “Correlation As A Trend Indicator” in May, 2020, he introduces a new trend indicator that is based on the correlation between a security’s price history and the ideal trend: a straight line. He describes methods for using the indicator to not only identify the onset of new trends but to identify trend failures as well. The indicator helps to identify the onset of a trend or to detect the failure of a trend. While his correlation trend indicator measures the price correlation with a rising slope, the new correlation cycle indicator (CCY) measures the correlation with a sine wave .
Key Signal
CorrF --> Correlation Trend Strategy fast line
CorrS --> Correlation Trend Strategy slow line
Pros and Cons
100% John F. Ehlers definition translation, even variable names are the same. This help readers who would like to use pine to read his book.
Remarks
The 97th script for Blackcat1402 John F. Ehlers Week publication.
Readme
In real life, I am a prolific inventor. I have successfully applied for more than 60 international and regional patents in the past 12 years. But in the past two years or so, I have tried to transfer my creativity to the development of trading strategies. Tradingview is the ideal platform for me. I am selecting and contributing some of the hundreds of scripts to publish in Tradingview community. Welcome everyone to interact with me to discuss these interesting pine scripts.
The scripts posted are categorized into 5 levels according to my efforts or manhours put into these works.
Level 1 : interesting script snippets or distinctive improvement from classic indicators or strategy. Level 1 scripts can usually appear in more complex indicators as a function module or element.
Level 2 : composite indicator/strategy. By selecting or combining several independent or dependent functions or sub indicators in proper way, the composite script exhibits a resonance phenomenon which can filter out noise or fake trading signal to enhance trading confidence level.
Level 3 : comprehensive indicator/strategy. They are simple trading systems based on my strategies. They are commonly containing several or all of entry signal, close signal, stop loss, take profit, re-entry, risk management, and position sizing techniques. Even some interesting fundamental and mass psychological aspects are incorporated.
Level 4 : script snippets or functions that do not disclose source code. Interesting element that can reveal market laws and work as raw material for indicators and strategies. If you find Level 1~2 scripts are helpful, Level 4 is a private version that took me far more efforts to develop.
Level 5 : indicator/strategy that do not disclose source code. private version of Level 3 script with my accumulated script processing skills or a large number of custom functions. I had a private function library built in past two years. Level 5 scripts use many of them to achieve private trading strategy.
[blackcat] L2 Ehlers Correlation CycleLevel: 2
Background
John F. Ehlers introuced Correlation Cycle indicator in Jun, 2020.
Function
In his article “Correlation As A Cycle Indicator” in Jun, 2020, John Ehlers introduces a companion to the trend indicator he presented in his article. This new indicator is designed to help traders navigate cycling markets. The new cycle indicator can help the trader get into trades earlier and have better insight into prevailing market conditions. While his correlation trend indicator measures the price correlation with a rising slope, the new correlation cycle indicator (CCY) measures the correlation with a sine wave.The new system trades only when the market state is 1 or -1, indicating trend regime. It goes out of the market when the market state is 0.
Key Signal
State --> +1 for long and -1 for short
Pros and Cons
100% John F. Ehlers definition translation, even variable names are the same. This help readers who would like to use pine to read his book.
Remarks
The 96th script for Blackcat1402 John F. Ehlers Week publication.
Readme
In real life, I am a prolific inventor. I have successfully applied for more than 60 international and regional patents in the past 12 years. But in the past two years or so, I have tried to transfer my creativity to the development of trading strategies. Tradingview is the ideal platform for me. I am selecting and contributing some of the hundreds of scripts to publish in Tradingview community. Welcome everyone to interact with me to discuss these interesting pine scripts.
The scripts posted are categorized into 5 levels according to my efforts or manhours put into these works.
Level 1 : interesting script snippets or distinctive improvement from classic indicators or strategy. Level 1 scripts can usually appear in more complex indicators as a function module or element.
Level 2 : composite indicator/strategy. By selecting or combining several independent or dependent functions or sub indicators in proper way, the composite script exhibits a resonance phenomenon which can filter out noise or fake trading signal to enhance trading confidence level.
Level 3 : comprehensive indicator/strategy. They are simple trading systems based on my strategies. They are commonly containing several or all of entry signal, close signal, stop loss, take profit, re-entry, risk management, and position sizing techniques. Even some interesting fundamental and mass psychological aspects are incorporated.
Level 4 : script snippets or functions that do not disclose source code. Interesting element that can reveal market laws and work as raw material for indicators and strategies. If you find Level 1~2 scripts are helpful, Level 4 is a private version that took me far more efforts to develop.
Level 5 : indicator/strategy that do not disclose source code. private version of Level 3 script with my accumulated script processing skills or a large number of custom functions. I had a private function library built in past two years. Level 5 scripts use many of them to achieve private trading strategy.

[blackcat] L2 Ehlers Reflex CrossLevel: 2
Background
John F. Ehlers introuced Reflex Cross indicator in Feb, 2020.
Function
In “Reflex: A New Zero-Lag Indicator” in Feb, 2020, John Ehlers introduces a new averaging indicator that he has designed with reducing lag in mind. According to the Dr . Ehlers , this new indicator can be used to generate signals in a more timely manner than other lagging calculations. The script displays the Reflex Cross indicator discussed in the article. The reflex indicator synchronizes with the cycle component in the price data. Its companion, the trendflex oscillator, retains the trend component.
Key Signal
FastRF --> Ehlers Reflex Cross fast line
SlowRF --> Ehlers Reflex Cross slow line
Pros and Cons
100% John F. Ehlers definition translation, even variable names are the same. This help readers who would like to use pine to read his book.
Remarks
The 95th script for Blackcat1402 John F. Ehlers Week publication.
Readme
In real life, I am a prolific inventor. I have successfully applied for more than 60 international and regional patents in the past 12 years. But in the past two years or so, I have tried to transfer my creativity to the development of trading strategies. Tradingview is the ideal platform for me. I am selecting and contributing some of the hundreds of scripts to publish in Tradingview community. Welcome everyone to interact with me to discuss these interesting pine scripts.
The scripts posted are categorized into 5 levels according to my efforts or manhours put into these works.
Level 1 : interesting script snippets or distinctive improvement from classic indicators or strategy. Level 1 scripts can usually appear in more complex indicators as a function module or element.
Level 2 : composite indicator/strategy. By selecting or combining several independent or dependent functions or sub indicators in proper way, the composite script exhibits a resonance phenomenon which can filter out noise or fake trading signal to enhance trading confidence level.
Level 3 : comprehensive indicator/strategy. They are simple trading systems based on my strategies. They are commonly containing several or all of entry signal, close signal, stop loss, take profit, re-entry, risk management, and position sizing techniques. Even some interesting fundamental and mass psychological aspects are incorporated.
Level 4 : script snippets or functions that do not disclose source code. Interesting element that can reveal market laws and work as raw material for indicators and strategies. If you find Level 1~2 scripts are helpful, Level 4 is a private version that took me far more efforts to develop.
Level 5 : indicator/strategy that do not disclose source code. private version of Level 3 script with my accumulated script processing skills or a large number of custom functions. I had a private function library built in past two years. Level 5 scripts use many of them to achieve private trading strategy.

[blackcat] L2 Ehlers Trendflex CrossLevel: 2
Background
John F. Ehlers introuced Trendflex indicator in Feb, 2020.
Function
In “Reflex: A New Zero-Lag Indicator” in Feb, 2020, John Ehlers introduces a new averaging indicator that he has designed with reducing lag in mind. According to the Dr. Ehlers, this new indicator can be used to generate signals in a more timely manner than other lagging calculations. The script displays the trendflex indicator discussed in the article. The reflex indicator synchronizes with the cycle component in the price data. Its companion, the trendflex oscillator, retains the trend component.
Key Signal
FastTF --> Ehlers Trendflex fast line
SlowTF --> Ehlers Trendflex slow line
Pros and Cons
100% John F. Ehlers definition translation, even variable names are the same. This help readers who would like to use pine to read his book.
Remarks
The 94th script for Blackcat1402 John F. Ehlers Week publication.
Readme
In real life, I am a prolific inventor. I have successfully applied for more than 60 international and regional patents in the past 12 years. But in the past two years or so, I have tried to transfer my creativity to the development of trading strategies. Tradingview is the ideal platform for me. I am selecting and contributing some of the hundreds of scripts to publish in Tradingview community. Welcome everyone to interact with me to discuss these interesting pine scripts.
The scripts posted are categorized into 5 levels according to my efforts or manhours put into these works.
Level 1 : interesting script snippets or distinctive improvement from classic indicators or strategy. Level 1 scripts can usually appear in more complex indicators as a function module or element.
Level 2 : composite indicator/strategy. By selecting or combining several independent or dependent functions or sub indicators in proper way, the composite script exhibits a resonance phenomenon which can filter out noise or fake trading signal to enhance trading confidence level.
Level 3 : comprehensive indicator/strategy. They are simple trading systems based on my strategies. They are commonly containing several or all of entry signal, close signal, stop loss, take profit, re-entry, risk management, and position sizing techniques. Even some interesting fundamental and mass psychological aspects are incorporated.
Level 4 : script snippets or functions that do not disclose source code. Interesting element that can reveal market laws and work as raw material for indicators and strategies. If you find Level 1~2 scripts are helpful, Level 4 is a private version that took me far more efforts to develop.
Level 5 : indicator/strategy that do not disclose source code. private version of Level 3 script with my accumulated script processing skills or a large number of custom functions. I had a private function library built in past two years. Level 5 scripts use many of them to achieve private trading strategy.

[blackcat] L2 Ehlers Voss Filter StrategyLevel: 2
Background
John F. Ehlers introuced Voss Filter Strategy in Aug, 2019.
Function
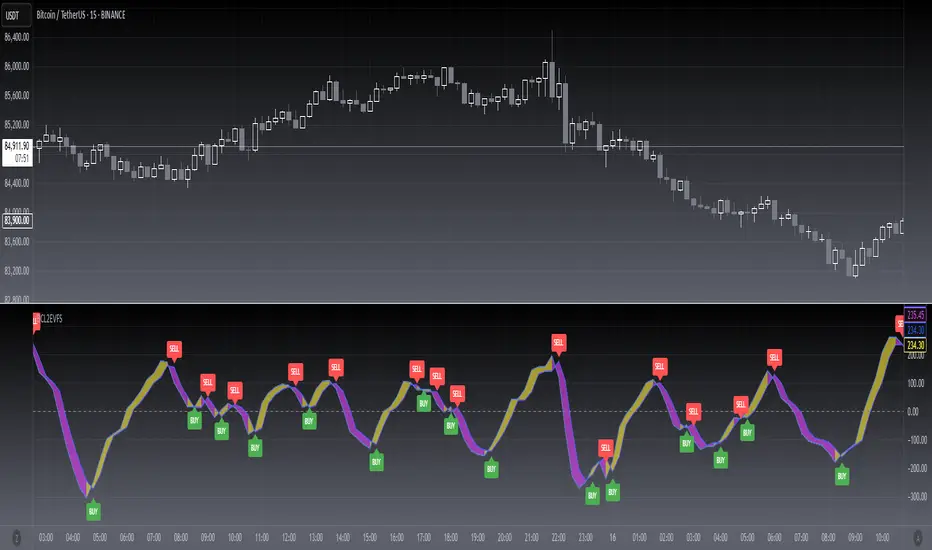
John Ehlers’ mining of the digital signal processing literature space in his article in this issue, “A Peek Into The Future,” brings us another interesting tool for seeing a bit below the noise surrounding price series to better locate turning points. In “A Peek Into The Future” in Aug, 2019, John Ehlers describes the calculation of a new filter that could help signal cyclical turning points in markets. As described by Dr. Ehlers, the filter has a negative group delay and while an indicator based on it cannot actually see into the future, it may provide the trader with signals in advance of other indicators. Noticing that the indicator accurately tracks the market’s peaks and valleys, Ehlers suggests that simple crossovers of the forward-looking Voss predictor with the two-pole band-pass filter may become the basis of a trading system. Having looked at the paper by Henning Voss, I personally appreciate Ehlers’ ability to reduce the calculus of the Voss presentation to six simple lines of code. I thought that the predictive nature of the VossPredictor would be a good candidate to use for one of the current favorite areas of exploration, self-tuning indicators.
Key Signal
Voss --> Ehlers Voss Filter fast line
Trigger --> Ehlers Voss Filter slow line
Pros and Cons
100% John F. Ehlers definition translation, even variable names are the same. This help readers who would like to use pine to read his book.
Remarks
The 93th script for Blackcat1402 John F. Ehlers Week publication.
Readme
In real life, I am a prolific inventor. I have successfully applied for more than 60 international and regional patents in the past 12 years. But in the past two years or so, I have tried to transfer my creativity to the development of trading strategies. Tradingview is the ideal platform for me. I am selecting and contributing some of the hundreds of scripts to publish in Tradingview community. Welcome everyone to interact with me to discuss these interesting pine scripts.
The scripts posted are categorized into 5 levels according to my efforts or manhours put into these works.
Level 1 : interesting script snippets or distinctive improvement from classic indicators or strategy. Level 1 scripts can usually appear in more complex indicators as a function module or element.
Level 2 : composite indicator/strategy. By selecting or combining several independent or dependent functions or sub indicators in proper way, the composite script exhibits a resonance phenomenon which can filter out noise or fake trading signal to enhance trading confidence level.
Level 3 : comprehensive indicator/strategy. They are simple trading systems based on my strategies. They are commonly containing several or all of entry signal, close signal, stop loss, take profit, re-entry, risk management, and position sizing techniques. Even some interesting fundamental and mass psychological aspects are incorporated.
Level 4 : script snippets or functions that do not disclose source code. Interesting element that can reveal market laws and work as raw material for indicators and strategies. If you find Level 1~2 scripts are helpful, Level 4 is a private version that took me far more efforts to develop.
Level 5 : indicator/strategy that do not disclose source code. private version of Level 3 script with my accumulated script processing skills or a large number of custom functions. I had a private function library built in past two years. Level 5 scripts use many of them to achieve private trading strategy.
[blackcat] L2 Ehlers Fourier Series StrategyLevel: 2
Background
John F. Ehlers introuced Fourier Series Strategy in Jun, 2019.
Function
In “Fourier Series Model Of The Market” in Jun, 2019, John Ehlers introduces a Fourier series indicator designed to help traders identify cycles in the market. According to the author, the approach based on five principles outlined by J.M. Hurst in his 1970 book allows the determinization of a security’s primary cycle period and gives a faithful picture of market activity. It does so by applying a set of band-pass filters. His trading model’s rules are:
## 1. Buy next bar at market open when the FourierSeries(20) has reached a new 200-bar low and then turns up. This is an example of a “self-tuning” model, a concept we’ve been working with recently at Quantacula. Rather than establish an arbitrary oversold level, we use the historical data itself to look for an appropriate reversal level.
## 2. Sell at a limit price equal to the highest two-bar high. We’ve found that this exit works well to capture small gains in markets that are due for an upside move, while reducing exposure.
Key Signal
ROC --> Ehlers Fourier Series Strategy fast line
Trigger --> Ehlers Fourier Series Strategy slow line
Pros and Cons
100% John F. Ehlers definition translation, even variable names are the same. This help readers who would like to use pine to read his book.
NOTE: I did not figure out how to improve this indicator's performance because is not so good as my expectation. Whatever, I just keep it 100% as Ehlers original work to inspire you.
Remarks
The 92th script for Blackcat1402 John F. Ehlers Week publication.
Readme
In real life, I am a prolific inventor. I have successfully applied for more than 60 international and regional patents in the past 12 years. But in the past two years or so, I have tried to transfer my creativity to the development of trading strategies. Tradingview is the ideal platform for me. I am selecting and contributing some of the hundreds of scripts to publish in Tradingview community. Welcome everyone to interact with me to discuss these interesting pine scripts.
The scripts posted are categorized into 5 levels according to my efforts or manhours put into these works.
Level 1 : interesting script snippets or distinctive improvement from classic indicators or strategy. Level 1 scripts can usually appear in more complex indicators as a function module or element.
Level 2 : composite indicator/strategy. By selecting or combining several independent or dependent functions or sub indicators in proper way, the composite script exhibits a resonance phenomenon which can filter out noise or fake trading signal to enhance trading confidence level.
Level 3 : comprehensive indicator/strategy. They are simple trading systems based on my strategies. They are commonly containing several or all of entry signal, close signal, stop loss, take profit, re-entry, risk management, and position sizing techniques. Even some interesting fundamental and mass psychological aspects are incorporated.
Level 4 : script snippets or functions that do not disclose source code. Interesting element that can reveal market laws and work as raw material for indicators and strategies. If you find Level 1~2 scripts are helpful, Level 4 is a private version that took me far more efforts to develop.
Level 5 : indicator/strategy that do not disclose source code. private version of Level 3 script with my accumulated script processing skills or a large number of custom functions. I had a private function library built in past two years. Level 5 scripts use many of them to achieve private trading strategy.

[blackcat] L2 Ehlers Fisherized Deviation Scaled OscillatorLevel: 2
Background
John F. Ehlers introuced Fisherized Deviation Scaled Oscillator in Oct, 2018.
Function
In “Probability—Probably A Good Thing To Know,” John Ehlers introduces a procedure for measuring an indicator’s probability distribution to determine if it can be used as part of a reversion-to-the-mean trading strategy. Dr. Ehlers demonstrates this method with several of his existing indicators and presents a new indicator that he calls a deviation-scaled oscillator with Fisher transform. It charts the probability density of an oscillator to evaluate its applicability to swing trading.
Key Signal
FisherFilt --> Ehlers Fisherized Deviation Scaled Oscillator fast line
Trigger --> Ehlers Fisherized Deviation Scaled Oscillator slow line
Pros and Cons
100% John F. Ehlers definition translation, even variable names are the same. This help readers who would like to use pine to read his book.
Remarks
The 91th script for Blackcat1402 John F. Ehlers Week publication.
Readme
In real life, I am a prolific inventor. I have successfully applied for more than 60 international and regional patents in the past 12 years. But in the past two years or so, I have tried to transfer my creativity to the development of trading strategies. Tradingview is the ideal platform for me. I am selecting and contributing some of the hundreds of scripts to publish in Tradingview community. Welcome everyone to interact with me to discuss these interesting pine scripts.
The scripts posted are categorized into 5 levels according to my efforts or manhours put into these works.
Level 1 : interesting script snippets or distinctive improvement from classic indicators or strategy. Level 1 scripts can usually appear in more complex indicators as a function module or element.
Level 2 : composite indicator/strategy. By selecting or combining several independent or dependent functions or sub indicators in proper way, the composite script exhibits a resonance phenomenon which can filter out noise or fake trading signal to enhance trading confidence level.
Level 3 : comprehensive indicator/strategy. They are simple trading systems based on my strategies. They are commonly containing several or all of entry signal, close signal, stop loss, take profit, re-entry, risk management, and position sizing techniques. Even some interesting fundamental and mass psychological aspects are incorporated.
Level 4 : script snippets or functions that do not disclose source code. Interesting element that can reveal market laws and work as raw material for indicators and strategies. If you find Level 1~2 scripts are helpful, Level 4 is a private version that took me far more efforts to develop.
Level 5 : indicator/strategy that do not disclose source code. private version of Level 3 script with my accumulated script processing skills or a large number of custom functions. I had a private function library built in past two years. Level 5 scripts use many of them to achieve private trading strategy.

[blackcat] L2 Ehlers Rocket RSI IndicatorLevel: 2
Background
John F. Ehlers introuced Rocket RSI Indicator in May, 2018.
Function
In “RocketRSI—A Solid Propellant For Your Rocket Science Trading” in May, 2018, John Ehlers introduces a new take on the classic RSI indicator originally developed by J. Welles Wilder. Ehlers begins by introducing a new version of the RSI based on a simple accumulation of up and down closes rather than averages. To this he applies a Fisher transform. He tells us that the resultant output is statistically significant spikes that indicate cyclic turning points with precision.
With this indicator, overbought and oversold conditions are clear:
## Oversold Entry Condition: Indicator crosses value (RocketRSI crosses over -2.00)
## Overbought Exit Condition: Indicator crosses value (RocketRSI crosses under 2.00)
Note the used “crosses under 2.00” for the exit condition, rather than “crosses above 2.00.” This lets the winning positions ride further, and resulted in a better overall return in backtesting.
Key Signal
RocketRSI --> Ehlers Rocket RSI Indicator fast line
Trigger --> Ehlers Rocket RSI Indicator slow line
Pros and Cons
100% John F. Ehlers definition translation, even variable names are the same. This help readers who would like to use pine to read his book.
Remarks
The 90th script for Blackcat1402 John F. Ehlers Week publication.
Readme
In real life, I am a prolific inventor. I have successfully applied for more than 60 international and regional patents in the past 12 years. But in the past two years or so, I have tried to transfer my creativity to the development of trading strategies. Tradingview is the ideal platform for me. I am selecting and contributing some of the hundreds of scripts to publish in Tradingview community. Welcome everyone to interact with me to discuss these interesting pine scripts.
The scripts posted are categorized into 5 levels according to my efforts or manhours put into these works.
Level 1 : interesting script snippets or distinctive improvement from classic indicators or strategy. Level 1 scripts can usually appear in more complex indicators as a function module or element.
Level 2 : composite indicator/strategy. By selecting or combining several independent or dependent functions or sub indicators in proper way, the composite script exhibits a resonance phenomenon which can filter out noise or fake trading signal to enhance trading confidence level.
Level 3 : comprehensive indicator/strategy. They are simple trading systems based on my strategies. They are commonly containing several or all of entry signal, close signal, stop loss, take profit, re-entry, risk management, and position sizing techniques. Even some interesting fundamental and mass psychological aspects are incorporated.
Level 4 : script snippets or functions that do not disclose source code. Interesting element that can reveal market laws and work as raw material for indicators and strategies. If you find Level 1~2 scripts are helpful, Level 4 is a private version that took me far more efforts to develop.
Level 5 : indicator/strategy that do not disclose source code. private version of Level 3 script with my accumulated script processing skills or a large number of custom functions. I had a private function library built in past two years. Level 5 scripts use many of them to achieve private trading strategy.
[blackcat] L2 Ehlers Recursive Median OscillatorLevel: 2
Background
John F. Ehlers introuced Recursive Median Oscillator in Mar, 2018.
Function
In “Recursive Median Filters” in Mar, 2018, John Ehlers presented an approach for filtering out extreme price and volume data that could throw off typical averaging calculations. Dr. Ehlers’ line in digital signal processing extends to removing extreme spikes in financial data, but utilizing the median average value in the recursive filter calculations. By removing these extremities, the actual extremities that occur in the underlying data may be better determined. Ehlers goes on to present a novel oscillator using this technique, comparing its response to the well-known RSI. He notes that by being able to smooth the data with the least amount of lag, the recursive median oscillator may give the trader a better view of the bigger picture.
The recursive median filter (RMF) ignores the spiking-types of the price noise. RMF uses an exponential moving average of the five-period median of the source data to produce a smoothing of the signal while avoiding spikes. The recursive median oscillator (RMO) is an oscillator built along the same principles. The RMO has less lag and a faster response to the larger moves in the price data.
Key Signal
RMO --> Ehlers Recursive Median Oscillator fast line
RMO --> Ehlers Recursive Median Oscillator slow line
Pros and Cons
100% John F. Ehlers definition translation, even variable names are the same. This help readers who would like to use pine to read his book.
Remarks
The 89th script for Blackcat1402 John F. Ehlers Week publication.
Readme
In real life, I am a prolific inventor. I have successfully applied for more than 60 international and regional patents in the past 12 years. But in the past two years or so, I have tried to transfer my creativity to the development of trading strategies. Tradingview is the ideal platform for me. I am selecting and contributing some of the hundreds of scripts to publish in Tradingview community. Welcome everyone to interact with me to discuss these interesting pine scripts.
The scripts posted are categorized into 5 levels according to my efforts or manhours put into these works.
Level 1 : interesting script snippets or distinctive improvement from classic indicators or strategy. Level 1 scripts can usually appear in more complex indicators as a function module or element.
Level 2 : composite indicator/strategy. By selecting or combining several independent or dependent functions or sub indicators in proper way, the composite script exhibits a resonance phenomenon which can filter out noise or fake trading signal to enhance trading confidence level.
Level 3 : comprehensive indicator/strategy. They are simple trading systems based on my strategies. They are commonly containing several or all of entry signal, close signal, stop loss, take profit, re-entry, risk management, and position sizing techniques. Even some interesting fundamental and mass psychological aspects are incorporated.
Level 4 : script snippets or functions that do not disclose source code. Interesting element that can reveal market laws and work as raw material for indicators and strategies. If you find Level 1~2 scripts are helpful, Level 4 is a private version that took me far more efforts to develop.
Level 5 : indicator/strategy that do not disclose source code. private version of Level 3 script with my accumulated script processing skills or a large number of custom functions. I had a private function library built in past two years. Level 5 scripts use many of them to achieve private trading strategy.

[blackcat] L2 Ehlers Reverse EMALevel: 2
Background
John F. Ehlers introuced Reverse EMA in Sep, 2017.
Function
In “The Reverse EMA Indicator” in Sep, 2017, John Ehlers presented very interesting filtering technique based on a Z-transform of the exponential moving average. It is a causal forward and backward EMA indicator that could be used in real trading. It has double smoothing at the high end of the spectrum to reduce aliased components and is able to mitigate the impact of spectral dilation at the low end. The author described the indicator as having unique flexibility in that it could display trend or cycle information by varying the alpha parameter and do this with very low lag.
Key Signal
TrendRevEMA --> Ehlers Reverse EMA slow line
CycleRevEMA --> Ehlers Reverse EMA fast line
Pros and Cons
100% John F. Ehlers definition translation, even variable names are the same. This help readers who would like to use pine to read his book.
Remarks
The 88th script for Blackcat1402 John F. Ehlers Week publication.
Readme
In real life, I am a prolific inventor. I have successfully applied for more than 60 international and regional patents in the past 12 years. But in the past two years or so, I have tried to transfer my creativity to the development of trading strategies. Tradingview is the ideal platform for me. I am selecting and contributing some of the hundreds of scripts to publish in Tradingview community. Welcome everyone to interact with me to discuss these interesting pine scripts.
The scripts posted are categorized into 5 levels according to my efforts or manhours put into these works.
Level 1 : interesting script snippets or distinctive improvement from classic indicators or strategy. Level 1 scripts can usually appear in more complex indicators as a function module or element.
Level 2 : composite indicator/strategy. By selecting or combining several independent or dependent functions or sub indicators in proper way, the composite script exhibits a resonance phenomenon which can filter out noise or fake trading signal to enhance trading confidence level.
Level 3 : comprehensive indicator/strategy. They are simple trading systems based on my strategies. They are commonly containing several or all of entry signal, close signal, stop loss, take profit, re-entry, risk management, and position sizing techniques. Even some interesting fundamental and mass psychological aspects are incorporated.
Level 4 : script snippets or functions that do not disclose source code. Interesting element that can reveal market laws and work as raw material for indicators and strategies. If you find Level 1~2 scripts are helpful, Level 4 is a private version that took me far more efforts to develop.
Level 5 : indicator/strategy that do not disclose source code. private version of Level 3 script with my accumulated script processing skills or a large number of custom functions. I had a private function library built in past two years. Level 5 scripts use many of them to achieve private trading strategy.

[blackcat] L2 Ehlers Super Passband FilterLevel: 2
Background
John F. Ehlers introuced Super Passband Filter in Jul, 2016.
Function
In “The Super Passband Filter” in Jul, 2016, John Ehlers addressed the problem of frequencies in indicators that are too low or too high. The common practice to refine frequency is to enable smart filters. However, good filters take lots of computational power. So Ehlers showed us how to use filters while keep computing power relatively low. John Ehlers described a new oscillator he’s developed to help minimize computational lag. Ehlers called this new oscillator a super passband filter. He has designed it to reject very low-frequency components and thus display as an oscillator as well as reject high-frequency components so as to minimize noise. Ehlers seeked to filter out both high and low frequencies from market data, eliminating distracting “wiggles” from the resultant signal with minimal lag effect. Trigger points for the filter are added with a root mean square (RMS) envelope over the signal line.
## Buy on the filter crossing above its -RMS line
## Short on the filter crossing below its RMS line
## Exit long when the filter either crosses below its RMS or crosses below -RMS (which signifies a false entry signal)
## Cover short when the filter either crosses above its -RMS or crosses above RMS (which signifies a false entry signal)
It suggests that this new nearly-zero lag filter looks promising for countertrend trades and for buying on significant dips.
Key Signal
PB --> Ehlers Super Passband Filter Signal
RMS --> Root Mean Squared Ehlers Super Passband Filter Signal
Pros and Cons
100% John F. Ehlers definition translation, even variable names are the same. This help readers who would like to use pine to read his book.
Remarks
The 86th script for Blackcat1402 John F. Ehlers Week publication.
Readme
In real life, I am a prolific inventor. I have successfully applied for more than 60 international and regional patents in the past 12 years. But in the past two years or so, I have tried to transfer my creativity to the development of trading strategies. Tradingview is the ideal platform for me. I am selecting and contributing some of the hundreds of scripts to publish in Tradingview community. Welcome everyone to interact with me to discuss these interesting pine scripts.
The scripts posted are categorized into 5 levels according to my efforts or manhours put into these works.
Level 1 : interesting script snippets or distinctive improvement from classic indicators or strategy. Level 1 scripts can usually appear in more complex indicators as a function module or element.
Level 2 : composite indicator/strategy. By selecting or combining several independent or dependent functions or sub indicators in proper way, the composite script exhibits a resonance phenomenon which can filter out noise or fake trading signal to enhance trading confidence level.
Level 3 : comprehensive indicator/strategy. They are simple trading systems based on my strategies. They are commonly containing several or all of entry signal, close signal, stop loss, take profit, re-entry, risk management, and position sizing techniques. Even some interesting fundamental and mass psychological aspects are incorporated.
Level 4 : script snippets or functions that do not disclose source code. Interesting element that can reveal market laws and work as raw material for indicators and strategies. If you find Level 1~2 scripts are helpful, Level 4 is a private version that took me far more efforts to develop.
Level 5 : indicator/strategy that do not disclose source code. private version of Level 3 script with my accumulated script processing skills or a large number of custom functions. I had a private function library built in past two years. Level 5 scripts use many of them to achieve private trading strategy.

[blackcat] L2 Ehlers Decycler OscillatorLevel: 2
Background
John F. Ehlers introuced Decycler Oscillator in Sep, 2015.
Function
In “Decyclers” in Sep, 2015, John Ehlers described a method for constructing an oscillator that could help traders detect trend reversals with almost no lag, an oscillator that signals trend reversals with almost zero lag via digital signal processing techniques. A high-pass filter is subtracted from the input data and the high-frequency components are removed via cancellation of terms. Lower-frequency components are filtered from the output, so they are not canceled from the original data. Thus, the decycler displays them with close to zero lag. The fast line has a period of 100 a K value of 1.2 and the slow line has a period of 125 and a K value of 1.
This script demonstrates the timely response of the decycler oscillator to market action. It applies the idea of using a decycler oscillator pair with different parameters, as discussed in Ehlers’ article:
1. Enter long when the fast line crosses over the slow line;
2. Exit long when the fast line crosses under the slow line.
Key Signal
Fast_Val --> Ehlers Decycler Oscillator fast line
Slow_Val --> Ehlers Decycler Oscillator slow line
Pros and Cons
100% John F. Ehlers definition translation, even variable names are the same. This help readers who would like to use pine to read his book.
Remarks
The 85th script for Blackcat1402 John F. Ehlers Week publication.
Readme
In real life, I am a prolific inventor. I have successfully applied for more than 60 international and regional patents in the past 12 years. But in the past two years or so, I have tried to transfer my creativity to the development of trading strategies. Tradingview is the ideal platform for me. I am selecting and contributing some of the hundreds of scripts to publish in Tradingview community. Welcome everyone to interact with me to discuss these interesting pine scripts.
The scripts posted are categorized into 5 levels according to my efforts or manhours put into these works.
Level 1 : interesting script snippets or distinctive improvement from classic indicators or strategy. Level 1 scripts can usually appear in more complex indicators as a function module or element.
Level 2 : composite indicator/strategy. By selecting or combining several independent or dependent functions or sub indicators in proper way, the composite script exhibits a resonance phenomenon which can filter out noise or fake trading signal to enhance trading confidence level.
Level 3 : comprehensive indicator/strategy. They are simple trading systems based on my strategies. They are commonly containing several or all of entry signal, close signal, stop loss, take profit, re-entry, risk management, and position sizing techniques. Even some interesting fundamental and mass psychological aspects are incorporated.
Level 4 : script snippets or functions that do not disclose source code. Interesting element that can reveal market laws and work as raw material for indicators and strategies. If you find Level 1~2 scripts are helpful, Level 4 is a private version that took me far more efforts to develop.
Level 5 : indicator/strategy that do not disclose source code. private version of Level 3 script with my accumulated script processing skills or a large number of custom functions. I had a private function library built in past two years. Level 5 scripts use many of them to achieve private trading strategy.

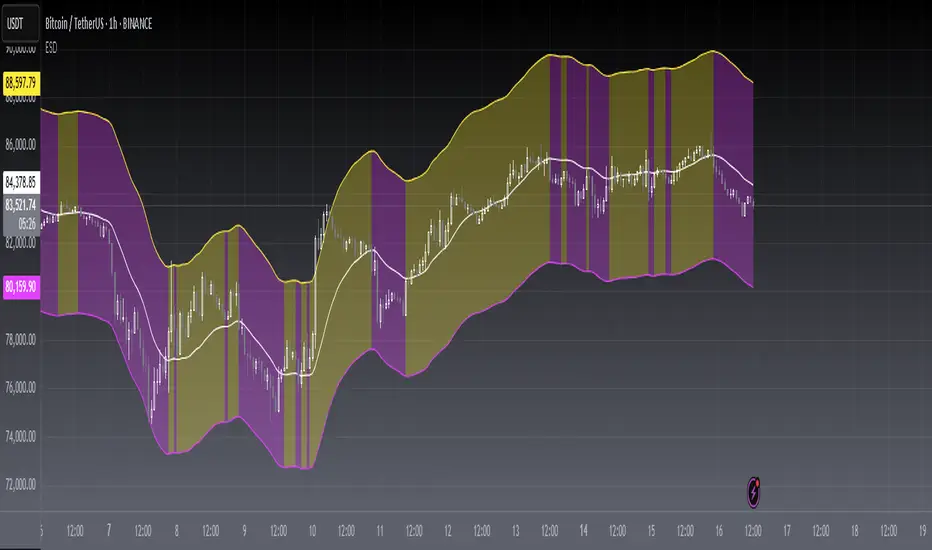
[blackcat] L2 Ehlers Simple DecyclerLevel: 2
Background
John F. Ehlers introuced Simple Decycler in Sep, 2015.
Function
In “Decyclers” in Sep, 2015, John Ehlers described a method for constructing an oscillator that could help traders detect trend reversals with almost no lag. Ehlers calls this new oscillator a decycler. The author began the process by isolating the high-frequency components present in the input data. He then subtracted these from the input data leaving only the lower-frequency components representing the trend. In more details, the idea is to subtract the high-pass filter value from the current close to get a “decycled” indicator that follows the trend rather well by removing much of the distracting high-frequency chatter. Apply a second high-pass filter using half the period from the first filter to the decycled indicator and you get a smoother result with much-reduced lag.
Key Signal
Decycle --> Ehlers Simple Decycler signal or center line of band
Pros and Cons
100% John F. Ehlers definition translation, even variable names are the same. This help readers who would like to use pine to read his book.
Remarks
The 84th script for Blackcat1402 John F. Ehlers Week publication.
Readme
In real life, I am a prolific inventor. I have successfully applied for more than 60 international and regional patents in the past 12 years. But in the past two years or so, I have tried to transfer my creativity to the development of trading strategies. Tradingview is the ideal platform for me. I am selecting and contributing some of the hundreds of scripts to publish in Tradingview community. Welcome everyone to interact with me to discuss these interesting pine scripts.
The scripts posted are categorized into 5 levels according to my efforts or manhours put into these works.
Level 1 : interesting script snippets or distinctive improvement from classic indicators or strategy. Level 1 scripts can usually appear in more complex indicators as a function module or element.
Level 2 : composite indicator/strategy. By selecting or combining several independent or dependent functions or sub indicators in proper way, the composite script exhibits a resonance phenomenon which can filter out noise or fake trading signal to enhance trading confidence level.
Level 3 : comprehensive indicator/strategy. They are simple trading systems based on my strategies. They are commonly containing several or all of entry signal, close signal, stop loss, take profit, re-entry, risk management, and position sizing techniques. Even some interesting fundamental and mass psychological aspects are incorporated.
Level 4 : script snippets or functions that do not disclose source code. Interesting element that can reveal market laws and work as raw material for indicators and strategies. If you find Level 1~2 scripts are helpful, Level 4 is a private version that took me far more efforts to develop.
Level 5 : indicator/strategy that do not disclose source code. private version of Level 3 script with my accumulated script processing skills or a large number of custom functions. I had a private function library built in past two years. Level 5 scripts use many of them to achieve private trading strategy.
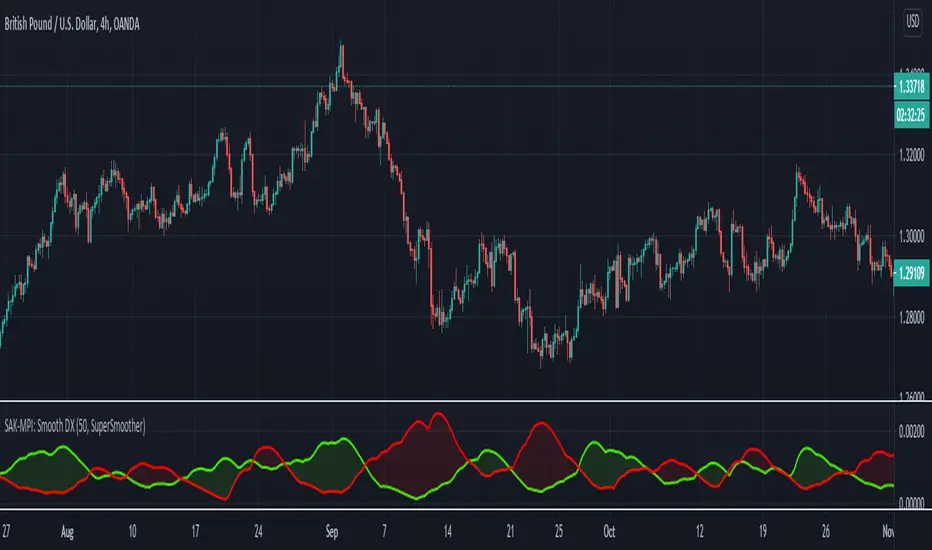
SAK-MPI: Smooth DXDescription : This SwissArmyKnife - MultiPurposeIndicator allows user to modify the Directional index based on one of filtering tools proposed by John F.Ehlers .
Details of each filtering type can be read in Ehlers Technical Papers: "Swiss Army Knife Indicator" and/or his book "Cybernetics Analysis for Stock and Futures"
Disclaimer:
These study scripts was built only to test/visualize an idea to see its viability and if it can be used to optimize existing strategy.
This is experimental indicator. Any ideas to further improve this indicator are welcome :)
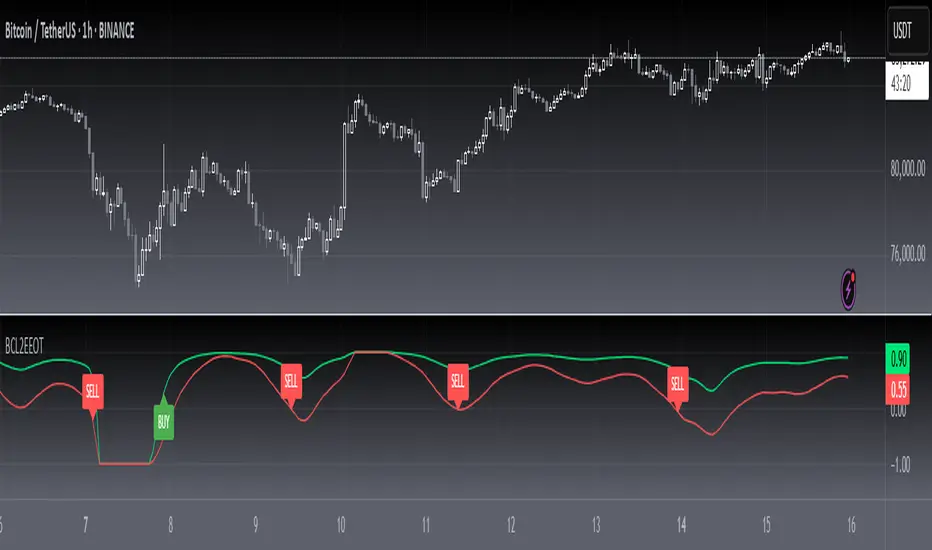
[blackcat] L2 Ehlers Universal OscillatorLevel: 2
Background
John F. Ehlers introuced Universal Oscillator in Jan, 2015.
Function
In “Whiter Is Brighter”, in Jan 2015, John Ehlers presented a new indicator he calls the universal oscillator. It is based on his theory that market data resembles pink noise, or as he puts it, “noise with memory.” It could be used to create a short-term trading strategy. I modified it a little bit by changing the scan criteria that is met when the universal oscillator crosses above or below a pair of threshold values e.g. +/- 0.85. Therefore, a straightforward short-term (small time scale) countertrend system could, for example, use the following rules:
## Cover your short position and go long when the universal oscillator crosses below zero or a overbought/oversold threholds e.g. +/- 0.85; sell and go short when the universal oscillator crosses above zero or a overbought threhold e.g. + 0.85.
Since it is really a universal oscillator, the indicator can power up a trend-trading system just as easily:
## Buy when the long-term universal oscillator crosses above zero or a oversold threshold e.g. - 0.85.
## Sell when the long-term universal oscillator crosses below zero or a overbought threshold e.g. 0.85.
Key Signal
Universal --> Universal Oscillator signal
long ---> long entry signal
short ---> short entry signal
Pros and Cons
99% John F. Ehlers definition translation, even variable names are the same. This help readers who would like to use pine to read his book.
Remarks
The 83th script for Blackcat1402 John F. Ehlers Week publication.
Readme
In real life, I am a prolific inventor. I have successfully applied for more than 60 international and regional patents in the past 12 years. But in the past two years or so, I have tried to transfer my creativity to the development of trading strategies. Tradingview is the ideal platform for me. I am selecting and contributing some of the hundreds of scripts to publish in Tradingview community. Welcome everyone to interact with me to discuss these interesting pine scripts.
The scripts posted are categorized into 5 levels according to my efforts or manhours put into these works.
Level 1 : interesting script snippets or distinctive improvement from classic indicators or strategy. Level 1 scripts can usually appear in more complex indicators as a function module or element.
Level 2 : composite indicator/strategy. By selecting or combining several independent or dependent functions or sub indicators in proper way, the composite script exhibits a resonance phenomenon which can filter out noise or fake trading signal to enhance trading confidence level.
Level 3 : comprehensive indicator/strategy. They are simple trading systems based on my strategies. They are commonly containing several or all of entry signal, close signal, stop loss, take profit, re-entry, risk management, and position sizing techniques. Even some interesting fundamental and mass psychological aspects are incorporated.
Level 4 : script snippets or functions that do not disclose source code. Interesting element that can reveal market laws and work as raw material for indicators and strategies. If you find Level 1~2 scripts are helpful, Level 4 is a private version that took me far more efforts to develop.
Level 5 : indicator/strategy that do not disclose source code. private version of Level 3 script with my accumulated script processing skills or a large number of custom functions. I had a private function library built in past two years. Level 5 scripts use many of them to achieve private trading strategy.

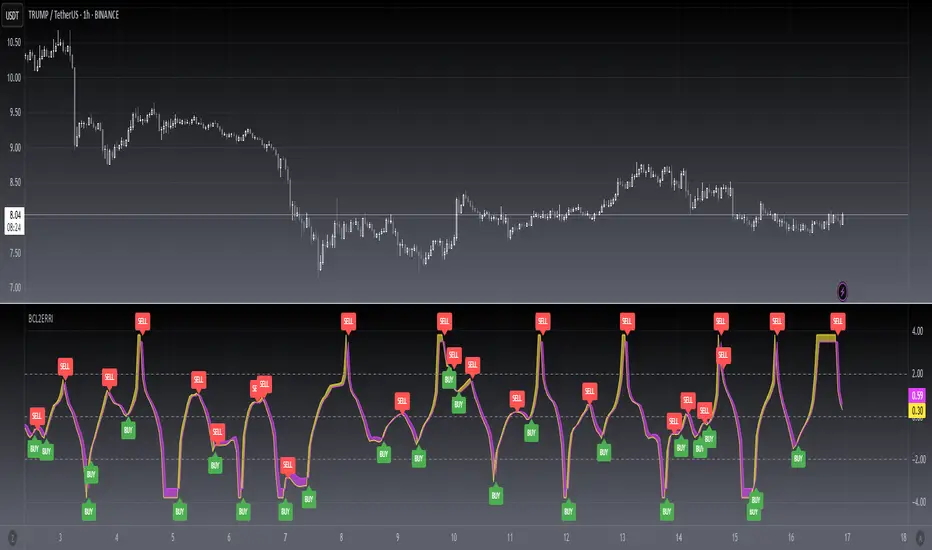
[blackcat] L2 Ehlers Early Onset TrendLevel: 2
Background
John F. Ehlers introuced Early Onset Trend Indicator in Aug, 2014.
Function
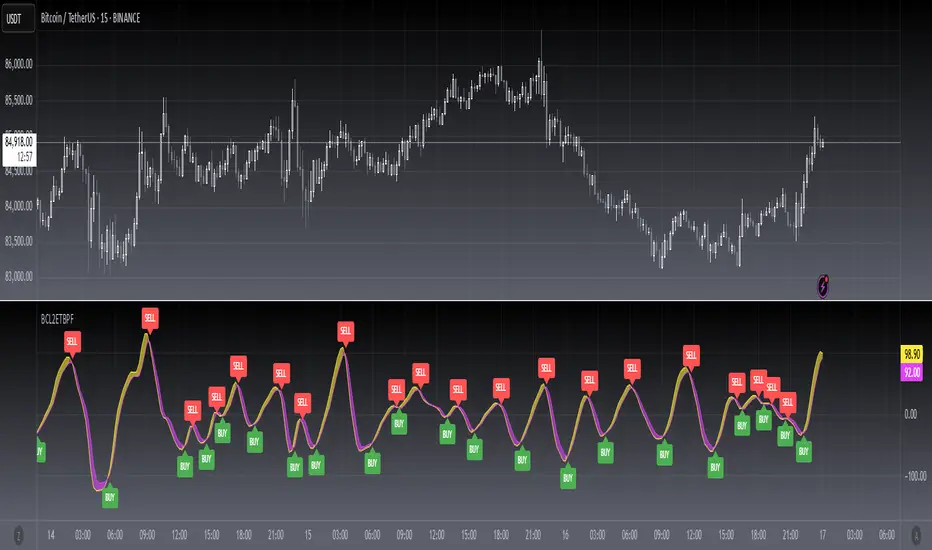
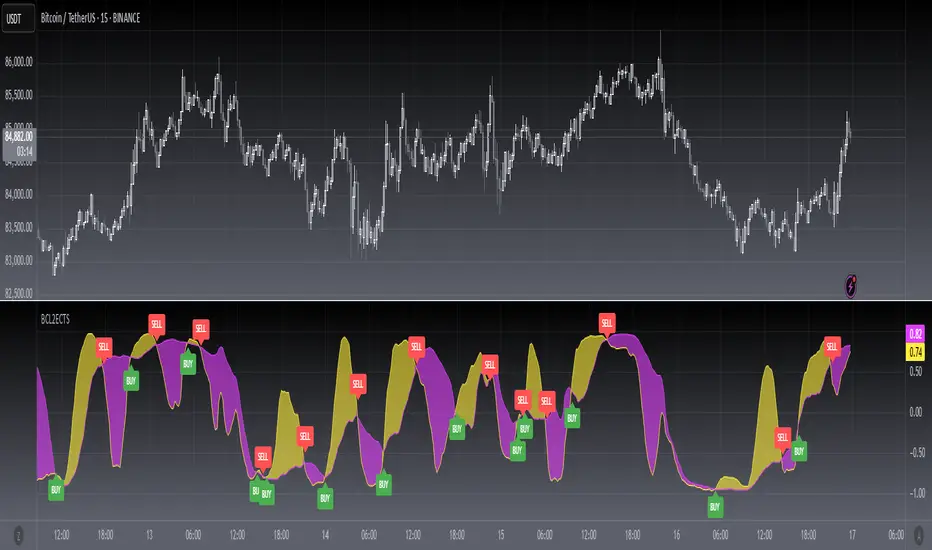
In “The Quotient Transform” in Aug, 2014, John Ehlers described an early trend detection method, the idea of the quotient transform, that was designed to reduce the lag often found in other trend indicators. I provided a script with pine v4 code here for the early-onset trend-detection indicator and also describes an approach for creating a strategy based on this indicator as an example.
The entry points displayed in blue on the price chart are defined by the top Onset Trend Detector upper quotient crossing above a threshold value e.g zero or 0.25/-0.25 here in this script. In the article, Ehlers suggested using a different K value for the exit, so the exit points are determined by the lower Onset Trend Detector quotient crossing below a threshold e.g. zero or -0.25/0.25 here in this script.
Key Signal
Quotient1 --> upper quotient in yellow which determines long entry
Quotient2 --> lower quotient in fuchsia which determines short entry
long ---> long entry signal
short ---> short entry signal
Pros and Cons
100% John F. Ehlers definition translation, even variable names are the same. This help readers who would like to use pine to read his book.
Remarks
The 82th script for Blackcat1402 John F. Ehlers Week publication.
Readme
In real life, I am a prolific inventor. I have successfully applied for more than 60 international and regional patents in the past 12 years. But in the past two years or so, I have tried to transfer my creativity to the development of trading strategies. Tradingview is the ideal platform for me. I am selecting and contributing some of the hundreds of scripts to publish in Tradingview community. Welcome everyone to interact with me to discuss these interesting pine scripts.
The scripts posted are categorized into 5 levels according to my efforts or manhours put into these works.
Level 1 : interesting script snippets or distinctive improvement from classic indicators or strategy. Level 1 scripts can usually appear in more complex indicators as a function module or element.
Level 2 : composite indicator/strategy. By selecting or combining several independent or dependent functions or sub indicators in proper way, the composite script exhibits a resonance phenomenon which can filter out noise or fake trading signal to enhance trading confidence level.
Level 3 : comprehensive indicator/strategy. They are simple trading systems based on my strategies. They are commonly containing several or all of entry signal, close signal, stop loss, take profit, re-entry, risk management, and position sizing techniques. Even some interesting fundamental and mass psychological aspects are incorporated.
Level 4 : script snippets or functions that do not disclose source code. Interesting element that can reveal market laws and work as raw material for indicators and strategies. If you find Level 1~2 scripts are helpful, Level 4 is a private version that took me far more efforts to develop.
Level 5 : indicator/strategy that do not disclose source code. private version of Level 3 script with my accumulated script processing skills or a large number of custom functions. I had a private function library built in past two years. Level 5 scripts use many of them to achieve private trading strategy.
[blackcat] L2 Ehlers Super Smooth Stoch StrategyLevel: 2
Background
John F. Ehlers introuced Super Smooth Stochastic Indicator in Jan, 2014.
Function
In “Predictive And Successful Indicators” of in, 2014, John Ehlers presented another innovative way to eliminate noise from classic indicators and introduces some new smoothing indicators: the SuperSmoother filter, which is superior to moving averages for removing aliasing noise, and the MESA Stochastic oscillator, a stochastic successor that removes the effect of spectral dilation through the use of a roofing filter.
John Ehlers described a new method for smoothing market data while reducing the lag that most other smoothing techniques have. Ehlers had provided an approach for creating a strategy. For convenience, I made the same code available at tradingview pine v4 as well as an example strategy based on Ehlers’ description. Ehlers introduced a simple countertrend system that goes long when MESA Stochastic crosses below the oversold value and reverses the trade by taking a short position when the oscillator exceeds the overbought threshold.
Key Signal
MyStochastic --> Super Smooth Stochastic line
long ---> long entry signal
short ---> short entry signal
Pros and Cons
100% John F. Ehlers definition translation, even variable names are the same. This help readers who would like to use pine to read his book.
Remarks
The 81th script for Blackcat1402 John F. Ehlers Week publication.
Readme
In real life, I am a prolific inventor. I have successfully applied for more than 60 international and regional patents in the past 12 years. But in the past two years or so, I have tried to transfer my creativity to the development of trading strategies. Tradingview is the ideal platform for me. I am selecting and contributing some of the hundreds of scripts to publish in Tradingview community. Welcome everyone to interact with me to discuss these interesting pine scripts.
The scripts posted are categorized into 5 levels according to my efforts or manhours put into these works.
Level 1 : interesting script snippets or distinctive improvement from classic indicators or strategy. Level 1 scripts can usually appear in more complex indicators as a function module or element.
Level 2 : composite indicator/strategy. By selecting or combining several independent or dependent functions or sub indicators in proper way, the composite script exhibits a resonance phenomenon which can filter out noise or fake trading signal to enhance trading confidence level.
Level 3 : comprehensive indicator/strategy. They are simple trading systems based on my strategies. They are commonly containing several or all of entry signal, close signal, stop loss, take profit, re-entry, risk management, and position sizing techniques. Even some interesting fundamental and mass psychological aspects are incorporated.
Level 4 : script snippets or functions that do not disclose source code. Interesting element that can reveal market laws and work as raw material for indicators and strategies. If you find Level 1~2 scripts are helpful, Level 4 is a private version that took me far more efforts to develop.
Level 5 : indicator/strategy that do not disclose source code. private version of Level 3 script with my accumulated script processing skills or a large number of custom functions. I had a private function library built in past two years. Level 5 scripts use many of them to achieve private trading strategy.

SAK-MPI: Stochastic & RSIDescription : This SwissArmyKnife - MultiPurposeIndicator allows user to modify the conventional indicator smoothing method Stochastic(SMA)/RSI(RMA) to one of filtering tools proposed by John F. Ehlers .
Details of each filtering type can be read in Ehlers Technical Papers: Swiss Army Knife Indicator,
I'm still very new with Digital Signal Processing (DSP) concept and this is my first attempt to help visualize one of Ehlers tools and its practicality (Read: Its experimental).
Any ideas to further improve this indicator are welcome :)
Disclaimer:
I always felt Pinescript is a very fast to type language with excellent visualization capabilities, so I've been using it as code-testing platform prior to actual coding in other platform.
Having said that, these study scripts was built only to test/visualize an idea to see its viability and if it can be used to optimize existing strategy.
While some of it are useful and most are useless, none of it should be use as main decision maker.

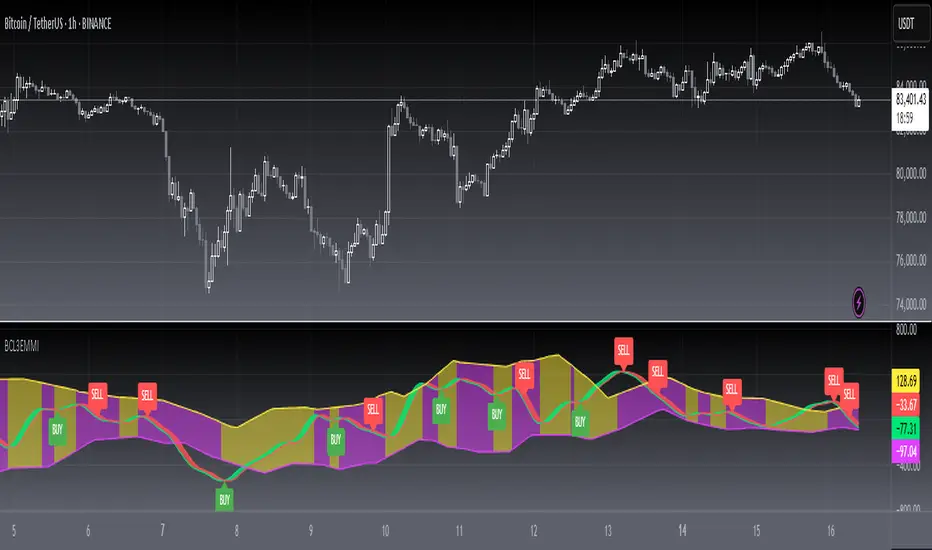
[blackcat] L3 Ehlers Market Mode IndicatorLevel: 3
Background
John F. Ehlers introuced Market Mode Indicator on April, 2012.
Function
This indicator is used to determine whether the market is in a trending or a cyclical mode. This is accomplished by comparing the average value of price, after being filtered to the peaks and valleys of that filtered price. The filter used in this indicator is a second order butterworth filter. For more information on this calculation see "Introducing SwamiCharts" (March 2012) and "Empirical Mode Decomposition" (March 2010) from Technical Analysis of Stocks and Commodities by Dr. Ehlers.
Key Signal
MeanCalc --> short term fast line
MeanCalc(2) --> short term slow line
long ---> long entry signal
short ---> short entry signal
Pros and Cons
NOT 100% John F. Ehlers definition translation, even variable names are the same. This help readers who would like to use pine to read his book.
Remarks
The 80th script for Blackcat1402 John F. Ehlers Week publication.
I kept the core of Ehlers market mode indicator, but add conditons for long and short entries which i think they are reasonable.
Readme
In real life, I am a prolific inventor. I have successfully applied for more than 60 international and regional patents in the past 12 years. But in the past two years or so, I have tried to transfer my creativity to the development of trading strategies. Tradingview is the ideal platform for me. I am selecting and contributing some of the hundreds of scripts to publish in Tradingview community. Welcome everyone to interact with me to discuss these interesting pine scripts.
The scripts posted are categorized into 5 levels according to my efforts or manhours put into these works.
Level 1 : interesting script snippets or distinctive improvement from classic indicators or strategy. Level 1 scripts can usually appear in more complex indicators as a function module or element.
Level 2 : composite indicator/strategy. By selecting or combining several independent or dependent functions or sub indicators in proper way, the composite script exhibits a resonance phenomenon which can filter out noise or fake trading signal to enhance trading confidence level.
Level 3 : comprehensive indicator/strategy. They are simple trading systems based on my strategies. They are commonly containing several or all of entry signal, close signal, stop loss, take profit, re-entry, risk management, and position sizing techniques. Even some interesting fundamental and mass psychological aspects are incorporated.
Level 4 : script snippets or functions that do not disclose source code. Interesting element that can reveal market laws and work as raw material for indicators and strategies. If you find Level 1~2 scripts are helpful, Level 4 is a private version that took me far more efforts to develop.
Level 5 : indicator/strategy that do not disclose source code. private version of Level 3 script with my accumulated script processing skills or a large number of custom functions. I had a private function library built in past two years. Level 5 scripts use many of them to achieve private trading strategy.
[blackcat] L3 Ehlers Enhanced Corona Swing PositionLevel: 3
Background
John F. Ehlers introuced Enhaced Corona Swing Position Indicator in April, 2012.
Function
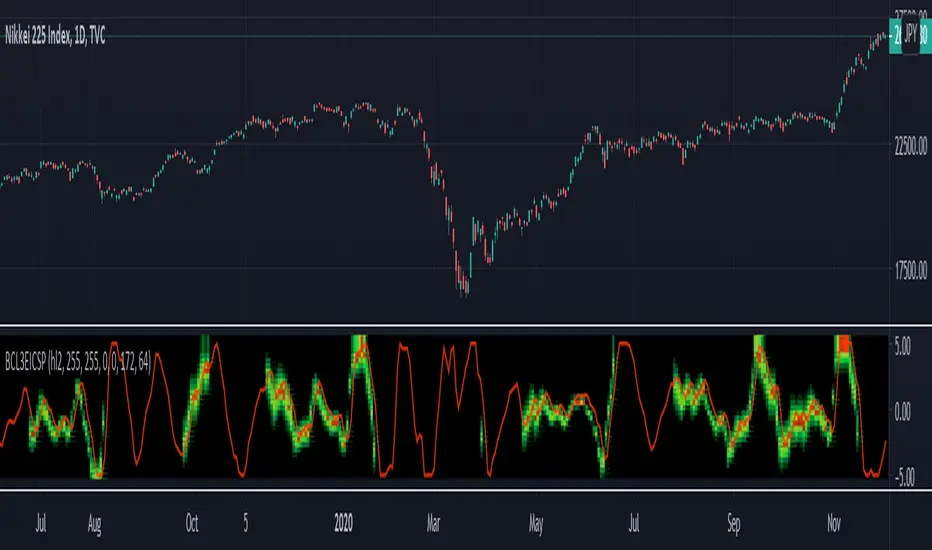
John Ehlers's corona indicators, "Corona Charts," provide a "multidimensional" view of market activity. In the article "Corona Charts" in Nov, 2008, John Ehlers further developed his earlier work on market cycles. A new kind of indicator was presented that uses a glow-like effect to present another dimension of data. Implementation of corona charts in pine v4 helps detect dominant cycles in data. It provides a corona chart for swing positions indicator. He made an enhanced version of corona chart after 4 years, which could be used as a range filter to detect sideways and trends. Dr . Ehlers claims that a corona is displayed when the market is in a trend and there is little cyclic component. The swing position indicator shows the phasing of the data within the dominant cycle. In a pure cycle the Swing Position will trace out the shape of a sine wave.
Key Signal
DomCyc ---> Dominant Cycle
Raster ---> Corona Raster Array
Pros and Cons
100% John F. Ehlers definition translation, even variable names are the same. This help readers who would like to use pine to read his book.
Remarks
The 79th script for Blackcat1402 John F. Ehlers Week publication.
Readme
In real life, I am a prolific inventor. I have successfully applied for more than 60 international and regional patents in the past 12 years. But in the past two years or so, I have tried to transfer my creativity to the development of trading strategies. Tradingview is the ideal platform for me. I am selecting and contributing some of the hundreds of scripts to publish in Tradingview community. Welcome everyone to interact with me to discuss these interesting pine scripts.
The scripts posted are categorized into 5 levels according to my efforts or manhours put into these works.
Level 1 : interesting script snippets or distinctive improvement from classic indicators or strategy. Level 1 scripts can usually appear in more complex indicators as a function module or element.
Level 2 : composite indicator/strategy. By selecting or combining several independent or dependent functions or sub indicators in proper way, the composite script exhibits a resonance phenomenon which can filter out noise or fake trading signal to enhance trading confidence level.
Level 3 : comprehensive indicator/strategy. They are simple trading systems based on my strategies. They are commonly containing several or all of entry signal, close signal, stop loss, take profit, re-entry, risk management, and position sizing techniques. Even some interesting fundamental and mass psychological aspects are incorporated.
Level 4 : script snippets or functions that do not disclose source code. Interesting element that can reveal market laws and work as raw material for indicators and strategies. If you find Level 1~2 scripts are helpful, Level 4 is a private version that took me far more efforts to develop.
Level 5 : indicator/strategy that do not disclose source code. private version of Level 3 script with my accumulated script processing skills or a large number of custom functions. I had a private function library built in past two years. Level 5 scripts use many of them to achieve private trading strategy.