Color Gradient Framework [PineCoders]█ OVERVIEW
This indicator shows how you can use the new color functions in Pine to generate color gradients. We provide functions that will help Pine coders generate gradients for multiple use cases using base colors for bull and bear states.
█ CONCEPTS
For coders interested in maximizing the use of color in their scripts, TradingView has added new color functions and new functionality to existing functions. For us coders, this translates in the ability to generate colors on the fly and use dynamic colors ("series color") in more places.
New functions allow us to:
• Generate colors dynamically from calculated RGBA components ("A" is the Alpha channel, known to Pine coders as the "transparency"). See color.rgb() .
• Extract RGBA components from existing colors. See color.r() , color.g() , color.b() and color.t() .
• Generate linear gradients between two colors. See color.from_gradient() .
Improvements to existing color/plotting functions allow more flexible use of color:
• plotcandle() now accepts a "series color" argument for its `wickcolor` and `bordercolor` parameters.
• plotarrow() now accepts a "series color" argument for its `colorup` and `colordown` parameters.
Gradients are not only useful to make script visuals prettier; they can be used to pack more information in your displays. Our gradient #4 goes overboard with the concept by using a different gradient for the source line, its fill, and the background.
█ OUR SCRIPT
The script presents four functions to generate gradients:
f_c_gradientRelative(_source, _min, _max, _c_bear, _c_bull)
f_c_gradientRelativePro(_source, _min, _max, _c_bearWeak, _c_bearStrong, _c_bullWeak, _c_bullStrong)
f_c_gradientAdvDec(_source, _center, _c_bear, _c_bull)
f_c_gradientAdvDecPro(_source, _center, _steps, _c_bearWeak, _c_bearStrong, _c_bullWeak, _c_bullStrong)
The relative gradient functions are useful to generate gradients on a source that oscillates between known upper/lower limits. They use the relative position of the source between the `_min` and `_max` levels to generate the color. A centerline is derived from the `_min` and `_max` levels. The source's position above/below that centerline determines if the bull/bear color is used, and the relative position of the source between the centerline and the max/min level determines the gradient of the bull/bear color.
The advance/decline gradient functions are useful to generate gradients on a source for which min/max levels are unknown. These functions use source advances and declines to determine a gradient level. The `f_c_gradientAdvDec()` version uses the historical maximum of advances/declines to determine how many correspond to the strongest bull/bear colors, making its gradients adaptive. The `f_c_gradientAdvDecPro()` version requires the explicit number of advances/declines that correspond to the strongest bull/bear colors. This is useful when coloring chart bars, for example, where too many gradient levels are difficult to distinguish. Using the Pro version of the function allows you to limit the number of gradient levels to 5, for example, so that transitions are fewer, but more obvious. The `_center` parameter of the advance/decline functions allows them to determine which of the bull/bear colors to use.
Note that the custom `f_colorNew(_color, _transp)` function we use in our script should soon no longer be necessary, as changes are under way to allow color.new() to accept series arguments.
Inputs
The script's inputs demonstrate one way you can allow users to choose base bull/bear colors. Because users can modify any of the colors, only two are technically needed: one for bull, one for bear, as we do for the configuration of the bull/bear colors for the background in the gradient #4 configuration. Providing a few presets from which users can choose can be useful for color-challenged script users, but that type of inputs has the disadvantage of not rendering optimally in all OS/Browser environments.
You can use the inputs to select one of eight gradient demonstrations to display.
█ THANKS
Thanks to the PineCoders team for validating the code and description of this publication.
Thanks also to the many TradingView devs from multiple teams who made these improvements to Pine colors possible.
Look first. Then leap.
Göstergeler ve stratejiler
[UTILS] Session Input ParserAn utility function to parse session inputs. Extracts hours, minutes and weekdays (if defined) and returns a tuple as the result.
_parseSession(sessionString) => (hourStart, minuteStart, hourEnd, minuteEnd, weekdaysArray)
Examples presented on the chart.

Pinescript - Common Label & Line Array Functions Library by RRBPinescript - Common Label & Line Array Functions Library by RagingRocketBull 2021
Version 1.0
This script provides a library of common array functions for arrays of label and line objects with live testing of all functions.
Using this library you can easily create, update, delete, join label/line object arrays, and get/set properties of individual label/line object array items.
You can find the full list of supported label/line array functions below.
There are several libraries:
- Common String Functions Library
- Standard Array Functions Library
- Common Fixed Type Array Functions Library
- Common Label & Line Array Functions Library
- Common Variable Type Array Functions Library
Features:
- 30 array functions in categories create/update/delete/join/get/set with support for both label/line objects (45+ including all implementations)
- Create, Update label/line object arrays from list/array params
- GET/SET properties of individual label/line array items by index
- Join label/line objects/arrays into a single string for output
- Supports User Input of x,y coords of 5 different types: abs/rel/rel%/inc/inc% list/array, auto transforms x,y input into list/array based on type, base and xloc, translates rel into abs bar indexes
- Supports User Input of lists with shortened names of string properties, auto expands all standard string properties to their full names for use in functions
- Live Output for all/selected functions based on User Input. Test any function for possible errors you may encounter before using in script.
- Output filters: hide all excluded and show only allowed functions using a list of function names
- Output Panel customization options: set custom style, color, text size, and line spacing
Usage:
- select create function - create label/line arrays from lists or arrays (optional). Doesn't affect the update functions. The only change in output should be function name regardless of the selected implementation.
- specify num_objects for both label/line arrays (default is 7)
- specify common anchor point settings x,y base/type for both label/line arrays and GET/SET items in Common Settings
- fill lists with items to use as inputs for create label/line array functions in Create Label/Line Arrays section
- specify label/line array item index and properties to SET in corresponding sections
- select label/line SET function to see the changes applied live
Code Structure:
- translate x,y depending on x,y type, base and xloc as specified in UI (required for all functions)
- expand all shortened standard property names to full names (required for create/update* from arrays and set* functions, not needed for create/update* from lists) to prevent errors in label.new and line.new
- create param arrays from string lists (required for create/update* from arrays and set* functions, not needed for create/update* from lists)
- create label/line array from string lists (property names are auto expanded) or param arrays (requires already expanded properties)
- update entire label/line array or
- get/set label/line array item properties by index
Transforming/Expanding Input values:
- for this script to work on any chart regardless of price/scale, all x*,y* are specified as % increase relative to x0,y0 base levels by default, but user can enter abs x,price values specific for that chart if necessary.
- all lists can be empty, contain 1 or several items, have the same/different lengths. Array Length = min(min(len(list*)), mum_objects) is used to create label/line objects. Missing list items are replaced with default property values.
- when a list contains only 1 item it is duplicated (label name/tooltip is also auto incremented) to match the calculated Array Length
- since this script processes user input, all x,y values must be translated to abs bar indexes before passing them to functions. Your script may provide all data internally and doesn't require this step.
- at first int x, float y arrays are created from user string lists, transformed as described below and returned as x,y arrays.
- translated x,y arrays can then be passed to create from arrays function or can be converted back to x,y string lists for the create from lists function if necessary.
- all translation logic is separated from create/update/set functions for the following reasons:
- to avoid redundant code/dependency on ext functions/reduce local scopes and to be able to translate everything only once in one place - should be faster
- to simplify internal logic of all functions
- because your script may provide all data internally without user input and won't need the translation step
- there are 5 types available for both x,y: abs, rel, rel%, inc, inc%. In addition to that, x can be: bar index or time, y is always price.
- abs - absolute bar index/time from start bar0 (x) or price (y) from 0, is >= 0
- rel - relative bar index/time from cur bar n (x) or price from y0 base level, is >= 0
- rel% - relative % increase of bar index/time (x) or price (y) from corresponding base level (x0 or y0), can be <=> 0
- inc - relative increment (step) for each new level of bar index/time (x) or price (y) from corresponding base level (x0 or y0), can be <=> 0
- inc% - relative % increment (% step) for each new level of bar index/time (x) or price (y) from corresponding base level (x0 or y0), can be <=> 0
- x base level >= 0
- y base level can be 0 (empty) or open, close, high, low of cur bar
- single item x1_list = "50" translates into:
- for x type abs: "50, 50, 50 ..." num_objects times regardless of xloc => x = 50
- for x type rel: "50, 50, 50 ... " num_objects times => x = x_base + 50
- for x type rel%: "50%, 50%, 50% ... " num_objects times => x_base * (1 + 0.5)
- for x type inc: "0, 50, 100 ... " num_objects times => x_base + 50 * i
- for x type inc%: "0%, 50%, 100% ... " num_objects times => x_base * (1 + 0.5 * i)
- when xloc = xloc.bar_index each rel*/inc* value in the above list is then subtracted from n: n - x to convert rel to abs bar index, values of abs type are not affected
- x1_list = "0, 50, 100, ..." of type rel is the same as "50" of type inc
- x1_list = "50, 50, 50, ..." of type abs/rel/rel% produces a sequence of the same values and can be shortened to just "50"
- single item y1_list = "2" translates into (ragardless of yloc):
- for y type abs: "2, 2, 2 ..." num_objects times => y = 2
- for y type rel: "2, 2, 2 ... " num_objects times => y = y_base + 2
- for y type rel%: "2%, 2%, 2% ... " num_objects times => y = y_base * (1 + 0.02)
- for y type inc: "0, 2, 4 ... " num_objects times => y = y_base + 2 * i
- for y type inc%: "0%, 2%, 4% ... " num_objects times => y = y_base * (1 + 0.02 * i)
- when yloc != yloc.price all calculated values above are simply ignored
- y1_list = "0, 2, 4" of type rel% is the same as "2" with type inc%
- y1_list = "2, 2, 2" of type abs/rel/rel% produces a sequence of the same values and can be shortened to just "2"
- you can enter shortened property names in lists. To lookup supported shortened names use corresponding dropdowns in Set Label/Line Array Item Properties sections
- all shortened standard property names must be expanded to full names (required for create/update* from arrays and set* functions, not needed for create/update* from lists) to prevent errors in label.new and line.new
- examples of shortened property names that can be used in lists: bar_index, large, solid, label_right, white, left, left, price
- expanded to their corresponding full names: xloc.bar_index, size.large, line.style_solid, label.style_label_right, color.white, text.align_left, extend.left, yloc.price
- all expanding logic is separated from create/update* from arrays and set* functions for the same reasons as above, and because param arrays already have different types, implying the use of final values.
- all expanding logic is included in the create/update* from lists functions because it seemed more natural to process string lists from user input directly inside the function, since they are already strings.
Creating Label/Line Objects:
- use study max_lines_count and max_labels_count params to increase the max number of label/line objects to 500 (+3) if necessary. Default number of label/line objects is 50 (+3)
- all functions use standard param sequence from methods in reference, except style always comes before colors.
- standard label/line.get* functions only return a few properties, you can't read style, color, width etc.
- label.new(na, na, "") will still create a label with x = n-301, y = NaN, text = "" because max default scope for a var is 300 bars back.
- there are 2 types of color na, label color requires color(na) instead of color_na to prevent error. text_color and line_color can be color_na
- for line to be visible both x1, x2 ends must be visible on screen, also when y1 == y2 => abs(x1 - x2) >= 2 bars => line is visible
- xloc.bar_index line uses abs x1, x2 indexes and can only be within 0 and n ends, where n <= 5000 bars (free accounts) or 10000 bars (paid accounts) limit, can't be plotted into the future
- xloc.bar_time line uses abs x1, x2 times, can't go past bar0 time but can continue past cur bar time into the future, doesn't have a length limit in bars.
- xloc.bar_time line with length = exact number of bars can be plotted only within bar0 and cur bar, can't be plotted into the future reliably because of future gaps due to sessions on some charts
- xloc.bar_index line can't be created on bar 0 with fixed length value because there's only 1 bar of horiz length
- it can be created on cur bar using fixed length x < n <= 5000 or
- created on bar0 using na and then assigned final x* values on cur bar using set_x*
- created on bar0 using n - fixed_length x and then updated on cur bar using set_x*, where n <= 5000
- default orientation of lines (for style_arrow* and extend) is from left to right (from bar 50 to bar 0), it reverses when x1 and x2 are swapped
- price is a function, not a line object property
Variable Type Arrays:
- you can't create an if/function that returns var type value/array - compiler uses strict types and doesn't allow that
- however you can assign array of any type to another array of any type creating an arr pointer of invalid type that must be reassigned to a matching array type before used in any expression to prevent error
- create_any_array2 uses this loophole to return an int_arr pointer of a var type array
- this works for all array types defined with/without var keyword and doesn't work for string arrays defined with var keyword for some reason
- you can't do this with var type vars, only var type arrays because arrays are pointers passed by reference, while vars are actual values passed by value.
- you can only pass a var type value/array param to a function if all functions inside support every type - otherwise error
- alternatively values of every type must be passed simultaneously and processed separately by corresponding if branches/functions supporting these particular types returning a common single type result
- get_var_types solves this problem by generating a list of dummy values of every possible type including the source type, tricking the compiler into allowing a single valid branch to execute without error, while ignoring all dummy results
Notes:
- uses Pinescript v3 Compatibility Framework
- uses Common String Functions Library, Common Fixed Type Array Functions Library, Common Variable Type Array Functions Library
- has to be a separate script to reduce the number of local scopes/compiled file size, can't be merged with another library.
- lets you live test all label/line array functions for errors. If you see an error - change params in UI
- if you see "Loop too long" error - hide/unhide or reattach the script
- if you see "Chart references too many candles" error - change x type or value between abs/rel*. This can happen on charts with 5000+ bars when a rel bar index x is passed to label.new or line.new instead of abs bar index n - x
- create/update_label/line_array* use string lists, while create/update_label/line_array_from_arrays* use array params to create label/line arrays. "from_lists" is dropped to shorten the names of the most commonly used functions.
- create_label/line_array2,4 are preferable, 5,6 are listed for pure demonstration purposes only - don't use them, they don't improve anything but dramatically increase local scopes/compiled file size
- for this reason you would mainly be using create/update_label/line_array2,4 for list params or create/update_label/line_array_from_arrays2 for array params
- all update functions are executed after each create as proof of work and can be disabled. Only create functions are required. Use update functions when necessary - when list/array params are changed by your script.
- both lists and array item properties use the same x,y_type, x,y_base from common settings
- doesn't use pagination, a single str contains all output
- why is this so complicated? What are all these functions for?
- this script merges standard label/line object methods with standard array functions to create a powerful set of label/line object array functions to simplify manipulation of these arrays.
- this library also extends the functionality of Common Variable Type Array Functions Library providing support for label/line types in var type array functions (any_to_str6, join_any_array5)
- creating arrays from either lists or arrays adds a level of flexibility that comes with complexity. It's very likely that in your script you'd have to deal with both string lists as input, and arrays internally, once everything is converted.
- processing user input, allowing customization and targeting for any chart adds a whole new layer of complexity, all inputs must be translated and expanded before used in functions.
- different function implementations can increase/reduce local scopes and compiled file size. Select a version that best suits your needs. Creating complex scripts often requires rewriting your code multiple times to fit the limits, every line matters.
P.S. Don't rely too much on labels, for too often they are fables.
List of functions*:
* - functions from other libraries are not listed
1. Join Functions
Labels
- join_label_object(label_, d1, d2)
- join_label_array(arr, d1, d2)
- join_label_array2(arr, d1, d2, d3)
Lines
- join_line_object(line_, d1, d2)
- join_line_array(arr, d1, d2)
- join_line_array2(arr, d1, d2, d3)
Any Type
- any_to_str6(arr, index, type)
- join_any_array4(arr, d1, d2, type)
- join_any_array5(arr, d, type)
2. GET/SET Functions
Labels
- label_array_get_text(arr, index)
- label_array_get_xy(arr, index)
- label_array_get_fields(arr, index)
- label_array_set_text(arr, index, str)
- label_array_set_xy(arr, index, x, y)
- label_array_set_fields(arr, index, x, y, str)
- label_array_set_all_fields(arr, index, x, y, str, xloc, yloc, label_style, label_color, text_color, text_size, text_align, tooltip)
- label_array_set_all_fields2(arr, index, x, y, str, xloc, yloc, label_style, label_color, text_color, text_size, text_align, tooltip)
Lines
- line_array_get_price(arr, index, bar)
- line_array_get_xy(arr, index)
- line_array_get_fields(arr, index)
- line_array_set_text(arr, index, width)
- line_array_set_xy(arr, index, x1, y1, x2, y2)
- line_array_set_fields(arr, index, x1, y1, x2, y2, width)
- line_array_set_all_fields(arr, index, x1, y1, x2, y2, xloc, extend, line_style, line_color, width)
- line_array_set_all_fields2(arr, index, x1, y1, x2, y2, xloc, extend, line_style, line_color, width)
3. Create/Update/Delete Functions
Labels
- delete_label_array(label_arr)
- create_label_array(list1, list2, list3, list4, list5, d)
- create_label_array2(x_list, y_list, str_list, xloc_list, yloc_list, style_list, color1_list, color2_list, size_list, align_list, tooltip_list, d)
- create_label_array3(x_list, y_list, str_list, xloc_list, yloc_list, style_list, color1_list, color2_list, size_list, align_list, tooltip_list, d)
- create_label_array4(x_list, y_list, str_list, xloc_list, yloc_list, style_list, color1_list, color2_list, size_list, align_list, tooltip_list, d)
- create_label_array5(x_list, y_list, str_list, xloc_list, yloc_list, style_list, color1_list, color2_list, size_list, align_list, tooltip_list, d)
- create_label_array6(x_list, y_list, str_list, xloc_list, yloc_list, style_list, color1_list, color2_list, size_list, align_list, tooltip_list, d)
- update_label_array2(label_arr, x_list, y_list, str_list, xloc_list, yloc_list, style_list, color1_list, color2_list, size_list, align_list, tooltip_list, d)
- update_label_array4(label_arr, x_list, y_list, str_list, xloc_list, yloc_list, style_list, color1_list, color2_list, size_list, align_list, tooltip_list, d)
- create_label_array_from_arrays2(x_arr, y_arr, str_arr, xloc_arr, yloc_arr, style_arr, color1_arr, color2_arr, size_arr, align_arr, tooltip_arr, d)
- create_label_array_from_arrays4(x_arr, y_arr, str_arr, xloc_arr, yloc_arr, style_arr, color1_arr, color2_arr, size_arr, align_arr, tooltip_arr, d)
- update_label_array_from_arrays2(label_arr, x_arr, y_arr, str_arr, xloc_arr, yloc_arr, style_arr, color1_arr, color2_arr, size_arr, align_arr, tooltip_arr, d)
Lines
- delete_line_array(line_arr)
- create_line_array(list1, list2, list3, list4, list5, list6, d)
- create_line_array2(x1_list, y1_list, x2_list, y2_list, xloc_list, extend_list, style_list, color_list, width_list, d)
- create_line_array3(x1_list, y1_list, x2_list, y2_list, xloc_list, extend_list, style_list, color_list, width_list, d)
- create_line_array4(x1_list, y1_list, x2_list, y2_list, xloc_list, extend_list, style_list, color_list, width_list, d)
- create_line_array5(x1_list, y1_list, x2_list, y2_list, xloc_list, extend_list, style_list, color_list, width_list, d)
- create_line_array6(x1_list, y1_list, x2_list, y2_list, xloc_list, extend_list, style_list, color_list, width_list, d)
- update_line_array2(line_arr, x1_list, y1_list, x2_list, y2_list, xloc_list, extend_list, style_list, color_list, width_list, d)
- update_line_array4(line_arr, x1_list, y1_list, x2_list, y2_list, xloc_list, extend_list, style_list, color_list, width_list, d)
- create_line_array_from_arrays2(x1_arr, y1_arr, x2_arr, y2_arr, xloc_arr, extend_arr, style_arr, color_arr, width_arr, d)
- update_line_array_from_arrays2(line_arr, x1_arr, y1_arr, x2_arr, y2_arr, xloc_arr, extend_arr, style_arr, color_arr, width_arr, d)

John Ehlers - The Price RadioPrice curves consist of much noise and little signal. For separating the latter from the former, John Ehlers proposed in the Stocks&Commodities May 2021 issue an unusual approach: Treat the price curve like a radio wave. Apply AM and FM demodulating technology for separating trade signals from the underlying noise.
reference: financial-hacker.com
Adjustable MA & Alternating Extremities [LuxAlgo]Returns a moving average allowing the user to control the amount of lag as well as the amplitude of its overshoots thanks to a parametric kernel. The indicator displays alternating extremities and aims to provide potential points where price might reverse.
Due to user requests, we added the option to display the moving average as candles instead of a solid line.
Settings
Length: MA period, refers to the number of most recent data points to use for its calculation.
Mult: Multiplicative factor for each extremity.
As Smoothed Candles: Allows the user to show the MA as a series of candles instead of a solid line.
Show Alternating Extremities : Determines whether to display the alternating extremities or not.
Lag: Controls the amount of lag of the MA, with higher values returning a MA with more lag.
Overshoot: Controls the amplitude of the overshoots returned by the MA, with higher values increasing the amplitude of the overshoots.
Usage
Moving averages using parametric kernels allows users to have more control over characteristics such as lag or smoothness; this can greatly benefit the analyst. A moving average with reduced lag can be used as a leading moving average in a MA crossover system, while lag will benefit moving averages used as slow MA in a crossover system.
Increasing 'Lag' will increase smoothness while increasing 'overshoot' will reduce lag.
The following indicator puts more emphasis on its alternating extremities, an upper extremity will be shown once the high price crosses the upper extremity, while a low extremity will be shown once the low price crosses the lower extremity. These can be interpreted like extremities of a band indicator.
The MA using a length value of 200 with a multiplicative factor of 1.
In general, extremities will effectively return points where price might potentially bounce in ranging markets while closing prices under trending markets will often be found above an upper extremity and under a lower extremity.
Reducing the lag of the moving average allows the user to obtain a more timely estimate of the underlying trend in the price, with a better fit overall. This allows the user to obtain potentially pertinent extremities where price might reverse upon a break, even under trending markets.
In the above chart, the price initially breaks the upper extremity, however, we can observe that the upper extremity eventually reaches back the price, goes above it, provides a resistance, and effectively indicates a reversal.
Users can plot candles from the moving average, these are fairly similar to heikin-ashi candles in the sense that CandleOpen(t) ≠ CandleClose(t-1) , each point of the candle is calculated as follows for our indicator:
Open = Average between MA(t-1) and MA(t-2)
High = MA using the high price as input
Low = MA using the low price as input
Close = MA using the closing price as input
Details
Lag is defined as the effect of moving averages to reflect past price variations instead of new ones, lag can be observed by the user and is the main cause of false signals. Lag is proportional to the degree of filtering returned by the moving average.
Overshooting is a common effect encountered in non-lagging moving averages, and is defined as the tendency of a moving average to exceed a maximum level (or minimum level, which can be defined as undershooting )
MA and rolling maximum/minimum, both using a length of 50 bars. While we can think of lag as a cost of smoothness, we can think of overshooting as a cost for reduced lag on some occasions.
Explaining the kernel design behind our moving average requires understanding of the logic behind lag reduction in moving averages. This can prove to be complex for non informed users, but let's just focus on the simpler part; moving averages can be defined as a weighted sum between past prices and a set of coefficients (kernel).
MA(t) = b(0)C(t) + b(1)C(t-1) + b(2)C(t-2) + ... + b(n-1)C(t-n-1)
Where n is the period of the moving average. Lag is (non optimally) reduced by "underweighting" past prices - that is multiplying them by negative numbers.
The kernel used in our moving average is based on a modified sinewave. A weighted sum making use of a sinewave as a kernel would return an oscillator centered at 0. We can divide this sinewave by an increasing linear function in order to obtain a kernel allowing us to obtain a low lag moving average instead of a centered oscillator. This is the main idea in the design of the kernel used by our moving average.
The kernel equation of our moving average is:
sin(2πx^α)(1 - x^β)
With 1>x>0 , and where α controls the lag, while β controls the overshoot amplitude.
Using this equation we can obtain the following kernels:
Here only α is changed, while β is equal to 1. Values to the left would represent the coefficients for the most recent prices. Notice how the most significant coefficients are given to the oldest prices in the case where α increases.
Higher overshoot would require more negative values, this is controlled by β
Here only β is changed, while α is equal to 1. Notice how higher values return lower negative coefficients. This effectively increases the overshoots amplitude in our moving average. We can decrease α in order for these negative coefficients to underweight more recent values.
Using α = 0 allows us to simplify the kernel equation to:
1 - x^β
Using this kernel we can obtain more classical moving averages, this can be seen from the following results:
Using β = 1 allows us to obtain a linearly decreasing kernel (the one of a WMA), while increasing allows the kernel to converge toward a rectangular kernel (the one of SMA).

Unicode Font Function V2 - JDThis script is a continuation from Duyck's Unicode font function
A different approach made on this function to able change font type on a single string
Now you can call it as a function to change the font type on every string that you need,
either it is for a Label or regular Text
Shoutout to @Duyck for his amazing works on this function.
Thank you to PineScript Community as well
Let me know if you guys have any suggestion or idea.
Greets,
dddfault

Auto PitchFan, Fib Extension/Retracement and ZigZag by DGT Aᴜᴛᴏ PɪᴛᴄʜFᴀɴ, Fɪʙ Exᴛᴇɴꜱɪᴏɴ/Rᴇᴛʀᴀᴄᴇᴍᴇɴᴛ ᴀɴᴅ ZɪɢZᴀɢ
This study aim to automate PitchFan drawing tool and combines it with Fibonacci Extentions/Retracements and ZigZag.
Common setting options, applied to all components of the study
Deviation , is a multiplier that affects how much the price should deviate from the previous pivot in order for the bar to become a new pivot. Increasing its value is one way to get higher timeframe Levels
Depth , affects the minimum number of bars that will be taken into account when building
Historical PitchFan / Fibonacci Levels option will allow plotting of PitchFan / Fibonacci Levels on previous Pivot Highs/Lows
█ PɪᴛᴄʜFᴀɴ — is a set of rays spreading out of the point of a trend's beginning. These rays inclined with the coefficients formed by a Fibonacci number sequence. It is recommended to adjust the Pitchfan plottings to fit after the first wave of the trend has passed and the correction has clearly begun.
PitchFan rays corresponding to Fibonacci levels appear on a chart and represent inclined lines of support and resistance. Price areas near these rays are estimated areas from which the price can turn around or make a significant rebound. The whole logic of working with a pitchfan is based on one simple idea - if the price has bounced off the level, then the correction is likely to end, and the trend will continue. If the price has broken the first resistance, you should wait for the next level test
- Automatically plots PitchFan Rays, based on Pivot Lows/Highs.
- Ability to set ALERTs for each PitchFan Ray Level
- PitchFan Labels displays the price of the line at the last bar, the price value will be recalculated in each new bar
Please check the link provided below with the educational post of how to apply pitchfork, application of pitchfan is same keeping in mind the recommendation stated above
█ Fɪʙ Rᴇᴛʀᴀᴄᴇᴍᴇɴᴛs / Exᴛᴇɴꜱɪᴏɴꜱ
Fibonacci retracements is a popular instrument used by technical analysts to determine support and resistance areas. In technical analysis, this tool is created by taking two extreme points (usually a peak and a trough) on the chart and dividing the vertical distance by the key Fibonacci coefficients equal to 23.6%, 38.2%, 50%, 61.8%, and 100%.
Fibonacci extensions are a tool that traders can use to establish profit targets or estimate how far a price may travel AFTER a retracement/pullback is finished. Extension levels are also possible areas where the price may reverse.
IMPORTANT NOTE: Fibonacci extensions option may require to do further adjustment of the study parameters for proper usage. Extensions are aimed to be used when a trend is present and they aim to measure how far a price may travel AFTER a retracement/pullback. I will strongly suggest users of this study to check the education post for further details where to use extensions and where to use retracements
- Automatically plots possible Support and Resistance levels, based on Pivot Lows/Highs.
- Ability to set ALERTs for each Fibonacci Extension/Retracement Level
- Labels displays the level and the level price
█ Zɪɢ Zᴀɢ — The Zig Zag indicator is used to help identify price trends and changes in price trends. The Zig Zag indicator plots points on a chart whenever prices reverse by a percentage greater than a Deviation variable. Straight lines are then drawn, connecting these points. The Zig Zag indicator serves base for PitchFan and Fibonacci Retracements / Extensions
█ OTHER
PitchFan is often used in combination with the other indicators and/or drawing tools such as Fibonacci Retracement, Fibonacci Channels, Fibonacci Time Zone and others. It allows identify the most powerful areas from which price can turn and to get more accurate trading signal
Andrews’ Pitchfork, how to apply pitchfork and automated pitchfork study
Fibonacci Fans, how to apply fibonacci fans and automated fibonacci speed and resistance fans study
Fibonacci Extension / Retracement, where to use extensions and where to use retracements and automated fibonacci extension / retracement / pivot points study
Others
Fibonacci Channels, how to apply fibonacci channels and automated fibonacci channels study
Linear Regression Channels, , what linear regression channels are? and linear regression channel/curve/slope study
Disclaimer :
Trading success is all about following your trading strategy and the indicators should fit within your trading strategy, and not to be traded upon solely
The script is for informational and educational purposes only. Use of the script does not constitute professional and/or financial advice. You alone have the sole responsibility of evaluating the script output and risks associated with the use of the script. In exchange for using the script, you agree not to hold dgtrd TradingView user liable for any possible claim for damages arising from any decision you make based on use of the script

Trend Type Indicator by BobRivera990Usage:
The purpose of this indicator is to programmatically determine the type of price trend using technical analysis tools.
You can do a quick check on the asset’s higher and lower time frames. For example, if you are trading on an H1 chart, you can check the m5 chart to ensure that the trend is in the same direction and similarly check the H4 chart to ensure that the higher time frame price is also moving in the same direction.
If multiple time frame charts confirm a similar trend, then it is considered a very strong trend and ideal for Trend trading.
Remarks:
By default, the last status is related to 8 periods before the latest closing price.
Related definitions:
The three basic types of trends are up, down, and sideways.
1. Uptrend
An uptrend describes the price movement of a financial asset when the overall direction is upward. The uptrend is composed of higher swing lows and higher swing highs.
Some market participants ("long" trend traders) only choose to trade during uptrends.
2. Downtrend
A downtrend refers to the price action of a security that moves lower in price as it fluctuates over time.
The downtrend is composed of lower swing lows and lower swing highs.
3. Sideways
A sideways trend is the horizontal price movement that occurs when the forces of supply and demand are nearly equal. This typically occurs during a period of consolidation before the price continues a prior trend or reverses into a new trend.
How it works:
Step 1: Sideways Trend Detection
In this step we want to distinguish the sideways trend from uptrend and downtrend. For this purpose, we use two common technical analysis tools: ATR and ADX
1. Average True Range (ATR)
The average true range (ATR) is a technical analysis indicator that measures market volatility.
We also use a 20-period moving average of the ATR.
When the ATR is below the average of its last 20-periods, it means that the rate of price volatility has decreased and we conclude that the current trend is sideways
2. Average Directional Index (ADX)
The average directional index (ADX) is a technical analysis indicator used by some traders to determine the strength of a trend.
The trend has strength when ADX is above 25.
So when the ADX is less than or equal to 25, there is no strong trend, and we conclude that the current type of trend is sideways.
Step 2: Detect uptrend from downtrend
If it turns out that the current price trend is not sideways, then it is either uptrend or downtrend.
For this purpose, we use plus and minus directional Indicators (+ DI & -DI).
A general interpretation would be that during a strong trend, when +DI is higher than -DI, it is an uptrend. When -DI is higher than +DI, it is a downtrend.
Parameters:
"Use ATR …" ________________________// Use Average True Range (ATR) to detect Sideways Movements
"ATR Length"_______________________ // length of the Average True Range (ATR) used to detect Sideways Movements
"ATR Moving Average Type" ___________// Type of the moving average of the ATR used to detect Sideways Movements
"ATR MA Length" ____________________// length of the moving average of the ATR used to detect Sideways Movements
"Use ADX ..."_______________________ // Use Average Directional Index (ADX) to detect Sideways Movements
"ADX Smoothing”____________________// length of the Average Directional Index (ADX) used to detect Sideways Movements
"DI Length"_________________________// length of the Plus and Minus Directional Indicators (+DI & -DI) used to determine the direction of the trend
"ADX Limit" ________________________// A level of ADX used as the boundary between Trend Market and Sideways Market
"Smoothing Factor"__________________// Factor used for smoothing the oscillator
"Lag"______________________________// lag used to match indicator and chart
Resources:
www.investopedia.com

security free MTF example - JDThis script is not intended for trading purposes but gives some examples how you can get values
from previous candles in other timeframes, without using security calls.
NOTE: the "open", "high" and "low" values are calculated "on the fly", as the bar progresses,
the "close" is determined at the end of the timeframe, so it's only know at the first bar of the next time period
JD.
#NotTradingAdvice #DYOR
Disclaimer.
I AM NOT A FINANCIAL ADVISOR.
THESE IDEAS ARE NOT ADVICE AND ARE FOR EDUCATION PURPOSES ONLY.
ALWAYS DO YOUR OWN RESEARCH!

Reverse Stochastic Momentum Index On ChartIntroducing the Reverse Stochastic Momentum Index "On Chart" version
According to Investopedia :
“The Stochastic Momentum Index (SMI) is a more refined version of the stochastic oscillator, employing a wider range of values and having a higher sensitivity to closing prices.”
The SMI is considered a refinement of the stochastic oscillator developed by William Blau and introduced in 1993 in an attempt to provide a more reliable indicator, less subject to false swings.
It calculates the distance of the current closing price as it relates to the median of the high/low range of price.
The SMI has a normal range of values between +100 and -100.
When the present closing price is higher than the median, or midpoint value of the high/low range, the resulting value is positive.
When the current closing price is lower than that of the midpoint of the high/low range, the SMI has a negative value.
Here I have reverse engineered the SMI formula to derive 2 functions.
One function calculates the chart price at which the SMI will reach a particular SMI scale value.
The second function calculates the chart price at which the SMI will crossover its signal line.
I have employed those functions here to give the "crossover" price levels for :
Upper alert level ( default 40, color : aqua blue )
Mid-Line ( default value 0, color : white )
Lower alert level ( default -40, color : purple )
Signal line ( default 13, colors : bright red & lime green )
And also to give the SMI eq price ( colors : red & green )
The midline, upper and lower alert levels return the closing price which would make SMI equal to their respective values
The user can infer from this that.....
Closing above these prices will cause the Stochastic Momentum Index to cross above the associated levels
Closing below these prices will cause the Stochastic Momentum Index to cross below the associated levels
Signal line returns the closing price where Stochastic Momentum Index is equal to its signal line
The user can infer from this that.....
Closing above this price will cause the Stochastic Momentum Index to cross above the signal line
Closing below this price will cause the Stochastic Momentum Index to cross below the signal line
SMI eq price returns the closing price which would make the SMI equal to its previous value
The user can infer from this that.....
Closing above this price will cause the Stochastic Momentum Index to increase
Closing below this price will cause the Stochastic Momentum Index to decrease
Note : all returned prices have a returned value filter to replace any values below zero with zero to help prevent auto focus issues.
These levels are displayed as plotted lines on the chart and also as an optional infobox with choice of displayed info.
This allows the user to see directly on the chart the interplay between the various crossover levels and price action and to precisely plan entries, exits and stops for their SMI based trades.
Traditionally traders and analysts will consider:
Positives values above 40 indicate a bullish trend
Negative values below -40 indicate a bearish trend .
Common traditional ways to derive signals from the SMI :
When the SMI crosses below -40 and then moves back above it, a buy signal is generated.
When the SMI crosses above +40 and then moves back below it, a sell signal is generated.
When the SMI line crosses above the signal line. A signal to buy is generated
When the SMI line crosses below the signal line signal to sell is generated.
When the SMI crosses above the zeroline, signal line and the SMI eq level many interpret that as a full bullish bias signal and take trades only in that direction, vice versa for bearish bias.
Traders also look for divergences between the SMI and price action.
The SMI is often used in conjunction with the Chande Momentum Oscillator or R squared indicator to determine overall market trendiness where the SMI is used to determine the direction of the trend, and also with volume indicators to show if the momentum carries significant selling or buying pressure.

Tick Data DetailedHello All,
After Tick Chart and Tick Chart RSI scripts, this is Tick Data Detailed script. Like other tick scrips this one only works on real-time bars too. it creates two tables: the table at the right shows the detailed data for Current Bar and the table at the left shows the detailed data for all calculated bars (cumulative). the script checks the volume on each tick and add the tick and volume to the specified level (you can set/change levels)
The volume is multiplied by close price to calculate real volume .There are 7 levels/zones and the default levels are:
0 - 10.000
10.000 - 20.000
20.000 - 50.000
50.000 - 100.000
100.000 - 200.000
200.000 - 400.000
> 400.000
With this info, you will get number of ticks and total volumes on each levels. The idea to separate this levels is in order to know which type of traders trade at that moment. for example volume of whale moves are probably greater than 400.000 or at least 100.000. Or volume of small traders is less than 10.000 or between 20.000-50.000.
You will get info if there is anomaly on each candle as well. what is anomaly definition? Current candle is green but Sell volume is greater than Buy volume or current candle is red but Buy volume is greater than Sell volume . it is shown as (!). you should think/search why/how this anomaly occurs. You can see screenshot about it below.
also "TOTAL" text color changes automatically. if Buy volume is greater than Sell volume then its color becomes Green, if Sell volume is greater than Buy volume then its color becomes Red (or any color you set)
Optionally you can change background and text colors as shown in the example below.
Explanation:
How anomaly is shown:
You can enable coloring background and set the colors as you wish:
And Thanks to @Duyck for letting me use the special characters from his great script.
Enjoy!

Exploring UnicodeThis script demonstrates how to display Unicode characters and symbols, including emoji, in Pine:
• Part 1 displays multi-line labels on hi/lo pivots.
• Part 2 displays price/volume bumps using small up/down arrows plotted with plotchar() .
• Part 3 detects bounces and uses plotshape() to mark them.
You can use our `f_bounceFrom()` function from this part as confirmation for signals in your strategies.
Note that the labels displayed on pivots with the code in Part 1 are plotted in the past. In realtime, they would only appear where they are after 50 bars have elapsed from that point. The other plots are plotted on the bar where their conditions are detected.
You can display thousands of Unicode characters and symbols using Pine. As you can see with our script, it is very easy to do so. The challenge will often be to find the exact symbols you are looking for. Many websites exist to help you explore Unicode characters or symbols. The PineCoders Resources page contains a section presenting a few of them.
Duyck has a Unicode font function script containing functions to convert strings to monospaced Unicode representations. TradingView uses the Trebuchet font for most of its text, including text displayed with Pine scripts. While its numerals are monospace and will align vertically in labels text, Duyck's functions will be handy when you need to convert characters to a monospaced form, so they also align vertically in multi-line labels.
What is Unicode?
Unicode is to character encoding what Wikipedia is to knowledge; it holds codes to a good proportion of the characters or symbols used by humans, past or present. In the early days of computing, environments from different manufacturers often used different character encoding schemes, making transport between them difficult. Unicode solves that challenge. It is a comprehensive encoding scheme that visionaries from Xerox and Apple came up with in the late 80's. The addition of members from the Research Libraries Group, Sun Microsystems, Microsoft, Next and Metaphor created the "Unicode working group" and later, the Unicode Consortium , which continues to improve and manage the Unicode standard.
Theoretically, Unicode encodes values representing characters or glyphs —not their pictorial representations. The letters "A" or "a", or the blue heart emoji "💙" are each represented by a Unicode value. In practice, however, there are many different versions of the Latin alphabet in Unicode. That is how our low pivot label can display different representations of the letters "ITV". The exact rendition of Unicode symbols on a specific device is left to equipment manufacturers and typeface designers.
The current Unicode space is comprised of 17 planes of 65,536 characters each, which allows for more than one million code points . Planes are further divided into character blocks , which typically hold a character set corresponding to one script—or language. Emoticons are in the character block starting at U+1F600.
Look first. Then leap.

Unicode font function - JDPinescript only allows the use of one type of font in texts and label, which causes some inconveniences:
- It's hard to make a label or text "look nice" and clear because it's not possible to use a different font for titles, etc.
- Because the default Pinescript font is not a monospaced font, (in Pinescript different characters have different widths)
this makes it really difficult to align things in a label on different rows
and causes everything to be "all over the place" and look messy
With the workaround in this script, you can "translate" the text string that you want to put in a label into a text with either upper case, bold and/or italic characters,
allowing for more control over the layout of the label text, by adding differently styled titles, control over spacing for columns, etc...
The characters provided in this script are an example of a monospaced font, but can easily be replaced by copy-pasting in other characters in the appropriate section
and the script will then use the new characters as replacements.
This script is to show the possibilities and principles of the functions.
The principles of this framework can be used to build your own go-to "text style conversion" functions, for styles that you use a lot, for example for titles.
A big shoutout to @DonovanWall, for the awesome character replacement idea that I built upon!!!
A shoutout also to the PineCoders community, who provide an infinite source of knowlegde and inspiration!!
Enjoy!
Gr, JD.

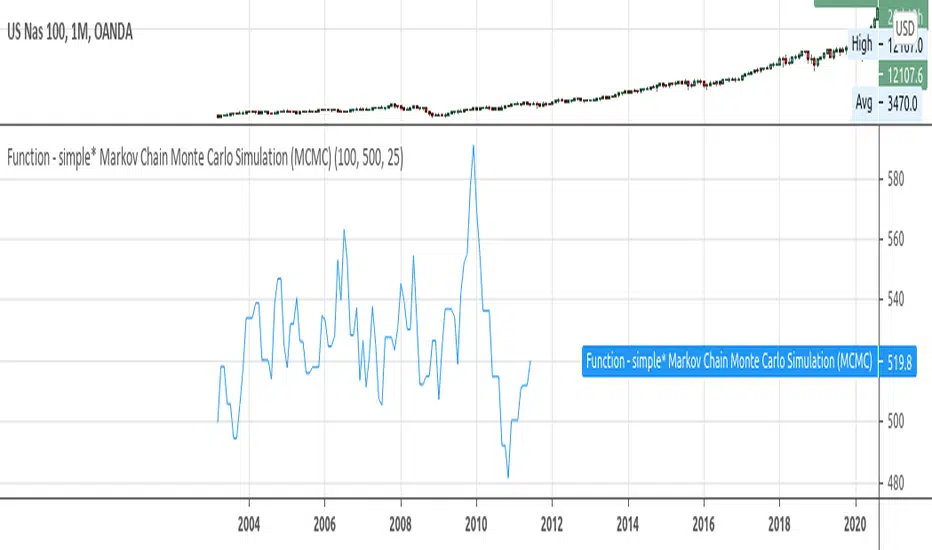
Function - simple* Markov Chain Monte Carlo Simulation (MCMC)Example function of a markov chain monte carlo simulation.
Grid Bot SimulatorThis script is a grid bot simulator for ranging/choppy markets. Prices are divided into grids, or trade zones, that will trigger signals each time a new zone is entered. During ranging markets, each transaction is followed by a “take profit.” As the market starts to trend, transactions are stacked (compare to DCA), until the market consolidates. No signals are triggered above the Upper Limit or Below the Lower Limit.
Settings overview:
Upper Limit/Lower Limit : Highest and Lowest values for entire grid.
Number of Grids : Number of trade zones.
Show Grids : Show or hide all gridlines.
Show Only Current Grids : Only display the grids just above and just below the current trade zone.
High/Low for signals : If enabled, signals are triggered as soon as the price touches the next zone. If disabled, signals are triggered after bar closes. Enable this for “Once Per Bar alerts. Disable for “Once Per Bar Close” alerts.
Highlight Trade Zones
The grid bot should work well during ranging/choppy markets. Each zone will have only one trade, and then will immediately take profit in the next zone.
Ranging/Choppy Market
However, trending markets can produce multiple signals in rapid succession:
Trending Market
If the gridlines are compressing the chart space, enable the “Show Only Current Grids” in settings.
Show Only Current Grids disabled
Show Only Current Grids enabled
When changing symbols, adjust the Upper and Lower Limits to accommodate the new symbol. Otherwise, the chart will look compressed.
XBTUSD chart with ETHUSDT settings
The bot is a proof-of-concept and is considered experimental . Possible future updates will include Fibonacci grids and “smart entry/exits,” depending on the current trend. Comments and suggestions are encouraged.

Auto Fib Speed Resistance Fans by DGTFibonacci Speed and Resistance Fan is an analytical drawing tool used to indicate the support and resistance levels of an existing trend and the price level at which possible changes in the trend may occur.
A Fibonacci Speed Resistance Fan consists of a trend line drawn between two extreme points - a trough and opposing peak or a peak and opposing trough - on which a set of sequential speed resistance lines are drawn above (which represents time) and below (which represents price). These lines are drawn based on time/price percentages of the distance between the beginning and the end of the trend line.
Speed resistance lines not only help to measure trend corrections but also measure the speed of a trend (the rate at which a trendline ascends or descends)
Traders can use the lines of the Fibonacci Speed and Resistance Fan to predict key points of resistance or support, at which they might expect price trends to reverse. Once a trader identifies patterns within a chart, they can use those patterns to predict future price movements and future levels of support and resistance. Traders use the predictions to time their trades. Key support and resistance levels tend to occur frequently at the 61.8-percent level on both uptrends and downtrends.
Please check for further details in the education post that I will share shortly after this publication :
Nobody appears to know whether Fibonacci tools work because markets exhibit some form of natural pattern or because many investors use Fibonacci ratios to predict price movements, making them a self-fulfilling prophecy.
█ Study OPTIONS
Auto Fibonacci Speed and Resistance Fan , the main aim of the study
- Pivot threshold can be adjusted via “Deviation” and “Depth” input options
- Historical Fans option will allow plotting of Speed and Resistance Fans on previous pivot high/lows
- Ability to set ALERTs for the Speed and Resistance Levels
- Price Grid Lines if extended it will result with Fib Retracement levels
- All lines, line levels are customizable, default values are set exactly to the same with the available Fib Speed and Resistance Fan drawing tool
Zig Zag – Derived from build-in Auto Fib Retracement with some customization options.
Example Usages :
Disclaimer :
Trading success is all about following your trading strategy and the indicators should fit within your trading strategy, and not to be traded upon solely
The script is for informational and educational purposes only. Use of the script does not constitute professional and/or financial advice. You alone have the sole responsibility of evaluating the script output and risks associated with the use of the script. In exchange for using the script, you agree not to hold dgtrd TradingView user liable for any possible claim for damages arising from any decision you make based on use of the script
Correlation [array's]This script isn't about creating a correlation script with labels, there is a perfect working example of @Mango2Juice
(Correlation Matrix, which was inspired by @Daveatt's Correlation Matrix)
The intention was making it with the use of as less code as possible, looping through array's
The Pine correlation function doesn't work consistently in a local scope (loop), so I had to work around it
Inspired by @ZenAndTheArtOfTrading's Correlation Meter (using array.covariance and array.stdev) and
especially with the help of @RicardoSantos and @LonesomeTheBlue I've managed to do this
Symbols, timeframe, look-back period, colors and limits can be changed
There is always room for improvement, but I think it shows what is possible.
Many thanks to the people who I've mentioned, and of course to Tradingview!
(Without the Earth nothing can grow)
Cheers!

RedK_Portfolio Tracker v2: few enhancements and display optionsThis is an update for the PTracker v1 that I published couple of days ago. wanted to publish this as a separate script to get a chance to show how the new Portfolio Summary Infobox can be displayed on the price chart as an option. In my opinion, that info box is the most important element in this tool and that's the piece i was most looking for.
quick note here: you can track your portfolio (if not so many positions) by entering something like (without the brackets) in TradingView's chart symbol area - TradingView will resolve these symbols and chart the total -- there's a nice post by our friend @boji1 about this in a lot more details - however, that wouldn't show the stats that i need to look at to track my portfolio on daily basis.
i also made couple of other enhancements, like adding the ability to include "free cash" in the portfolio - While this free cash value will impact the Total P/L and P/L %, as part of the overall portfolio (and the denominator), it will not impact the "cost of positions" or the (current) "value of positions" -- also "Cash" will not count towards the total 10 positions that we can track with this tool.
Using Portfolio Tracker as a floating panel on the price chart
====================================================
By default, when the Portfolio Tracker is added to the chart, it will occupy its own lower panel like the picture above.
if your charts are already busy (like mine :)) - you most probably already have a couple of lower studies and it's crowded there.
in this case, you can use the Object Tree tool after adding the PTracker, to drag it onto the price panel, or you can also do that by right-clicking on the infobox and choose to move up to the price panel.
when you do that, remember to also use the Style settings of PTracker to hide both Portfolio and PnL plots, and choose Scale = no scale - this way you get the infobox to work like a floating panel on the price chart
here's a screenshot that shows this scenario - also shows how the infobox color can be easily changed from the PTracker settings to suit your chart background and for best visibility
i hope this is useful in your trading - i look forward to @TradingView team surprising us with a real portfolio tracking capability soon :)
good luck.
Higher Order PivotsFirst order pivot points are defined as 3 or 5 bar "V" shaped patterns. For example a high with a lower high either side of the peak and in the case of the 5 bar variant with lower highs adjacent to a high below the peak.
Second order pivot points are defined by three first order pivots in the same manner. For example a peak pivot high with a lower pivot high to either side.
Third order pivots follow the same pattern, a peak second order pivot high with two adjacent second order pivot highs.
As it can take a significant and variable amount of time before higher order pivots are confirmed, it is generally inadvisable to use higher order pivots for live trading!
However they can be used for historical analysis. For example to delineate market structure of major market inflections.
For example :
Delineating market structure using 2nd order pivots derived from 3 bar, 1st order pivots
Major market inflections from 3rd order pivots derived from 5 bar, 1st order pivots

RSI Bar ChartA different way to plot several RSI at once,
5 RSI with different options:
- source, length, timeframe
- size of indicator (width)
- color change
- limit change (30, 70), labels will be changed accordingly
- type of RSI line (line, arrow), linewidth
- offset label (at the right)
There are 4 colors (RSI line)
- when RSI > sell limit
- when RSI > 50 but below sell limit
- when RSI < 50 but above buy limit
- when RSI < buy limit
Arrows:
Different size:
Cheers!
[SK] Fibonacci Auto Trend ScouterThe FATS - Fibonacci Auto Trend Scouter automatically draws active trends from 2 different timeframes along with Fibonacci Support and Resistance levels. It also has a Sights feature for each timeframe which points from it's middle towards the current price. The tool is also highly customizable for you to take this indicator over 9000. If you like the tool and it adds value to you - share the love on the like button and visit my profile to check out my other indicators and subscribe, so you're notified of my next scripts and ideas!
Automatic Trend Lines
The indicator takes in 2 timeframes to detect High and Low values from which to draw the trend lines of each timeframe.
As the values change with price movement, the lines are updated. They are color coded for uptrend and downtrend based on the direction of each individual line. Trend lines can be set up to color with only the default value on the configurations panel.
- Toggle on/off Color Coded
- Change Default, Uptrend, Downtrend color
- Change Line Width
- Change Line Style
- Toggle on/off Line Extensions
- Change Extended Line Width
- Change Extended Line Style
- Toggle On/Off labels for 7 data points of each timeframe
Automatic Trend Sights
This is a neat feature that may help you get a better feel for the direction the current movement is heading towards in correlation with the short or medium length timeframe trends. The sight draws a line from the middle vertical point of the trend coordinates towards the current price. They are toggled off by default but can be enabled in the configurations panel.
- Toggle on/off sight on each timeframe
- Change Width
- Change Line Style
Automatic Fibonacci Levels
The tool has a very useful feature to automatically detect the highest and lowest value from the short timeframe to calculate Fibonacci support and resistant levels. To keep the chart area clean, the lines are drawn short by default towards the right side of the price but provide inputs to increase the size of the level lines towards the left and right direction. A triangle label appears to the side of each line which holds the Fibonacci level and price data inside the tooltip, hover over them to activate.
- Toggle on/off color coded
- Change Default, Resistance, Support colors
- Change line size towards the left and right side
- Change line width
- Change Resistance line style
- Change Support line style
- Toggle on/off High and Low source line
- Toggle on/off High and Low source labels

Faith IndicatorThis indicator compares buyers demand with sellers supply volumes and calculates which prevails. Therefore it only works if volume is published. Buyers demand is assumed for a period in which a higher high is reached with more volume. Sellers supply is recognized by a lower low combined with more volume.
The average of sellers supplies is subtracted from buyers demand, the result is graded because a statement like “The faith in this period was ## percent” has no meaning. We can conclude to more faith and less faith but not represent it in some exact number.
This indicator assigns the following grades:
Very high faith graduated as 8
High faith as 6
Good faith as 4
Some Faith as 2
Little Faith as 1
Neither Faith nor Distrust as zero
Self Protection Distrust graduated as -8
Fear Distrust as -6
Anxiety Distrust as -4
Suspicion Distrust as -2
Doubt Distrust as -1
It is presented as a histogram with blue staves pointing up (meaning faith) and red staves pointing down (meaning distrust)
The background is colored using the Hull Agreement Indicator (Hullag), which I published before. Hullag graduates price movements in five grades to which it assigns a background color. These are as follows:
grade 2: blue, clear upward movement
grade 1: green, some upward movement
grade 0: silver, neither upward nor downward movement
grade -1: maroon, some downward movement
grad -2: red, clear downward movement.
Use of the Faith Indicator:
The indicator shows price action/momentum as a background color and volume action analyzed as a grade of faith in the form of a histogram. Usually faith comes together with rising prices (blue/green background) and distrust with lowering prices (red/maroon background), however contrarian situations occur, e.g. lowering prices while the market has good faith. These can be explained by minority sellers who act contrary to the feelings in the market. You can then decide that this might be an unsustainable move of the quotes.
If the faith indicator confirms the price movement, you might assume that the move is meaningful and will go further. Also if you see faith diminishing you might assume that the move is coming to an end and the tide is going to turn.