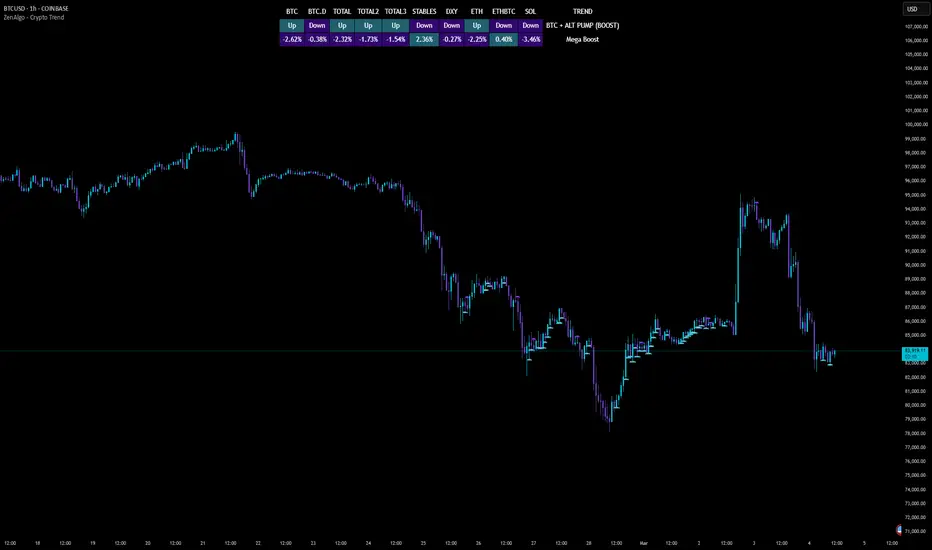
ZenAlgo - Crypto TrendThe ZenAlgo - Crypto Trend indicator is a unique tool for analyzing cryptocurrency market trends, combining data from multiple sources such as BTC , ETH , market caps, dominance metrics, and the DXY index . Unlike standalone indicators, it integrates these data points to deliver actionable insights on macro and micro market movements, helping traders better navigate complex market conditions.
Features
Multi-Asset Trend Analysis: Monitors trends across BTC , ETH , USDT dominance , DXY , SOL , ETHBTC and total market caps ( TOTAL , TOTAL2 , TOTAL3 ), providing a holistic market view.
Dynamic Labels: Real-time market conditions are summarized with labels such as "FIRE SELL," "BTC UP," or "ALT PUMP" for instant clarity.
Customizable Display: Options for dark mode, text size, and table position allow traders to personalize their experience.
Market Sentiment Table: Summarizes trends and percentage changes for multiple assets in a structured, easy-to-read table.
Composite Signals: Identifies unique states like "Mega Boost" or "Outflow" by analyzing the interplay of market trends.
Enhanced Heikin Ashi Analysis: Applies Heikin Ashi trends in a broader context, combining them with other metrics to overcome standalone limitations.
ZenAlgo Theme: A visually distinct and professional theme for enhanced usability.
Added Value: Why Is This Indicator Original/Why Shall You Pay for This Indicator?
The ZenAlgo - Crypto Trend indicator transcends the limitations of free tools in several ways:
Integrated Insights: While Heikin Ashi is freely available, this indicator applies it in tandem with market dominance, total market caps, and macroeconomic indicators like the DXY . This integration creates composite signals (e.g., "Mega Boost," "Defi Mega Boost") that standalone Heikin Ashi cannot provide.
Advanced Contextualization: Free Heikin Ashi indicators lack contextual data about dominance shifts, altcoin performance, and macroeconomic trends. Our indicator integrates these elements to give a broader market perspective.
Time-Saving: Instead of switching between multiple indicators, ZenAlgo - Crypto Trend combines them in one cohesive tool, offering a comprehensive market overview in a single glance.
Custom Features: Unlike generic Heikin Ashi indicators, this tool includes dynamic labels and a market sentiment table that summarize trends and provide immediate insights.
How It Works
1. Heikin Ashi Trend Detection
Calculates smoothed Heikin Ashi trends for BTC , ETH , USDT dominance , DXY , and total market caps ( TOTAL , TOTAL2 , TOTAL3 ).
Functionality: Heikin Ashi values are derived from the weighted average of open, high, low, and close prices. The "open" averages the previous bar's open and close, while the "close" averages the current bar's open, high, low, and close. A trend is assigned as Up (+1) or Down (-1) based on whether the close exceeds the open.
2. Market Metrics Analysis
Tracks daily percentage changes and trends for key metrics like BTC dominance and total market caps.
Outputs: Displays trends (Up/Down) and percentage changes for each asset, helping assess market strength and sentiment.
3. Composite Signal Generation
Combines individual asset trends to define broader market states such as "Mega Boost" or "Outflow."
Logic: Signals are triggered by predefined conditions, e.g., "Mega Boost" occurs when DXY trends down, market caps ( TOTAL , TOTAL2 , TOTAL3 ) trend up, and BTC dominance trends down.
4. Dynamic Labels and Sentiment Table
Displays real-time labels (e.g., "FIRE SELL," "BTC + ALT PUMP") directly on the chart for actionable insights.
A market sentiment table summarizes trends and percentage changes, with customizable display options (position, text size, theme).
Usage Examples
Spotting Bullish Momentum: Use "BTC + ALT PUMP" signals to identify synchronized bullish trends in BTC and altcoins.
Avoiding Bearish Trends: React to "CRYPTO DOWN" or "FIRE SELL" signals to minimize exposure during downturns.
Evaluating Altcoin Opportunities: Identify "ALT PUMP" or "ALTS DUMP" signals to time entries and exits in altcoin markets.
Tracking Dominance Shifts: Monitor "BTC.D UP" or "BTC.D DOWN" trends to assess shifts in market dominance between BTC and altcoins.
Macro Market Awareness: Use "Mega Boost" or "Mega Outflow" states to align with macroeconomic trends, such as dollar strength or weakness.
Seasonal Trends: Observe "ETH PUMP" or "BTC DOWN + ALT PUMP" states to understand specific altcoin or BTC-led market cycles.
Settings
ZenAlgo Theme: Enable a custom ZenAlgo visual style for improved clarity.
Table Text Size: Adjust text size (options: tiny, small, normal, large, huge) for better visibility.
Dark Mode: Toggle dark mode for improved viewing in low-light environments.
Table Position: Choose table placement (e.g., Top Left, Bottom Center) based on your preferences.
Important Notes
Synthetic and Lagging Nature of Heikin Ashi: Heikin Ashi values are synthetic and inherently lagging. They provide smoothed trends but do not represent precise entry or exit points. This indicator does not produce buy or sell signals.
Limitations in Low-Volume Markets: The indicator may underperform in low-liquidity markets or during periods of high volatility, where data discrepancies can distort trends.
Trend Reversals in Choppy Markets: In sideways or choppy markets, the composite signals may lag behind sudden reversals, potentially resulting in delayed recognition of trend changes.
False Positives During Macro News Events: Abrupt macroeconomic news or policy changes can cause the indicator to emit signals (e.g., "Mega Boost") that may not align with sustained market movements.
Dominance Metrics Sensitivity: Heavy reliance on BTC.D or TOTAL3 can sometimes result in misleading insights when these metrics are influenced by atypical events, such as large-scale liquidations or isolated token movements.
Use in Conjunction with Other Tools: While powerful, this indicator should be combined with other technical and fundamental analysis tools for a comprehensive trading strategy.
No Guaranteed Results: Trading involves risk. This tool is designed to support decision-making, not to guarantee trading success.
Dump
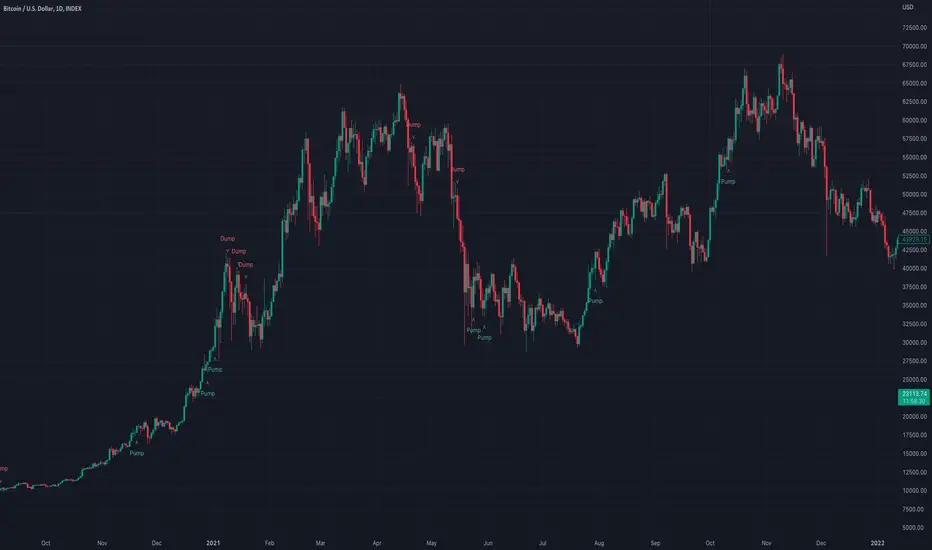
Pump and Dump CandlesDescription:
The Pump and Dump Candles indicator is a robust tool designed to assist traders in identifying potential pump and dump scenarios within the financial markets. This innovative indicator combines key elements of price action and volatility to provide valuable insights into market manipulations and potential risks. This indicator uses ATR to standardize candle sizes as they vary across different assets and timeframes; by using a percentage of the ATR, you can adjust the threshold dynamically based on the volatility of each asset.
Features:
- Pump/dump candles: Candle bars are colored green when it is pumping and red when it is dumping.
- Pump/dump rallies: The background turns green during sequences of consecutive pumping candles and red in the presence of sustained dumping.
- Candle Size Percentage: Users have the flexibility to define a personalized percentage for calculating candle size.
- Wick Exclusion: This option factors in pump and dump candles with substantial body sizes, mitigating the impact of bars with large wicks and smaller candle bodies.
( These inputs can all be modified within the indicator settings )
Utility:
Understanding pump and dump candles and rallies can be a valuable asset for traders seeking to navigate volatile markets effectively. By closely monitoring the color-coded indicators that highlight pumping and dumping phases, traders gain insights into abrupt and often exaggerated price movements. This information aids in identifying potential short-term trends and anticipating market reversals. Pump and dump rallies, signaled by consecutive pumping or dumping candles, provide a visual representation of sustained buying or selling pressure, allowing traders to assess the strength and duration of market sentiment. Armed with this knowledge, traders can make informed decisions, implement risk management strategies, and capitalize on short-term opportunities, thereby enhancing their overall trading proficiency in dynamic market conditions.

BTFD strategy [3min]Hello
I would like to introduce a very simple strategy to buy lows and sell with minimal profit
This strategy works very well in the markets when there is no clear trend and in other words, the trend going sideways
this strategy works very well for stable financial markets like spx500, nasdaq100 and dow jones 30
two indicators were used to determine the best time to enter the market:
volume + rsi values
volume is usually the number of stocks or contracts traded over a certain period of time. Thus, it is an important indicator of market activity and liquidity. Each transaction constitutes an individual exchange between the buyer and the seller and constitutes the trading volume of a given instrument or asset.
The RSI measures the strength of uptrends versus downtrends. The signal is the entry or exit of the indicator value of the oversold or overbought level of the market. It is assumed that a value below or equal 30 indicates an oversold level of the market, and an RSI value above or equal 70 indicates an overbought level.
the strategy uses a maximum of 5 market entries after each candle that meets the condition
uses 5 target point levels to close the position:
tp1= 0.4%
tp2= 0.6%
tp3= 0.8%
tp4= 1.0%
tp5= 1.2%
after reaching a given profit value, a piece of the position is cut off gradually, where tp5 closes 100% of the remaining position
each time you enter a position, a stop loss of 5.0% is set, which is quite a high value, however, when buying each, sometimes very active downward price movement, you need a lot of space for market decisions in which direction it wants to go
to determine the level of stop loss and target point I used a piece of code by RafaelZioni , here is the script from which a piece of code was taken
this strategy is used for automation, however, I would recommend brokers that have the lowest commission values when opening and closing positions, because the strategy generates very high commission costs
Enjoy and trade safe ;)

Scalp Pump-Dump Detector with AlertsThis script displays the percentage of movement of all candles on the chart, as well as identifying abnormal movements to which you can attach alerts. An abnormal movement is considered a rise or fall that exceeds the parameter set in the settings (by default, 1% per 1 bar).
Added a function to display the volume on abnormal candlesticks.

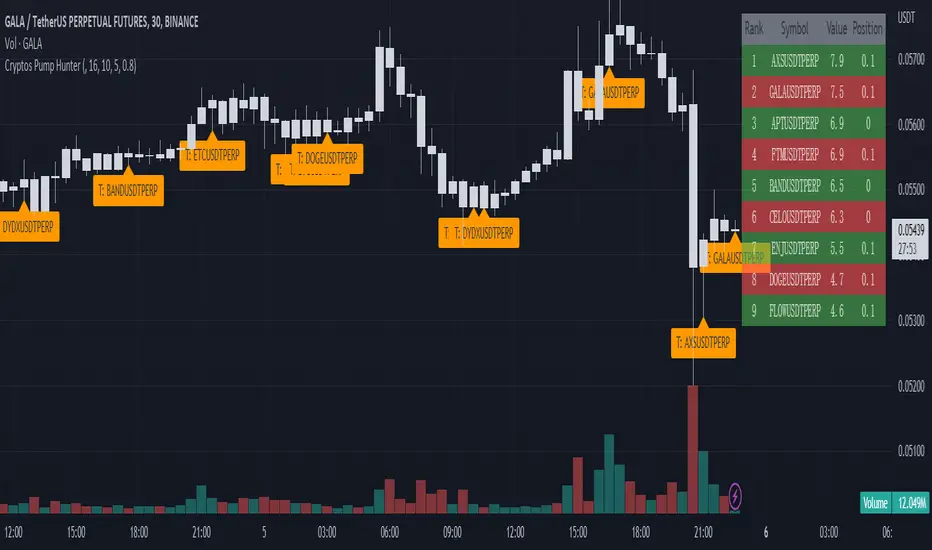
Cryptos Pump Hunter[liwei666]🔥 Cryptos Pump Hunter captured high volatility symbols in real-time, Up to 40 symbols can be monitored at same time.
Help you find the most profitable symbol with excellent visualization.
🔥 Indicator Design logic
🎯 The core pump/dump logic is quite simple
1. calc past bars highest and lowest High price, get movement by this formula
" movement = (highest - lowest) / lowest * 100 "
2. order by 'movement' value descending, you will get a volatility List
3. use Table tool display List, The higher the 'movement', the higher the ranking.
🔥 Settings
🎯 2 input properties impact on the results, 2 input impact on display effects, others look picture below.
pump_bars_cnt : lookback bar to calc pump/dump
resolution for pump : 1min to 1D
show_top1 : when ranking list top1 change, will draw a label
show pump : when symbol over threhold, draw a pump lable
🔥 How TO USE
🎯 only trade high volatility symbols
1. focus on top1 symbol on Table panel at top-right postion, trading symbols at label in chart.
2. Short when 'postion' ~ 0, Long when 'postion' ~ 1 on Table Cell
🎯 Monitor the symbols you like
1. 100+ symbols added in script, cancel remarks in code line if symbol is your want
2. add 1 line code if symbol not exist. if you want monitor 'ETHUSDTPERP ', then add
" ETHUSDTPERP = create_symbol_obj('BINANCE:ETHUSDTPERP'), array.unshift(symbol_a, ETHUSDTPERP ) "
🎯 Alert will be add soon, any questions or suggestion please comment below, I would appreciate it greatly.
Hope this indicator will be useful for you :)
enjoy! 🚀🚀🚀
Pump and DumpThis indicator picks ups a particular breed of pump and dump. It requires a lot of setup for a chart to pump or dump and it typically involves breaking the parallel channel of current price action. In this case the script is looking for rare moments support and resistance is pushed to its extreme allowing price action to easily setup this move as it ducks through a very strong dynamic support and resistance band. Sensitivity can be adjusted in the settings. For slower charts like weekly or monthly you can push it all the way to extreme. For faster charts like 4hr and hourly slow it down. It's a good idea to tune it to whatever chart and timeframe you are looking at.
LOKEN (v4) BULLISH SMART MONEYThis indicator is based on Smart Money MCDX
(Pine editor @v4)
Indicator built for cryptocurrencies.
Best for day trading.
The coin seems overbought but still pump? Check this indicator
This indicator help you see when institutional buyer enter/exit trade and is a good combination with RSI + Stochastic RSI .
This indicator focus on buying activity by big players and is built for LONG or SPOT, shorter can still use it to determine when to exit short (if smart money appear on a significant TF you may not enter/stay in a short).
Banker plot show strong buyer activities (appear generally when RSI already overbought but still increasing).
It appear as a Histogram with a color code to better see the fading strength of the institutional activity :
Light Blue Bar = Institutional presence ( bullish )
Green Bar = Pump candle (very bullish ), (Banker > Banker MA)
Orange Bar = Retest candle = natural decline after a growth (Banker < Banker MA)
Black Bar = Down candle = progressive exit of institutional leads to this candle, you must have TP before.
Red Bar = Dump candle = steep decline, the institutional take profit hard. You better be out before that one.
Hot-Money plot show momentum and react fast to price action.
It appear as a filled zone (red or green) depending on the plot position compared to its average.
In a downtrend you may only see this one.
Key-Signals:
"Bullish signal 𓃓" = open a long
"Sell signal 💲" = close the long
I recommend you don't keep all the signals enabled at first.
(feel free to ask me the use of the other signals)
It seemed to me that SMART MONEY MCDX was counter-intuitive and archaic,
So i made this one for personal use,
I'm happy if this indicator helps you,
Have a good trade

MESA Stochastic Multi LengthJohn Ehler's MESA Stochastic uses super smoothing to give solid signals. This indicator uses the same rules as every other Stochastic indicator so it would be worth looking into if you are not already familiar with reading a Stochastic. There are 4 different lengths displayed to give traders an edge on reading the market. This is a great tool to analyze waves and find tops and bottoms. It gives great pump and dump signals and even helps filter out bad trades when used with other indicators such as Boom Hunter.
Below are some examples of signals to look out for:
oo

Tesla CoilThis indicator reads the charts as frequency because the charts are just waves after all. This is an excellent tool for finding "Booms" and detecting dumps. Booms are found when all the frequencies pull under the red 20 line. Dumps are detected when all the lines drag themselves along the 20 line as seen is screenshots below.
Below is another 2 examples of a "boom". Everything sucks in before exploding out.
Below is an example of a dump:

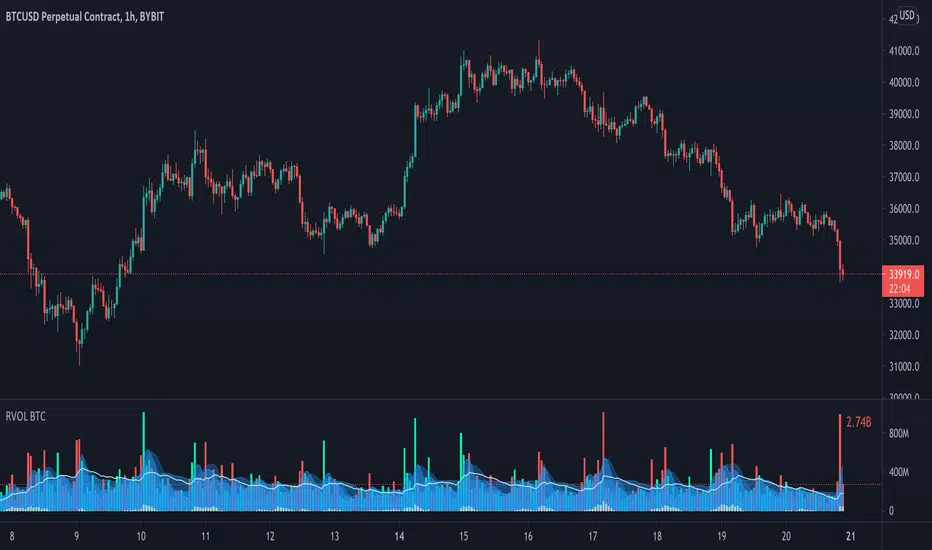
Relative Volume - BITCOINRelative Volume indicator that pulls data from 9 different Bitcoin exchanges. Please note that this indicator only works with BTC and will not use data from your current chart.
Includes the following exchanges:
BYBIT:BTCUSD
BITFINEX:BTCUSD
BITSTAMP:BTCUSD
INDEX:BTCUSD
COINBASE:BTCUSD
FTX:BTCUSD
PHEMEX:BTCUSD
BITTREX:BTCUSD
POLONIEX:BTCUSDT
Relative VolumeVolume can be a very useful tool if used correctly. Relative volume is designed to filter out the noise and highlight anomalies assisting traders in tracking institutional movements. This tool can be used to identify stop loss hunters and organized dumps. It uses a variety of moving averages to hide usual activity and features an LSMA line to show trend. Trend columns are shown to highlight activity and can be seen at bottom of the volume columns, this is done using ZLSMA and LSMA.
The above chart shows an example of 2 indicators being used on the 15 min chart. The bottom indicator is set to the 1 min chart. Traders can see a large dump on the 1 min chart as institutions wipe out any tight stop losses. Next they buy back in scooping up all those long positions.
This is an example layout using a split screen setup and multiple timeframes ranging from 1 min to 30 mins. This gives a clear indication of trends and make it easy to pickup on institutional behaviour. Tip: Double clicking indicator background will maximize RVOL to the split screen window.

Volatility - Sacred GeometryThis indicator is designed to pick up changes in volatility before it happens. It also shows current volatility, as price action drops the blue lines contract. The script uses the blue lines to locate spikes in volatility.
Example of dump revealing itself with plenty of notice.
Here large changes in price action are shown when the white lines spike. Traders can get a heads up on any pump or dump a few candles before it happens.
This example shows a low volatility channel vs high volatility channel. The blue lines expand as price range increases.
Trends can be discovered by studying the patterns.
* This indicator does not use sacred geometry, I just called it that because it looks like it. *
If anyone is interested in developing this indicator any further please get in contact.

Volume Pump WaveThis indicator displays volume as a pump wave. Can be useful for chart analysis and easy detection of anomalies/trends.

Boom HunterEvery "boom" begins with a pullback... This indicator will help traders find bottoms and perfect entries into a pump. It combines two indicators, Dr. John Ehlers Early Onset Trend (EOT) and the infamous Stochastic RSI. The indicator features a built in dump and dip detector which usually picks up signals a few candles before it happens. The blue wave (EOT) shows trend, when waves travel up so does the price. Likewise for the opposite. Low points are revealed when EOT bottoms out and flat lines. Traders can then use the Stochastic RSI crossover to enter a trade. As the EOT lines get closer together there is more movement in price action, so as they get wider traders can expect sideways action. This indicator works on all timeframes but has had excellent results on hourly chart.
Entry zones are marked with a green dot at top of indicator. This signals a bottom is being formed and traders should look for an entry.
Exit points are marked with a red dot at top of indicator. This signals a peak and great time to exit.
Dips and dumps are indicated in red at bottom of indicator.

Dump Detector - Hull Moving AverageDump Detecter uses HMA (Hull Moving Average) to detect dumps/downtrends. Can be used as an exit trigger for long bots or an entry trigger for short bots. Pump signals can be turned on with tickbox.

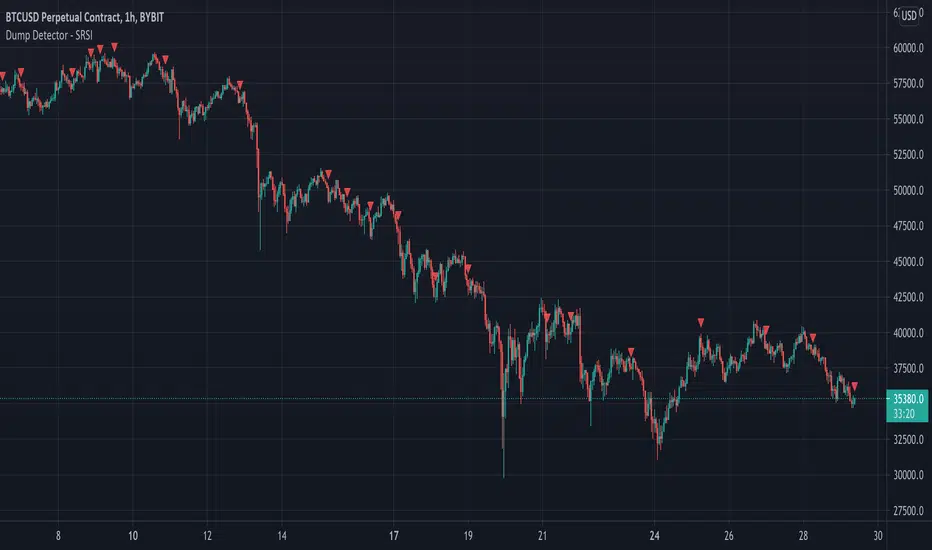
Dump Detector - Stochastic RSIDump Detecter uses Stochastic RSI to detect dumps/downtrends. Can be used as an exit trigger for long bots or an entry trigger for short bots. Change settings to lower timeframe for scalping. Pump signals can be turned on with tickbox.
Default Settings are not the usual Stochastic RSI setup and have been tuned to bitcoin 3hr chart:
Timeframe = 3hrs
smoothK = 3
smoothD = 3
lengthRSI = 6
lengthStoch = 27
src = close
Fibodex TrapFibodex Trap indicator
this indicator designed by the Fibodex team
you will receive dump and bump singles buy using this indicator
also, you will receive buy and sell signals
indeed by using our indicator you won't need many technical analyses
The accuracy of the indicator with the correct settings is estimated to be more than 70%
also, we are trying to improve it to make it more accurate
notice that this indicator should be used as a secondary tool
By using this indicator, you also accept the risk of using it.
--------------------------------------------------------------------------------------------------------------------------------------------------------------------------------------------------------------------------------------------------------------------------------------------------------
اندیکاتور تله توسط مجموعه فیبودکس ایده پردازی و کد نویسی شده است.
شما با این اندیکاتور قادر خواهید بود تا سیگنال های پامپ و دامپ و همچنین خرید و فروش را دریافت نمایید.
دقت اندیکاتور با تنظیمات صحیح بیش از 70 درصد تخمین زده شده است که مجموعه فیبودکس در جهت بهبود و افزایش دقت آن تلاش خواهد کرد.
به یاد داشته باشید که از این اندیکاتور به عنوان کمکی و دریافت تاییده کمک بگیرید .
شما با استفاده از این اندیکاتور ریسک استفاده از آن را هم می پذیرید

L1 Buy after Dump DetectorLevel: 1
Background
The so-called "Buy after Dump" refers to the phenomenon in which the stock price sometimes rebounds temporarily due to the rapid decline in the falling market. The rebound was smaller than the decline, and the downtrend resumed after the rebound.
Function
L1 Buy after Dump Detector is one of my research to see win rate of a "Buy after Dump" chance. The principle is that I use ema() and OHLC to model a whale dump behavior. After the dump wave, I use KDJ to indicate several long entry points.
Key Signal
dump --> whale dump signal
fundready --> it indicate the end of a dump and make fund ready to long entry
longentry --> long entry signal generated from KDJ resonating with dump and fundready signal
Pros and Cons
Pros:
1. it can detect obvious dump and depict the decay of dump wave
2. use resonance to generate long entry
Cons:
1. it may be risky to "buy after dump" which may require take profit method here because the opportunity may be very short
2. KDJ is too sensitive in large time frame and have many long entry signals (the closer to dump wave, the better based on experience)
Remarks
Very interesing stuff, but rare of people trade with such crazy method. I suggest this is ONLY for backtest study of market behavior.
Readme
In real life, I am a prolific inventor. I have successfully applied for more than 60 international and regional patents in the past 12 years. But in the past two years or so, I have tried to transfer my creativity to the development of trading strategies. Tradingview is the ideal platform for me. I am selecting and contributing some of the hundreds of scripts to publish in Tradingview community. Welcome everyone to interact with me to discuss these interesting pine scripts.
The scripts posted are categorized into 5 levels according to my efforts or manhours put into these works.
Level 1 : interesting script snippets or distinctive improvement from classic indicators or strategy. Level 1 scripts can usually appear in more complex indicators as a function module or element.
Level 2 : composite indicator/strategy. By selecting or combining several independent or dependent functions or sub indicators in proper way, the composite script exhibits a resonance phenomenon which can filter out noise or fake trading signal to enhance trading confidence level.
Level 3 : comprehensive indicator/strategy. They are simple trading systems based on my strategies. They are commonly containing several or all of entry signal, close signal, stop loss, take profit, re-entry, risk management, and position sizing techniques. Even some interesting fundamental and mass psychological aspects are incorporated.
Level 4 : script snippets or functions that do not disclose source code. Interesting element that can reveal market laws and work as raw material for indicators and strategies. If you find Level 1~2 scripts are helpful, Level 4 is a private version that took me far more efforts to develop.
Level 5 : indicator/strategy that do not disclose source code. private version of Level 3 script with my accumulated script processing skills or a large number of custom functions. I had a private function library built in past two years. Level 5 scripts use many of them to achieve private trading strategy.

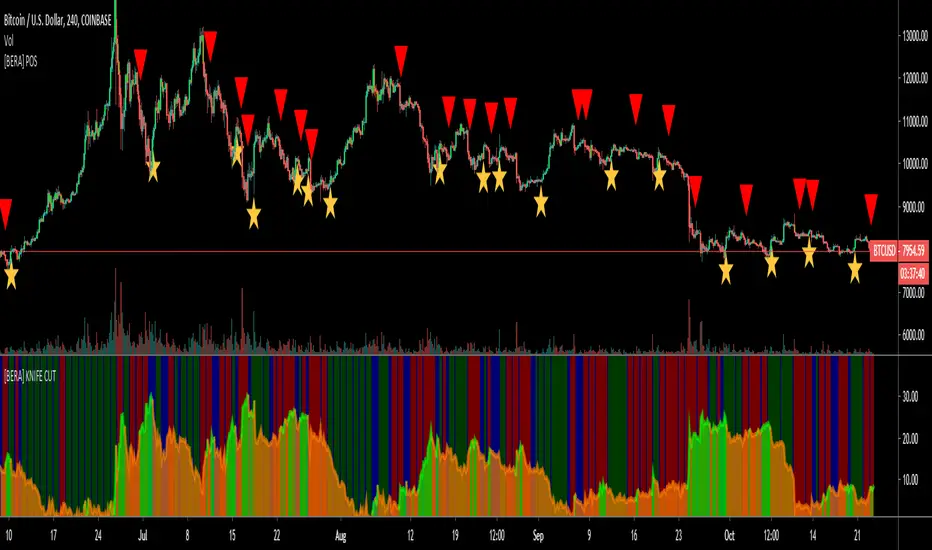
[BERA] PILE OF SIGNALSHey bulas and beras, another indicator for help your decision.
Ok lets start.
PILE OF SIGNAL, i admit the last word of the title was a bad word and changed to avoid permaban ok lol ahah.
Description= this indicator use moving averages crosses and volume as decision point, what mean this? simple when a move is coming this indicator will show you the probable "direction" of next move. these signals are not buy and sell, also because multiple signals can occour, you should use it with you own TA.
-Moving Averages
-Crosses
-Volume
RED ARROW ABOVE BAR= PROBABILITY OF DOWN MOVE INCOMING
STARS BELOW BAR= PROBABILITY OF UP MOVE INCOMING
Simple.
TipTopTraders - #1 Swing Trader Inidicator - 1H+ guaranteed $$$$The specifics of this script are quite simple. Using comparisons of BTC, DXY, and Gold indexes, the MA changes color in the direction of the trend in such a way that you get near-perfect entries and exits.
I've used this new script of mine for the last few months to clock in huge profits in the pump to 12K and the dump down to $9K - refer to chart:
This indicator makes trading so easy, you barely need other confirmations to trade off of it. The higher the time frame the better, but anything below 1 Hour charts can get a bit hairy, in which I would recommend using other contribution indicators for confirmations of trends.
If you want access to this script and everything else currently in development, then please do not hesitate to ask about pricing and membership via a PM.
Thanks!!!!!!!!

Pump|Dump Tickerthis is just a study to investigate the pumps and dumps that have been happened in a crypto market and it should not be used as an indicator. this is also my very first Pine Script that I've written and I am sure it is not perfect. actually I am curious to know when (I mean the exact time of the day) most pumps and dumps happen as a self investigation. the method that is used to define pumps and dumps is not good (and I know that) but I will modify it for better result in next version.
to use this study, you should define whether you want to display pumps or dumps or both and also you should define percent of change (threshold).

Pump, Dump and Accumulation Tracker (VIP User)ThunderTrader : ThunderLight
ThunderLight is indicator to track or calculate hidden consolidation or accumulation where the whales prepare for next pump
ThunderTrader : ThunderRainbow
ThunderLight is indicator to track or calculate hidden demand, supply and accumulation where the whales prepare for next pump or next dump
Time Frame Rules:
It works for any timeframes below 1W, but some times it will not work for new listing until sufficient data are appeared
TF 30m is very good for entry plan
TF 1H is very good daily tracking
TF 4H is very good for weekly tracking
Disclaimer:
The high demand or high accumulation signal will not immediately trigger the pump. It can take some times, usually TF 1H will trigger the action from 8 to 24 hours.
The high demand or high accumulation signal is not always pump identification but also mini rally or uptrend
The high supply is not alway high dump or end of trend, if it's followed by supply it can continue to pump rally
Alert System:
You can integrate ThunderRainbow or ThunderLight to your Alert System, so that you will not miss the pump by the whales
This is for VIP membership, if you want trial version, please visit:

