Expanded Cloud [LuxAlgo]The Expanded Cloud tool allows traders to identify and follow trends accurately. It is based on the well-known Donchian Channels, but with enhanced features.
It features a trailing cloud that expands with the price and a trading stats dashboard.
🔶 USAGE
The tool is super easy to use. Traders can identify bigger or smaller trends just by adjusting the length from the settings panel.
Trend identification is based on Donchian Channels. An uptrend is indicated when the cloud is located below the price, while a downtrend is indicated when the cloud is above it.
Dots signal the start of a new trend, and the width of the clouds identifies the strength of the price expansion. The wider the cloud, the bigger the move.
The expanded cloud, due to its visual, can also act as a trailing stop.
🔹 Trend Identification
As we can see in the chart above, different length values identify different trends on the same BTC daily chart. Larger values identify larger trends.
🔹 Cloud Expansion
From the settings panel, traders can adjust how the clouds expand based on the Expansion % parameter. It accepts values from 0 to 100, which controls how much of the expansion is taken into account. Higher values will make the cloud expand and get closer to the price faster.
When the cloud moves opposite to the direction of the indicated trend (e.g: the cloud decreases while being below the price), it is often indicative of the end of a retracement, and we can expect the price to move with the indicated trend.
The chart above shows the effect of different Expansion % values.
🔹 Dashboard
The trading statistics dashboard informs traders of key metrics derived from the tool. The following are notable:
PNL: Theoretical profit or loss from all trends identified by the tool in the right scale units.
EXPECT.: Expected value of each trade. It is derived from win rate and risk-to-reward metrics.
AVG: 1st TOUCH: The average number of bars from the beginning of a new trend until the price touches the cloud for the first time.
🔶 SETTINGS
Length: Length for trend detection
Expansion %: Percentage of price expansion for cloud formation
Source: Source of the data
🔹 Dashboard
Show Dashboard: Enable/disable the statistics dashboard
Location: Dashboard location
Size: Dashboard size
Donchianchannel

HiLo EMA Custom bandsHILo Ema custom bands
This advanced technical indicator is a powerful variation of "HiLo Ema squeeze bands" that combines the best elements of Donchian channels and EMAs. It's specially designed to identify price squeezes before significant market moves while providing dynamic support/resistance levels and predictive price targets.
Indicator Concept:
The indicator initializes EMAs at each new high or low - the upper EMA tracks highs while the lower EMA tracks lows. It draws maximum of 6 custom bands based on percentage, fixed value or Atr
Upper EM bands are drawn below uper ema, Lower EMA bands are drawn above lower ema
Customizable Options:
Ema length: 200 default
Calculation type: Ema (Default), HILO
Calculation type: Percent,Fixed Value, ATR
Band Value: Percent/Value/ATR multiple This is value to use for calculation type
Band Selection: Both,Upper,Lower
Key Features:
You can choose to draw either of one or both, the latter can be overwhelming initially but as you get used to it, it becomes a powerful tool.
When both bands are selected, upper and lower bands provide provides dual references and intersections
This creates a more trend-responsive alternative to traditional Donchian channels with clearly defined zones for trade planning.
If you select percaentage, note that the calulation is based FROM the respective EMA bands. So bands from lower EMA band will appear narrower compared to the those drawn from upper EMA band
Price targets or reversals:
Look of alignment of lines and price. The current level of one order could align with that of previous level of a different order because often markets move in steps
Settings Guide:
Recommended Settings:
Ema length: 200
Use one of the bands (not both) if using large length of say 1000
Calculation type: EMA
HILO will draw donchian like bands, this is useful if you only want flat price levels. In a rising market use upper and vise versa
Calculation type:
percentage for indices : 5, for symbols 10 or higher based on symbol volatility
Fixed value: about 10% of symbol value converted to value
Atr: 2 ideally
Perfect for swing traders and position traders looking for a more sophisticated volatility-based overlay that adapts to changing market conditions and provides predictive reversal levels.
Note: This indicator works well across multiple timeframes but is especially effective on H4, Daily and Weekly charts for trend trading.

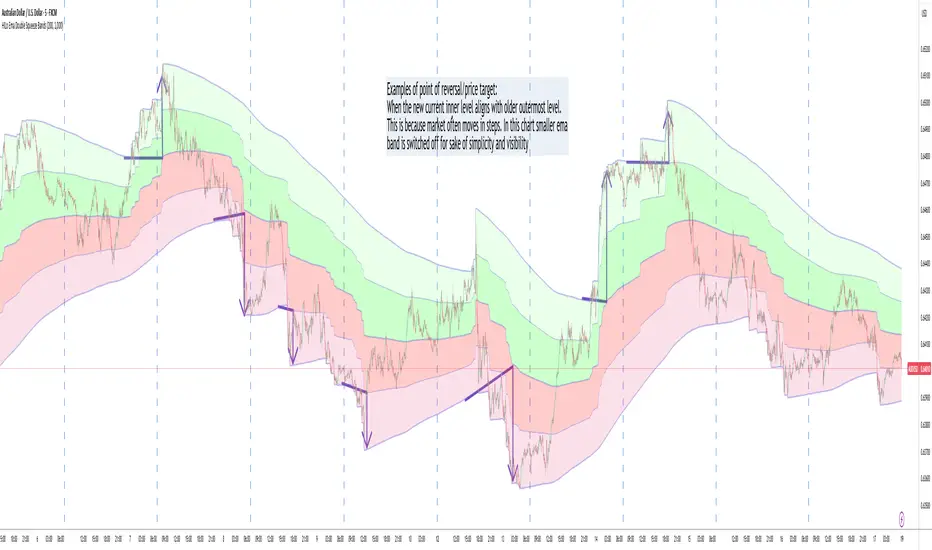
HILo Ema Double Squeeze BandsHILo Ema Double Squeeze Bands
This advanced technical indicator is a powerful variation of "HiLo Ema squeeze bands" that combines the best elements of Donchian channels and EMAs. It's specially designed to identify price squeezes before significant market moves while providing dynamic support/resistance levels and predictive price targets.
Indicator Concept:
The indicator initializes EMAs at each new high or low - the upper EMA tracks highs while the lower EMA tracks lows. The price range between upper and lower bands is divided into 4 equal zones by these lines:
Upper2 (uppermost line)
Upper1 (upper quartile)
Middle (center line)
Lower1 (lower quartile)
Lower2 (lowermost line)
This creates a more trend-responsive alternative to traditional Donchian channels with clearly defined zones for trade planning.
Key Features:
Dual EMA Band System: Utilizes both short-term and long-term EMAs to create adaptive price channels that respond to different market cycles
Quartile Divisions: Each band set includes middle lines and quartile divisions for more precise entry and exit points
Customizable Parameters: Easily adjust EMA periods and display options to suit your trading style and timeframe
Visual Color Zones: Clear color-coded zones help quickly identify bullish and bearish areas
Optional Extra Divisions: Add more granular internal lines (eighth divisions) for enhanced precision with longer EMA periods
Price Labels Option: Display exact price values for key levels directly on the chart
Price Target Prediction:
One of the most valuable features of this indicator is its ability to help predict potential reversal points:
When price breaks above the Upper2 level, look for potential reversals when the new Upper1 or Middle line aligns with previous Upper2 levels
When price breaks below the Lower2 level, look for potential reversals when the new Lower1 or Middle line aligns with previous Lower2 levels
Settings Guide:
Recommended Settings: 200 for Short EMA, 1000 for Long EMA works extremely well across most timeframes and symbols
Display options allow you to show/hide either band system based on your analysis preferences
The new option to divide the long EMA range into 8 parts instead of 4 is particularly useful when:
Long EMA period is >500
Short EMA is switched off and long EMA is used independently
Perfect for swing traders and position traders looking for a more sophisticated volatility-based overlay that adapts to changing market conditions and provides predictive reversal levels.
Note: This indicator works well across multiple timeframes but is especially effective on H4, Daily and Weekly charts for trend trading.
RSI-EMA-Crossing with Donchian-Stop-LossThe Donchian RSI Indicator is a visual tool that combines momentum and trend analysis to identify high-quality long opportunities based on RSI crossovers, price action, and Donchian channel dynamics.
How It Works
Momentum Signal: A bullish RSI crossover is detected when the RSI crosses above its moving average.
Trend Filter: A signal is only valid if the crossover occurs while the price is above its moving average – filtering out entries against the prevailing trend.
Signal Candle: The high of the crossover candle is stored.
Entry Trigger: A valid signal occurs when a later candle closes above that signal high.
Stop-Loss (Visual Only)
The lower band of the Donchian Channel acts as a visual reference for a dynamic stop-loss level.
Features
Customizable RSI, Donchian Channel, and moving average lengths
Selectable MA types: SMA, EMA, WMA, VWMA, HMA
Signal candle highlighted (yellow background)
Entry points labeled on the chart
Price MA and Donchian Channel plotted
Trend filter improves signal quality by confirming upward bias
Use Case
Designed for swing and position traders
Optimized for use on daily or 4H charts

Donchian Breakout Strategy📈 Donchian Breakout Strategy (Inspired by Way of the Turtle)
This strategy is a modern adaptation of the legendary Turtle Trading system as taught in Way of the Turtle by Curtis Faith — re-engineered for the crypto market’s volatility, 24/7 nature, and frequent fakeouts.
⸻
🐢 Original Inspiration
The original Turtle system, created by Richard Dennis and William Eckhardt, used:
• Breakouts of Donchian Channels (20-day for entry, 10-day for exit)
• Volatility-based position sizing using ATR (N)
• Simple rules, big trend exposure, and pyramiding to grow winners
It was built for futures and commodities, trading daily bars, assuming stable trading hours and regulated markets.
⸻
🚀 What’s Different in This Strategy?
✅ Optimized for Crypto
• Adapts to constant volatility and price manipulation common in crypto
• Adds commission modeling for realistic results (0.045% default)
✅ Improved Entry Filtering
• Uses EMA filter to align with trend direction
• Adds RSI momentum check to avoid early or weak breakouts
• Optional volatility and volume filters to reduce false signals
✅ Smarter Exits
• ATR-based volatility stop loss, not just Donchian reversal
• Avoids pyramiding to reduce risk from sudden reversals
✅ Backtest-Friendly
• Default backtest window starts from 2025-01-01
• Fully configurable: long/short toggle, filter control, stop loss multiplier
⸻
🧪 Use Case
• Best on trending coins with strong directional moves
• Avoids chop via filters, preserving capital
• Can be tuned for aggressive or conservative setups with just a few tweaks

POC-Candle-EMA-ATR-LongShadow-50percCandleThis is a script for those who trade based on volume and smart money strategies.
Some of the features of this script:
- Display "Time Price Opportunity Chart". These points help traders to identify price opportunities over time and have a better analysis of the market.
- Mark candles that have traded more volume than previous candles.
- Mark candles whose body is at least and not more than 50% of the total candle size, these candles can be found more easily in smart money strategies.
- Mark spike candles to find FVG faster
- Mark candles that have a shadow of at least more than 380 points and can be good reversal points.
- EMA indicator to check the market trend
- DonchianChannel indicator to check the price trend on the chart
Regards

Breakaway Fair Value Gaps [LuxAlgo]The Breakaway Fair Value Gap (FVG) is a typical FVG located at a point where the price is breaking new Highs or Lows.
🔶 USAGE
In the screenshot above, the price range is visualized by Donchian Channels.
In theory, the Breakaway FVGs should generally be a good indication of market participation, showing favor in the FVG's breaking direction. This is a combination of buyers or sellers pushing markets quickly while already at the highest high or lowest low in recent history.
While this described reasoning seems conventional, looking into it inversely seems to reveal a more effective use of these formations.
When the price is pushed to the extremities of the current range, the price is already potentially off balance and over-extended. Then an FVG is created, extending the price further out of balance.
With this in consideration, After identifying a Breakaway FVG, we could logically look for a reversion to re-balance the gap.
However, it would be illogical to believe that the FVG will immediately mitigate after formation. Because of this, the dashboard display for this indicator shows the analysis for the mitigation likelihood and timeliness.
In the example above, the information in the dashboard would read as follows (Bearish example):
Out of 949 Bearish Breakaway FVGs, 80.19% are shown to be mitigated within 60 bars, with the average mitigation time being 13 bars.
The other 19.81% are not mitigated within 60 bars. This could mean the FVG was mitigated after 60 bars, or it was never mitigated.
The unmitigated FVGs within the analysis window will extend their mitigation level to the current bar. We can see the number of bars since the formation is represented to the right of the live mitigation level.
Utilizing the current distance readout helps to better judge the likelihood of a level being mitigated.
Additionally, when considering these mitigation levels as targets, an additional indicator or analysis can be used to identify specific entries, which would further aid in a system's reliability.
🔶 SETTINGS
Trend Length: Sets the (DC) Trend length to use for Identifying Breakaway FVGs.
Show Mitigation Levels: Optionally hide mitigation levels if you would prefer only to see the Breakaway FVGs.
Maximum Duration: Sets the analysis duration for FVGs, Past this length in bars, the FVG is counted as "Un-Mitigated".
Show Dashboard: Optionally hide the dashboard.
Use Median Duration: Display the Median of the Bar Length data set rather than the Average.

Curved Price Channels (Zeiierman)█ Overview
The Curved Price Channels (Zeiierman) is designed to plot dynamic channels around price movements, much like the traditional Donchian Channels, but with a key difference: the channels are curved instead of straight. This curvature allows the channels to adapt more fluidly to price action, providing a smoother representation of the highest high and lowest low levels.
Just like Donchian Channels, the Curved Price Channels help identify potential breakout points and areas of trend reversal. However, the curvature offers a more refined approach to visualizing price boundaries, making it potentially more effective in capturing price trends and reversals in markets that exhibit significant volatility or price swings.
The included trend strength calculation further enhances the indicator by offering insight into the strength of the current trend.
█ How It Works
The Curved Price Channels are calculated based on the asset's average true range (ATR), scaled by the chosen length and multiplier settings. This adaptive size allows the channels to expand and contract based on recent market volatility. The central trendline is calculated as the average of the upper and lower curved bands, providing a smoothed representation of the overall price trend.
Key Calculations:
Adaptive Size: The ATR is used to dynamically adjust the width of the channels, making them responsive to changes in market volatility.
Upper and Lower Bands: The upper band is calculated by taking the maximum close value and adjusting it downward by a factor proportional to the ATR and the multiplier. Similarly, the lower band is calculated by adjusting the minimum close value upward.
Trendline: The trendline is the average of the upper and lower bands, representing the central tendency of the price action.
Trend Strength
The Trend Strength feature in the Curved Price Channels is a powerful feature designed to help traders gauge the strength of the current trend. It calculates the strength of a trend by analyzing the relationship between the price's position within the curved channels and the overall range of the channels themselves.
Range Calculation:
The indicator first determines the distance between the upper and lower curved channels, known as the range. This range represents the overall volatility of the price within the given period.
Range = Upper Band - Lower Band
Relative Position:
The next step involves calculating the relative position of the closing price within this range. This value indicates where the current price sits in relation to the overall range.
RelativePosition = (Close - Trendline) / Range
Normalization:
To assess the trend strength over time, the current range is normalized against the maximum and minimum ranges observed over a specified look-back period.
NormalizedRange = (Range - Min Range) / (Max Range - Min Range)
Trend Strength Calculation:
The final Trend Strength is calculated by multiplying the relative position by the normalized range and then scaling it to a percentage.
TrendStrength = Relative Position * Normalized Range * 100
This approach ensures that the Trend Strength not only reflects the direction of the trend but also its intensity, providing a more comprehensive view of market conditions.
█ Comparison with Donchian Channels
Curved Price Channels offer several advantages over Donchian Channels, particularly in their ability to adapt to changing market conditions.
⚪ Adaptability vs. Fixed Structure
Donchian Channels: Use a fixed period to plot straight lines based on the highest high and lowest low. This can be limiting because the channels do not adjust to volatility; they remain the same width regardless of how much or how little the price is moving.
Curved Price Channels: Adapt dynamically to market conditions using the Average True Range (ATR) as a measure of volatility. The channels expand and contract based on recent price movements, providing a more accurate reflection of the market's current state. This adaptability allows traders to capture both large trends and smaller fluctuations more effectively.
⚪ Sensitivity to Market Movements
Donchian Channels: Are less sensitive to recent price action because they rely on a fixed look-back period. This can result in late signals during fast-moving markets, as the channels may not adjust quickly enough to capture new trends.
Curved Price Channels: Respond more quickly to changes in market volatility, making them more sensitive to recent price action. The multiplier setting further allows traders to adjust the channel's sensitivity, making it possible to capture smaller price movements during periods of low volatility or filter out noise during high volatility.
⚪ Enhanced Trend Strength Analysis
Donchian Channels: Do not provide direct insight into the strength of a trend. Traders must rely on additional indicators or their judgment to gauge whether a trend is strong or weak.
Curved Price Channels: Includes a built-in trend strength calculation that takes into account the distance between the upper and lower channels relative to the trendline. A broader range between the channels typically indicates a stronger trend, while a narrower range suggests a weaker trend. This feature helps traders not only identify the direction of the trend but also assess its potential longevity and strength.
⚪ Dynamic Support and Resistance
Donchian Channels: Offer static support and resistance levels that may not accurately reflect changing market dynamics. These levels can quickly become outdated in volatile markets.
Curved Price Channels: Offer dynamic support and resistance levels that adjust in real-time, providing more relevant and actionable trading signals. As the channels curve to reflect price movements, they can help identify areas where the price is likely to encounter support or resistance, making them more useful in volatile or trending markets.
█ How to Use
Traders can use the Curved Price Channels in similar ways to Donchian Channels but with the added benefits of the adaptive, curved structure:
Breakout Identification:
Just like Donchian Channels, when the price breaks above the upper curved band, it may signal the start of a bullish trend, while a break below the lower curved band could indicate a bearish trend. The curved nature of the channels helps in capturing these breakouts more precisely by adjusting to recent volatility.
Volatility:
The width of the price channels in the Curved Price Channels indicator serves as a clear indicator of current market volatility. A wider channel indicates that the market is experiencing higher volatility, as prices are fluctuating more dramatically within the period. Conversely, a narrower channel suggests that the market is in a lower volatility state, with price movements being more subdued.
Typically, higher volatility is observed during negative trends, where market uncertainty or fear drives larger price swings. In contrast, lower volatility is often associated with positive trends, where prices tend to move more steadily and predictably. The adaptive nature of the Curved Price Channels reflects these volatility conditions in real time, allowing traders to assess the market environment quickly and adjust their strategies accordingly.
Support and Resistance:
The trend line act as dynamic support and resistance levels. Due to it's adaptive nature, this level is more reflective of the current market environment than the fixed level of Donchian Channels.
Trend Direction and Strength:
The trend direction and strength are highlighted by the trendline and the directional candle within the Curved Price Channels indicator. If the price is above the trendline, it indicates a positive trend, while a price below the trendline signals a negative trend. This directional bias is visually represented by the color of the directional candle, making it easy for traders to quickly identify the current market trend.
In addition to the trendline, the indicator also displays Max and Min values. These represent the highest and lowest trend strength values within the lookback period, providing a reference point for understanding the current trend strength relative to historical levels.
Max Value: Indicates the highest recorded trend strength during the lookback period. If the Max value is greater than the Min value, it suggests that the market has generally experienced more positive (bullish) conditions during this time frame.
Min Value: Represents the lowest recorded trend strength within the same period. If the Min value is greater than the Max value, it indicates that the market has been predominantly negative (bearish) over the lookback period.
By assessing these Max and Min values, traders gain an immediate understanding of the underlying trend. If the current trend strength is close to the Max value, it indicates a strong bullish trend. Conversely, if the trend strength is near the Min value, it suggests a strong bearish trend.
█ Settings
Trend Length: Defines the number of bars used to calculate the core trendline and adaptive size. A length of 200 will create a smooth, long-term trendline that reacts slowly to price changes, while a length of 20 will create a more responsive trendline that tracks short-term movements.
Multiplier: Adjusts the width of the curved price channels. A higher value tightens the channels, making them more sensitive to price movements, while a lower value widens the channels. A multiplier of 10 will create tighter channels that are more sensitive to minor price fluctuations, which is useful in low-volatility markets. A multiplier of 2 will create wider channels that capture larger trends and are better suited for high-volatility markets.
Trend Strength Length: Defines the period over which the maximum and minimum ranges are calculated to normalize the trend strength. A length of 200 will smooth out the trend strength readings, providing a stable indication of trend health, whereas a length of 50 will make the readings more reactive to recent price changes.
-----------------
Disclaimer
The information contained in my Scripts/Indicators/Ideas/Algos/Systems does not constitute financial advice or a solicitation to buy or sell any securities of any type. I will not accept liability for any loss or damage, including without limitation any loss of profit, which may arise directly or indirectly from the use of or reliance on such information.
All investments involve risk, and the past performance of a security, industry, sector, market, financial product, trading strategy, backtest, or individual's trading does not guarantee future results or returns. Investors are fully responsible for any investment decisions they make. Such decisions should be based solely on an evaluation of their financial circumstances, investment objectives, risk tolerance, and liquidity needs.
My Scripts/Indicators/Ideas/Algos/Systems are only for educational purposes!

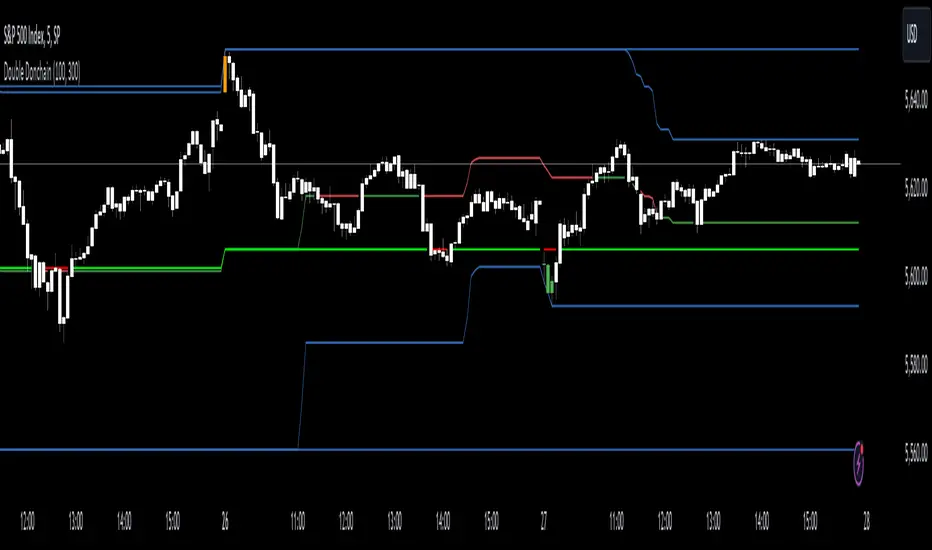
Double Donchian Channels [CrossTrade]Dual Channel System
The indicator incorporates two Donchian Channels - the Inner Channel and the Outer Channel. These channels are adjustable, allowing users to define their lengths according to their trading strategy.
Inner Channel: With a default length of 100 periods, the Inner Channel provides a closer view of market trends and potential support and resistance areas. It includes an upper, lower, and middle line (average of the upper and lower), offering detailed insights into shorter-term price movements.
Outer Channel: Set with a default length of 300 periods, the Outer Channel offers a broader perspective, ideal for identifying long-term trends and stronger levels of support and resistance.
Dynamic Color Coding: The middle lines of both channels change color based on the relationship between the previous close and the channel's basis. This feature provides an immediate visual cue regarding market sentiment.
Touching Bars Highlighting: The indicator highlights bars that touch the upper or lower bands of either channel. This is particularly useful for identifying potential reversals or continuation patterns.
Pullback Identification: By differentiating between bars that touch the Inner Channel only and those that touch the Outer Channel, the indicator helps in identifying pullbacks within a broader trend.
Customizable Alert System: Users can set up alerts for specific conditions - a bar touching the bottom band of the Inner Channel (green), the bottom band of the Outer Channel (blue), the upper band of the Inner Channel (red), and the upper band of the Outer Channel (orange). These alerts assist in timely decision-making and can be tailored to individual trading styles.
The indicator is a versatile tool designed to adapt to various trading styles and timeframes. Its features make it suitable for trend analysis, identifying potential reversal points, and understanding market volatility.
Swing DistanceHello fellas,
This simple indicator helps to visualize the distance between swings. It consists of two lines, the highest and the lowest line, which show the highest and lowest value of the set lookback, respectively. Additionally, it plots labels with the distance (in %) between the highest and the lowest line when there is a change in either the highest or the lowest value.
Use Case:
This tool helps you get a feel for which trades you might want to take and which timeframe you might want to use.
Side Note: This indicator is not intended to be used as a signal emitter or filter!
Best regards,
simwai

Donchian Trend Ranges [AlgoAlpha]🚀🔗 Donchian Trend Ranges 🔗🚀
Elevate your trading game with the Donchian Trend Ranges indicator from AlgoAlpha! 🌟📈 This advanced tool helps you visualize market trends and potential reversal points using Donchian channels, volatility measures, and average true range (ATR).
Key Features
⚙️ Customizable Parameters: Adjust the lookback period and range multiplier to fit your trading style.
🎨 Color-Coded Trends: Easily distinguish between uptrends and downtrends with customizable colors.
📊 Dynamic Channels: Visualize multiple dynamic channels based on Donchian ranges and volatility.
☁️ Trend Clouds: See market strength and weakness with upper and lower trend clouds.
🔔 Signal Alerts: Get notified of potential trend shifts and take profit points.
How to Use
🛠 Add the Indicator: Add the indicator to favorites. Customize settings such as the lookback period and range multiplier to match your trading needs.
🔍 Analyze Trends: The indicator calculates the highest and lowest prices over a specified period to create dynamic channels. It then uses standard deviation and ATR to adjust these channels for market volatility, plotting upper and lower ranges. Green bars indicate an up trend and red bars for a down trend.
🔔 Set Alerts: Enable notifications for bullish and bearish trend shifts, as well as weak and strong take profit points, ensuring you never miss an opportunity.
How it Works
The Donchian Trend Ranges indicator calculates the highest and lowest prices over a specified period to create a basis line. It creates a range around the basis based on standard deviations and the clouds' width is determined by a 14 period ATR. The basis line and bar colors changes based on whether the closing price is above or below it, indicating trends. Clouds around these lines represent market reversal zones that can be used as entry levels when used in confluence with momentum indicators, visual signals ("X" and "◆") marking strong and weak take profit points are also printed when the prices revert from the clouds towards the basis. Integrated alerts notify you of significant events like trend shifts and take profit signals, keeping you informed without constant monitoring.
Unleash the power of the Donchian Trend Ranges in your trading strategy! 🌐📈✨

Donchian Channels StrengthTL;DR - A different approach calculating strength based on Donchain channels
My approach calculating strength by using the difference between price and donchain average. It is possible to use the highest/lowest value of a given source (like close) or to use the highest high/lowest low (by using the option 'include wicks') for the strength calculation
I added multiple moving averages which can be used in the calculations incl. SMMA (RMA) which is used in RSI calculation and works best for me.
Usage is similar to RSI: DC Strength oscillates between 0 and 100. Low values (<20) indicate a bearish situation while high values (>80) indicate bullish ones. Center line (50) crossings can also indicate a possible trend change.

Donchian Quest Research// =================================
Trend following strategy.
// =================================
Strategy uses two channels. One channel - for opening trades. Second channel - for closing.
Channel is similar to Donchian channel, but uses Close prices (not High/Low). That helps don't react to wicks of volatile candles (“stop hunting”). In most cases openings occur earlier than in Donchian channel. Closings occur only for real breakout.
// =================================
Strategy waits for beginning of trend - when price breakout of channel. Default length of both channels = 50 candles.
Conditions of trading:
- Open Long: If last Close = max Close for 50 closes.
- Close Long: If last Close = min Close for 50 closes.
- Open Short: If last Close = min Close for 50 closes.
- Close Short: If last Close = max Close for 50 closes.
// =================================
Color of lines:
- black - channel for opening trade.
- red - channel for closing trade.
- yellow - entry price.
- fuchsia - stoploss and breakeven.
- vertical green - go Long.
- vertical red - go Short.
- vertical gray - close in end, don't trade anymore.
// =================================
Order size calculated with ATR and volatility.
You can't trade 1 contract in BTC and 1 contract in XRP - for example. They have different price and volatility, so 1 contract BTC not equal 1 contract XRP.
Script uses universal calculation for every market. It is based on:
- Risk - USD sum you ready to loss in one trade. It calculated as percent of Equity.
- ATR indicator - measurement of volatility.
With default setting your stoploss = 0.5 percent of equity:
- If initial capital is 1000 USD and used parameter "Permit stop" - loss will be 5 USD (0.5 % of equity).
- If your Equity rises to 2000 USD and used parameter "Permit stop"- loss will be 10 USD (0.5 % of Equity).
// =================================
This Risk works only if you enable “Permit stop” parameter in Settings.
If this parameter disabled - strategy works as reversal strategy:
⁃ If close Long - channel border works as stoploss and momentarily go Short.
⁃ If close Short - channel border works as stoploss and momentarily go Long.
Channel borders changed dynamically. So sometime your loss will be greater than ‘Risk %’. Sometime - less than ‘Risk %’.
If this parameter enabled - maximum loss always equal to 'Risk %'. This parameter also include breakeven: if profit % = Risk %, then move stoploss to entry price.
// =================================
Like all trend following strategies - it works only in trend conditions. If no trend - slowly bleeding. There is no special additional indicator to filter trend/notrend. You need to trade every signal of strategy.
Strategy gives many losses:
⁃ 30 % of trades will close with profit.
⁃ 70 % of trades will close with loss.
⁃ But profit from 30% will be much greater than loss from 70 %.
Your task - patiently wait for it and don't use risky setting for position sizing.
// =================================
Recommended timeframe - Daily.
// =================================
Trend can vary in lengths. Selecting length of channels determine which trend you will be hunting:
⁃ 20/10 - from several days to several weeks.
⁃ 20/20 or 50/20 - from several weeks to several months.
⁃ 50/50 or 100/50 or 100/100 - from several months to several years.
// =================================
Inputs (Settings):
- Length: length of channel for trade opening/closing. You can choose 20/10, 20/20, 50/20, 50/50, 100/50, 100/100. Default value: 50/50.
- Permit Long / Permit short: Longs are most profitable for this strategy. You can disable Shorts and enable Longs only. Default value: permit all directions.
- Risk % of Equity: for position sizing used Equity percent. Don't use values greater than 5 % - it's risky. Default value: 0.5%.
⁃ ATR multiplier: this multiplier moves stoploss up or down. Big multiplier = small size of order, small profit, stoploss far from entry, low chance of stoploss. Small multiplier = big size of order, big profit, stop near entry, high chance of stoploss. Default value: 2.
- ATR length: number of candles to calculate ATR indicator. It used for order size and stoploss. Default value: 20.
- Close in end - to close active trade in the end (and don't trade anymore) or leave it open. You can see difference in Strategy Tester. Default value: don’t close.
- Permit stop: use stop or go reversal. Default value: without stop, reversal strategy.
// =================================
Properties (Settings):
- Initial capital - 1000 USD.
- Script don't uses 'Order size' - you need to change 'Risk %' in Inputs instead.
- Script don't uses 'Pyramiding'.
- 'Commission' 0.055 % and 'Slippage' 0 - this parameters are for crypto exchanges with perpetual contracts (for example Bybit). If use on other markets - set it accordingly to your exchange parameters.
// =================================
Big dataset used for chart - 'BITCOIN ALL TIME HISTORY INDEX'. It gives enough trades to understand logic of script. It have several good trends.
// =================================

[KVA]Donchian Channel Percentage" The 'Donchian Channel Percentage ' (DC%) indicator, developed for TradingView’s Pine Script Version 5, is a unique tool designed to measure the current price’s position within the Donchian Channel. The Donchian Channel, a popular indicator in technical analysis, is defined by the highest high and the lowest low over a user-specified period.
Key Features :
User-Defined Period: Users can customize the lookback period (default 20 periods), allowing flexibility in different trading styles and timeframes.
Channel Calculation: The upper and lower bounds of the Donchian Channel are calculated based on the highest high and lowest low over the chosen period.
Percentage Calculation: DC% quantifies where the current price lies within the channel, presented as a percentage. A value of 0% indicates the price at the channel's low, and 100% signifies the price at the high.
Visualization: The DC% is plotted as a line graph, providing a clear visual representation of the price’s relative position. The indicator includes horizontal lines at 0% and 100%, marked in red and green, respectively, to depict the channel's boundaries.
Market Analysis Tool: DC% offers insights into market trends and potential overbought or oversold conditions, making it a valuable addition for traders who focus on channel-based strategies.
Applications :
The DC% is particularly useful for identifying breakout scenarios and potential reversals.
Traders can use this tool in conjunction with other indicators to enhance their market analysis, especially in strategies that capitalize on price extremes within a defined range.
In summary, the Donchian Channel Percentage offers traders a simple yet powerful tool to gauge the current price’s position within a historical high-low range. Its adaptability across various assets and timeframes makes it a versatile addition to any technical trader’s toolkit."

Momentum ChannelbandsThe "Momentum Channelbands" is indicator that measures and displays an asset's momentum. It includes options to calculate Bollinger Bands and Donchian Channels around the momentum. Users can customize settings for a comprehensive view of momentum-related insights. This tool helps assess trend strength, identify overbought/oversold conditions, and pinpoint highs/lows. It should be used alongside other indicators due to potential lag and false signals.

Auto-Length Adaptive ChannelsIntroduction
The key innovation of the ALAC is the implementation of dynamic length identification, which allows the indicator to adjust to the "market beat" or dominant cycle in real-time.
The Auto-Length Adaptive Channels (ALAC) is a flexible technical analysis tool that combines the benefits of five different approaches to market band and price deviation calculations.
Traders often tend to overthink of what length their indicators should use, and this is the main idea behind this script. It automatically calculates length based on pivot points, averaging the distance that is in between of current market highs and lows.
This approach is very helpful to identify market deviations, because deviations are always calculated and compared to previous market behavior.
How it works
The indicator uses a Detrended Rhythm Oscillator (DRO) to identify the dominant cycle in the market. This length information is then used to calculate different market bands and price deviations. The ALAC combines five different methodologies to compute these bands:
1 - Bollinger Bands
2 - Keltner Channels
3 - Envelope
4 - Average True Range Channels
5 - Donchian Channels
By averaging these calculations, the ALAC produces an overall market band that generalizes the approaches of these five methods into a single, adaptive channel.
How to Use
When the price is at the upper band, this might suggest that the asset is overbought and may be due for a price correction. Conversely, when the price is at the lower band, the asset may be oversold and due for a price increase.
The space between the bands represents the market's volatility. Wider bands indicate higher volatility, while narrower bands suggest lower volatility.
Indicator Settings
The settings of the ALAC allow for customization to suit different trading strategies:
Use Autolength?: This allows the indicator to automatically adjust the length of the dominant cycle.
Usual Length: If "Use Autolength?" is disabled, this setting allows the user to manually specify the length of the cycle.
Moving Average Type: This selects the type of moving average to be used in the calculations. Options include SMA, EMA, ALMA, DEMA, JMA, KAMA, SMMA, TMA, TSF, VMA, VAMA, VWMA, WMA, and ZLEMA.
Channel Multiplier: This adjusts the distance between the bands.
Channel Multiplier Step: This changes the step size of the channel multiplier. Each next market band will be multiplied by a previous one. You can potentially use values below 1, which will plot bands inside the first, main channel.
Use DPO instead of source data?: This setting uses the DPO for calculations instead of the source data. Basically, this is how you can add or eliminate trend from calculation of an average leg-up / leg-down move.
Fast: This adjusts the fast length of the DPO.
Slow: This adjusts the slow length of the DPO.
Zig-zag Period: This adjusts the period of the zig-zag pattern used in the DPO.
(!) For more information about DPO visit official TradingView description here: link
Also, I want to say thanks to @StockMarketCycles for initial idea of Detrended Rhythm Oscillator (DRO) that I use in this script.
The Adaptive Average Channel is a powerful and versatile indicator that combines the strengths of multiple technical analysis methods.
In summary, with the ALAC, you can:
1 - Dynamically adapt to any asset and price action with automatic calculation of dominant cycle lengths.
2 - Identify potential overbought and oversold conditions with the adaptive market bands.
3 - Customize your analysis with various settings, including moving average type and channel multiplier.
4 - Enhance your trading strategy by using the indicator in conjunction with other forms of analysis.

Bars Above/Below Donchian Channel [ScalpTradr]"Bars Above/Below Donchian Channel" provides a visualization of the Donchian Channel and measures the number of bars above and below the middle line of the channel.
The Donchian Channel is a trading indicator that outlines the highest high and the lowest low over a defined number of periods, in this case set by the variable "length". This indicator script specifically also calculates the 'basis', which is the average of the upper and lower channels of the Donchian Channel.
When the closing price of a bar is above the 'basis', the script increases a counter for "aboveCount" and adds a label on the chart to show how many bars have closed above the 'basis'. This label is green and it's always placed at the high price of the bar. Conversely, when the closing price is below the 'basis', it increases a counter for "belowCount" and adds a red label on the chart to show how many bars have closed below the 'basis'. This label is placed at the lower_channel level.
This script can be useful for traders who use the Donchian Channel as a part of their trading strategy. The number of bars closing above or below the 'basis' can provide insights into the ongoing trend. A higher count of bars closing above the 'basis' can be interpreted as a bullish signal, suggesting an upward trend. Similarly, a higher count of bars closing below the 'basis' can be interpreted as a bearish signal, suggesting a downward trend
I hope you find this indicator useful.
Enjoy.

MyVolatilityBandsLibrary "MyVolatilityBands"
Just a lil' library of volatility bands that I use in some scripts
bollingerbands(src, lkbk, mult, basis)
Bollinger Bands
Parameters:
src (float) : float
lkbk (int) : int
mult (float) : float
basis (float)
Returns: Bollinger Bands
donchianchannels(src, lkbk, band_width)
Donchian Channels
Parameters:
src (float) : float
lkbk (int) : int
band_width (float) : float
Returns: Donchian Channels with an outer band of varying thickness adjusted by the band_width input
doublehalfdonchianchannels(src, lkbk, divisor)
Double Half Donchian Channels
Parameters:
src (float) : float
lkbk (int) : int
divisor (float) : float
Returns: two adjustable bases calculated using Donchian Channels calculation that act as a measure of volatility

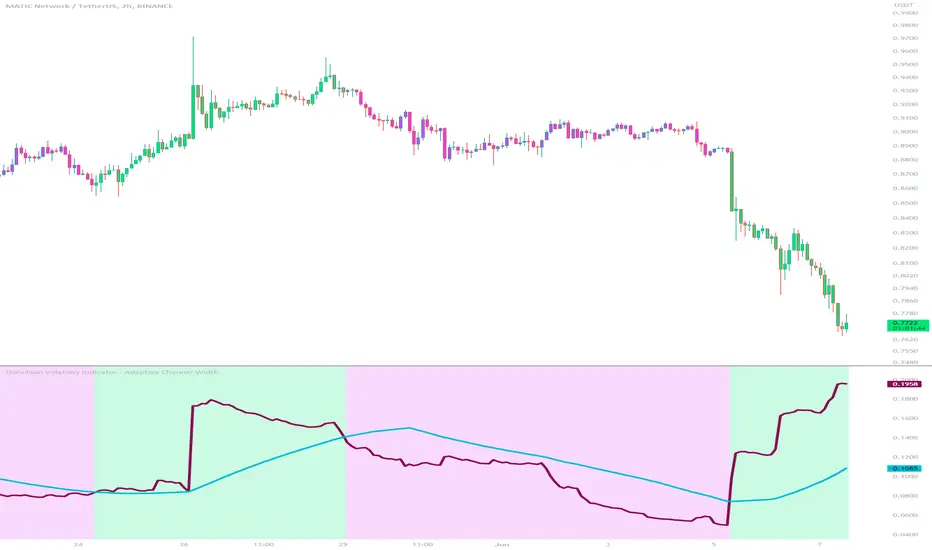
Donchian Volatility Indicator - Adaptive Channel WidthThis indicator is designed to help traders assess and analyze market volatility. By calculating the width of the Donchian channels, it provides valuable insights into the range of price movements over a specified period. This indicator helps traders identify periods of high and low volatility, enabling them to make more informed trading decisions.
The indicator is based on the concept of Donchian channels, which consist of the highest high and lowest low over a specified lookback period. The channel width is calculated as the difference between the upper and lower channels. A wider channel indicates higher volatility, suggesting potentially larger price movements and increased trading opportunities. On the other hand, a narrower channel suggests lower volatility, indicating a relatively calmer market environment with potentially fewer trading opportunities.
The adaptive aspect of the indicator refers to its ability to adjust the width of the channels dynamically based on market conditions. The indicator calculates the width of the channels using the Average True Range (ATR) indicator, which measures the average range of price movements over a specified period. By multiplying the ATR value with the user-defined ATR multiplier, the indicator adapts the width of the channels to reflect the current level of volatility. During periods of higher volatility, the channels expand to accommodate larger price movements, providing a broader range for assessing volatility. Conversely, during periods of lower volatility, the channels contract, reflecting the narrower price ranges and signaling a decrease in volatility. This adaptive nature allows traders to have a flexible and responsive measure of volatility, ensuring that the indicator reflects the current market conditions accurately.
To provide further insights, the indicator includes a signal line. The signal line is derived from the channel width and is calculated as a simple moving average over a specified signal period. This signal line acts as a reference level, allowing traders to compare the current channel width with the average width over a given time frame. By assessing whether the current channel width is above or below the signal line, traders can gain additional context on the volatility level in the market.
The colors used in the Donchian Volatility Indicator - Adaptive Channel Width play a vital role in visualizing the volatility levels:
-- Lime Color : When the channel width is above the signal line, it is colored lime. This color signifies that volatility has entered the market, indicating potentially higher price movements and increased trading opportunities. Traders can pay closer attention to the lime-colored channel width as it may suggest favorable conditions for trend-following or breakout trading strategies.
-- Fuchsia Color : When the channel width is below the signal line, it is colored fuchsia. This color represents relatively low volatility, suggesting a calmer market environment with potentially fewer trading opportunities. Traders may consider adjusting their strategies during periods of low volatility, such as employing range-bound or mean-reversion strategies.
-- Aqua Color : The signal line is represented by the aqua color. This color allows traders to easily identify the signal line amidst the channel width. The aqua color provides a visual reference for the average channel width and helps traders assess whether the current width is above or below this average.
The Donchian Volatility Indicator - Adaptive Channel Width has several practical applications for traders:
-- Volatility Assessment : Traders can use this indicator to assess the level of volatility in the market. By observing the width of the Donchian channels and comparing it to the signal line, they can determine whether the current volatility is relatively high or low. This information helps traders set appropriate expectations and adjust their trading strategies accordingly.
-- Breakout Trading : Wide channel widths may indicate an increased likelihood of price breakouts. Traders can use the Donchian Volatility Indicator - Adaptive Channel Width to identify potential breakout opportunities. When the channel width exceeds the signal line, it suggests a higher probability of significant price movements, potentially signaling a breakout. Traders may consider entering trades in the direction of the breakout.
-- Risk Management : The indicator can assist in setting appropriate stop-loss levels based on the current volatility. During periods of high volatility (lime-colored channel width), wider stop-loss orders may be warranted to account for larger price swings. Conversely, during periods of low volatility (fuchsia-colored channel width), narrower stop-loss orders may be appropriate to limit risk in a more range-bound market.
While the Donchian Volatility Indicator - Adaptive Channel Width is a valuable tool, it is important to consider its limitations:
-- Lagging Indicator : The indicator relies on historical price data, making it a lagging indicator. It provides insights based on past price movements and may not capture sudden changes or shifts in volatility. Traders should be aware that the indicator may not generate real-time signals and should be used in conjunction with other indicators and analysis tools.
-- False Signals : Like any technical indicator, the Donchian Volatility Indicator - Adaptive Channel Width is not immune to generating false signals. Traders should exercise caution and use additional analysis to confirm the signals generated by the indicator. Considering the broader market context and employing risk management techniques can help mitigate the impact of false signals.
-- Market Conditions : Market conditions can vary, and volatility levels can differ across different assets and timeframes. Traders should adapt their strategies and consider other market factors when interpreting the signals provided by the indicator. It is crucial to avoid relying solely on the indicator and to incorporate a comprehensive analysis of the market environment.
In conclusion, this indicator is a powerful tool for assessing market volatility. By examining the width of the Donchian channels and comparing it to the signal line, traders can gain insights into the level of volatility and adjust their trading strategies accordingly. The color-coded representation of the channel width and signal line allows for easy visualization and interpretation of the volatility dynamics. Traders should utilize this indicator as part of a broader trading approach, incorporating other technical analysis tools and considering market conditions for a comprehensive assessment of market volatility.
Market Cycle IndicatorThe Market Cycle Indicator is a tool that integrates the elements of RSI, Stochastic RSI, and Donchian Channels. It is designed to detect market cycles, enabling traders to enter and exit the market at the most opportune times.
This indicator provides a unique perspective on the market, combining multiple strategies into one unified and weighted approach. By factoring in the inputs from each of these popular technical analysis methods, it offers a more holistic view of the market trends and cycles.
Parameter Details:
Donchian Channels (DCO):
- donchianPeriod: Sets the period for the Donchian Channel calculation. Default is set to 14.
- donchianSmoothing: Sets the smoothing factor for the Donchian Channel calculation. Default is set to 3.
- donchianPrice: Selects the price type to be used in the Donchian Channel calculation. Default is set to the closing price.
Relative Strength Index (RSI):
- rsiPeriod: Sets the period for the RSI calculation. Default is set to 14.
- rsiSmoothing: Sets the smoothing factor for the RSI calculation. Default is set to 3.
- rsiPrice: Selects the price type to be used in the RSI calculation. Default is set to the closing price.
Stochastic RSI (StochRSI):
- srsiPeriod: Sets the period for the Stochastic RSI calculation. Default is set to 20.
- srsiSmoothing: Sets the smoothing factor for the Stochastic RSI calculation. Default is set to 3.
- srsiK: Sets the period for the %K line in the Stochastic RSI calculation. Default is set to 5.
- srsiD: Sets the period for the %D line in the Stochastic RSI calculation. Default is set to 5.
- srsiPrice: Selects the price type to be used in the Stochastic RSI calculation. Default is set to the closing price.
Weights:
- rsiWeight: Sets the weight for the RSI in the final aggregate calculation. Default is set to 1.
- srsiWeight: Sets the weight for the Stochastic RSI in the final aggregate calculation. Default is set to 1.
- dcoWeight: Sets the weight for the Donchian Channel in the final aggregate calculation. Default is set to 1.
Limits:
- limitHigh: Sets the upper limit for the indicator. Default is set to 80.
- limitLow: Sets the lower limit for the indicator. Default is set to 20.
By customizing these parameters, users can tweak the indicator to align with their own trading strategies and risk tolerance levels. Whether you're a novice or an experienced trader, the Comprehensive Market Cycle Indicator provides valuable insights into the market's behavior.
Uses library HelperTA

custom Bollinger bands with filters - indicator (AS)-----------Description-------------
This indicator is basically Bollinger bands with many ways to customize. It uses highest and lowest values of upper and lower band for exits. I think something is wrong with the script but cant find any mistakes – most probably smoothing. The ATR filter is implemented but is working incorrectly. In code you can also turn it into strategy but I do not recommend it for now as it is not ready yet.
So this is my first script and I am looking for any advice, ideas to improve this script, sets of parameters, markets to apply, logical mistakes in code or any ideas that you may have. Indicator was initially designed for EURUSD 5MIN but I would be interested in other ideas.
-----------SETTINGS--------------
---START - In starting settings we can choose
Line 1: what parts to use BB/DC/ATR
Line 2: what parts to plot on chart
Line 3 Whether or not apply smoothing to BB or ATR filter
Line 4 Calculate deviation for BB from price or Moving average
Line 5 Fill colors and plot other parts for debug (overlay=false)
Line 6:( for strategy) – enable Long/Short Trades
---BB and DC – here we modify Bollinger bands and Donchian
Line 1: Length and type of BB middle line and also length of DC from BB
Line 2: Length and type of BB standard deviation and multiplier
Line 3: Length and type of BB smoothing and %width for BB filter
---ATR filter – (not ready fully yet)
Line 1: type and length of ATR
Line 2: threshold and smoothing value of ATR
---DATE and SESSION
Line 1: apply custom date or session?
Line 2: session hours settings
Line 3:Custom starting date
Line 4: Custom Ending date
-----------HOW TO USE--------------
We open Long if BB width is bigger than threshold and close when upper band is no longer highest in the period set. Exact opposite with Short

Donchian Channels [Gu5]█ OVERVIEW
I changed the design of the classic indicator "Donchian Channels", for easy reading.
█ CONCEPTS
Donchian Channels is an indicator made up of upper and lower bands around a mid-band or Basis.
The upper band marks the highest price of a security for N periods, while the lower band marks the lowest price of a security for N periods. The area between the upper and lower bands.
In this version, when there are new Higher High (HH), the trend is Bullish and the channel is painted green.
When there are new Lower Low (LL), the trend is Bearish and the channel is painted Red
█ OTHER SECTIONS
A plus in this script: When there are no new highs or new lows, there is no certain trend
The channel is painted yellow
www.tradingview.com
• HOW TO USE
Menu "Display"
• '■ Basis On/Off': Shows the midline Basis
• '■ Alert On/Off': Shows alerts labels
• '■ Fill On/Off': Paint the entire channel the color of the trend
• '■ Bar Color On/Off': Paint the candle the color of the trend
• '■ Close Alert On/Off': Shows alerts end of trend
• NOTES:
This code was written using the recommendations from the Pine Script™ User Manual's Style Guide
• RAMBLINGS:
You can use the "Basis" line as Trailing Stop.
• THANKS:
Donchian Channels developed by Richard Donchian
and many MANY thanks to @PineCoders

Donchian Channel Oscillator (DonOsc) Preface
DonOsc stands for Donchian Channel Oscillator. This channel envelopes all prices, so if you set the height of the channel to 100 percent, you can plot the prices as percent in between, creating this sub-pane oscillator. For clarity the example chart shows a Donchian channel in the main-pane with the same look-back as the DonOsc, this way you can see how both are related.
Price River
Not only the close is plotted, but also the high and the low of the bar. Thus you get a structure that can be associated with a river, streaming from left to right, in which the price moves between the left bank (i.e. the plotted highs) and the right bank (i.e. the plotted lows), which meanders between the high border (100%) and the low border (0%) of the oscillator. The surface of the price river is gray. The price line is blue when up and dark red when down. The river has also color patches dark red, light red, blue and aqua. Stochastic patches; up: aqua, down: light red
If you look at the price river, you may notice that the price line is closer to the left bank (highs) when moving up and to the right bank (lows) when moving down. Because this phenomenon is used in the stochastic indicator, I named these stochastic patches. These are depicted on the wide side for visibility, so the aqua patches are to the right of the price line and the light-red patches to the left.
Widening patches; up: blue, down: red
If you look at tops or bottoms in bar charts, you may notice that long bars (wide range) tend to be there. You may say that prices turn with a ‘range bang’. This causes a widening of the price river, depicted as a patch on the wide side.
Channel Features
High (76.4 %) and low (23.6 %) Fibonacci levels.
In the oscillator there is no need to calculate Fibonacci levels, we can just plot them. If the price is above 50% the low level is shown with a green color, when below the high level with a pink color. When the price river crosses a level a ‘near border’ highlighter will flash, lime near the high border and orange near the low one.
New high and new low markers.
A flaw in the oscillator is that is doesn’t show actual new lows and new highs in the Donchian Channel, because everything is made relative. This is ‘repaired’ by adding markers, dark red for new low depicted between the high fib and border, blue for new high depicted between low fib and border. Used are the same colors as in the widening patches, because new highs and lows also lead to widening of the actual Channel.
Uptrend and downtrend highlighters.
If in the actual Channel the bars run in the upper half, an uptrend is happening as long as these remain there, a downtrend when the bars remain in the lower half. In the oscillator a yellow highlighter flashes when the price is higher than 50%, a red highlighter below 50%.
Interpretation of the DonOsc
This sub-pane indicator provides a wealth of useful information about what is going on in the market. First of all you immediately see whether there is an up or down trend and whether these lead to new highs or lows. Second of all you can estimate the importance of price movements in the context of the look-back period. Thirdly the width of the price river reveals the emotions in the market. The higher the emotions run, the more risk is involved in a postilion in the charted instrument.
Settings of the DonOsc
Look-back settings.
By default the script sets the look-back, depending on the time frame. This overrules the standard manual setting. If you switch this off, the manual setting will work. A feed-back label can by shown which informs about the current setting.
Smoothing
This concerns the price river. Default is 2, if you increase this setting, the river will loose its touch with the channel borders. O.t.o.h. the river wil be wider and better visible. Maximum setting is 5.
Colors
The momentum colors set both the river widening patches and new high and low markers.
Take care, Eykpunter.
