Index & Stock Options Reference Tool-(ISORT) [Arjo]The Index & Stock Options Reference Tool-(ISORT) is an indicator that helps users observe price trend direction together with commonly used option strike levels for selected indices and stocks in Indian market .
The indicator integrates a smoothed trend framework with structured option-related data to help users observe how price direction aligns with commonly referenced option strike levels .
It does not generate trading signals, does not provide buy or sell recommendations, and does not evaluate profitability .
Key Features
1. Trend Context Engine
Uses a Super-Smoother filter combined with EMA smoothing
Highlights directional context through color-based trend states
Designed to reduce short-term noise
2. Dynamic ATM & Strike Reference
Automatically computes ATM strike and offset strike levels to select OTM strike
Strike intervals adapt to the selected index or stock
Supports both NSE and BSE instruments, including SENSEX
3. Expiry Awareness
User-selectable expiry date inputs
Displays a visual warning if the selected expiry has already passed
Helps avoid referencing outdated option contracts
4. Option Price Reference Panel
Displays last observed CALL and PUT prices (when available)
Allows optional manual entry values for analytical comparison
All price values are shown strictly as references
5. Informational Table Overlay
Customizable on-chart table layout
Displays strike, timestamp, price reference, and arithmetic P&L values
Table values are informational only, not predictive or advisory
How to Use
1. Select the Underlying Instrument
Choose whether to reference the current chart symbol or a custom index/stock from the input settings
Supported instruments include major NSE indices, selected stocks, and SENSEX
2. Configure Expiry Parameters
Enter the option expiry date using the Day, Month, and Year inputs
If an expired date is selected, the indicator will display a visual warning
This helps ensure option references remain time-relevant
3. Observe Trend Context
The smoothed trend line provides directional context only
Color changes reflect shifts in price structure, not trade instructions
This trend is intended for contextual analysis, not timing entries
4. Review Strike References
The indicator automatically calculates ATM and offset strike levels
Strike spacing adjusts based on the selected index or stock
These values serve as reference levels commonly observed in options markets
5. Interpret the Information Table
The on-chart table displays:
Strike level
Timestamp of the most recent context change
Last observed option price (when available)
Arithmetic price difference values
All values are informational references only and do not represent performance or outcomes
6. Optional Manual Inputs
Manual price fields can be used to compare external reference values
These inputs do not trigger signals or automated calculations
Important Notes
This indicator is not a trading system
It does not generate buy or sell signals
It does not provide financial or trading advice
It is intended for learning, observation, and market study
Disclaimer
This script is provided for educational and analytical purposes only. It does not constitute investment advice, trading advice. The author assumes no responsibility for decisions made using this indicator.
Happy Trading (Arjo)
Derivatives

Multi Straddle-Strangle ChartThis powerful indicator is designed for options traders who want to visualize and track the combined premium of multiple straddle and strangle strategies in a single, dedicated pane.
Quickly analyze and compare up to five different options strategies at a glance, directly on your chart. This tool is perfect for monitoring volatility, tracking potential profits/losses on a position, and spotting key support and resistance levels based on option premiums.
Key Features:
Plot Up to 5 Strategies: Simultaneously plot any combination of up to 5 straddles or strangles.
Real-Time Data: Fetches live data for both Call and Put options to give you an up-to-the-second view of the combined price.
Dynamic Symbol Generation: Automatically detects the underlying symbol (e.g., NIFTY, BANKNIFTY, stocks) and builds the correct option symbols based on your input.
Customizable Inputs: Easily configure the expiry date, strike prices and line colors for each of the 5 lines.
In-Chart Summary Table: A clean and clear table in the corner of your chart provides a quick summary of each enabled strategy and its current price.
Important Note on Usage:
This tool requires you to input a strike price in all fields, even if you do not plan to use all five lines. This is necessary because of a fundamental rule in the Pine Script language: every input must have a constant, non-empty default value. The indicator is optimized to only fetch data for the lines you have explicitly enabled with the "Enable Line X" checkbox.

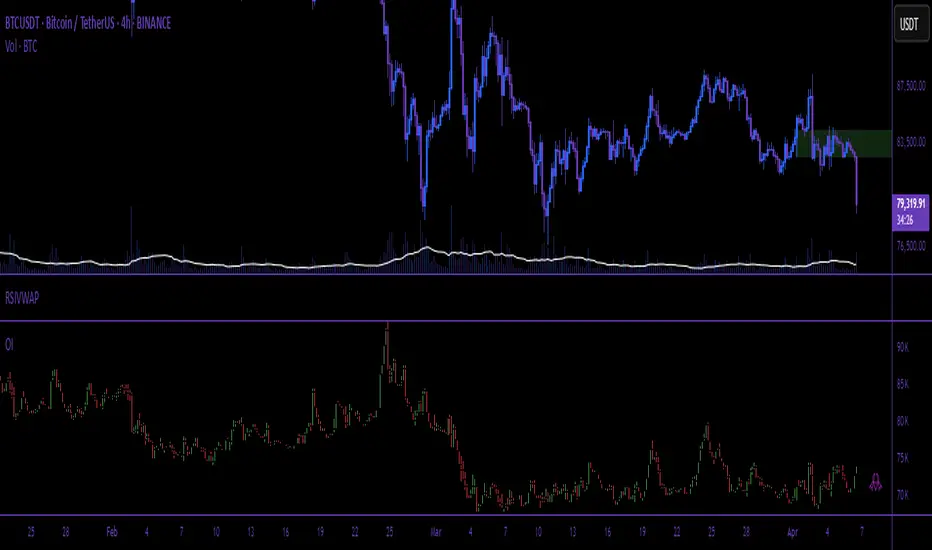
Open Interest (Multiple Exchanges for Crypto)On some cryptocurrencies and exchanges the OI data is nonexistent or deplorable. With this indicator you can see OI data from multiple exchanges (or just the best one) from USD,USDT, or USD+USDT pairs whether you are using a perpetuals chart or not.
Hope you all like it!
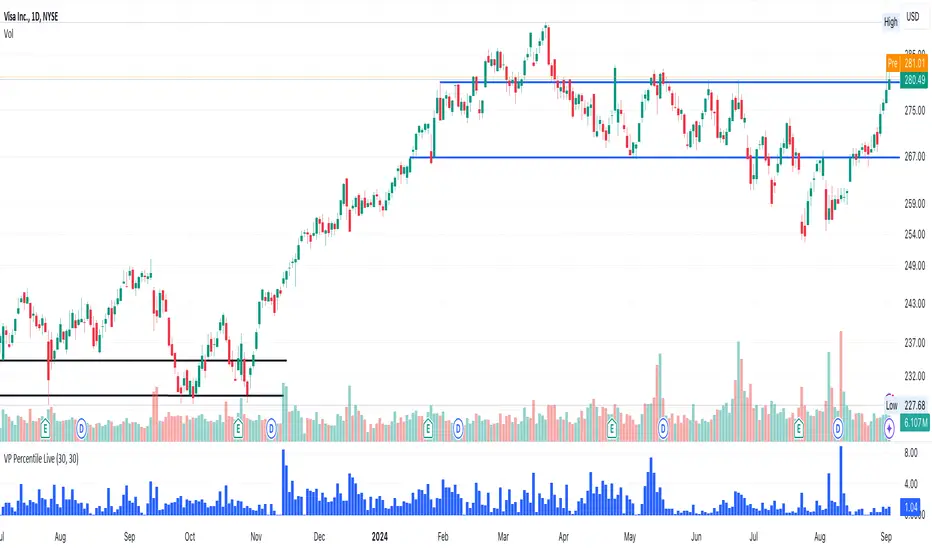
Volume-Price PercentileDescription:
The "Volume-Price Percentile Live" indicator is designed to provide real-time analysis of the relationship between volume percentiles and price percentiles on any given timeframe. This tool helps traders assess market activity by comparing how current volume levels rank relative to historical volume data and how current price movements (specifically high-low ranges) rank relative to historical price data. The indicator visualizes the ratio of volume percentile to price percentile as a histogram, allowing traders to gauge the relative strength of volume against price movements in real time.
Functionality:
Volume Percentile: Calculates the percentile rank of the current volume within a user-defined rolling period (default is 30 bars). This percentile indicates where the current volume stands in comparison to historical volumes over the specified period.
Price Percentile: Calculates the percentile rank of the current candle's high-low difference within a user-defined rolling period (default is 30 bars). This percentile reflects the current price movement's strength relative to past movements over the specified period.
Percentile Ratio (VP Ratio): The indicator plots the ratio of the volume percentile to the price percentile. This ratio helps identify periods when volume is significantly higher or lower relative to price movement, providing insights into potential market imbalances or strength.
Real-Time Data: By fetching data from a lower timeframe (e.g., 1-minute), the indicator updates continuously within the current timeframe, offering live, intra-candle updates. This ensures that traders can see the histogram change in real-time as new data becomes available, without waiting for the current candle to close.
How to Use:
Adding the Indicator: To use this indicator, add it to your chart on TradingView by selecting it from the Indicators list once it is published publicly.
Setting Parameters:
Volume Period Length: This input sets the rolling window length for calculating the volume percentile (default is 30). You can adjust it based on the desired sensitivity or historical period relevance.
Candle Period Length: This input sets the rolling window length for calculating the price percentile based on the high-low difference of candles (default is 30). Adjust this to match your trading style or analysis period.
Interpreting the Histogram:
The histogram represents the volume percentile divided by the price percentile.
Above 1: A value greater than 1 indicates that volume is relatively strong compared to price movement, which may suggest high activity or potential accumulation/distribution phases.
Below 1: A value less than 1 suggests that price movement is relatively stronger than volume, indicating potential weakness in volume relative to price moves.
Near 1: Values close to 1 suggest a balanced relationship between volume and price movement.
Application: Use this indicator to identify potential breakout or breakdown scenarios, assess the strength of price movements, and confirm trends. When volume percentile consistently leads price percentile, it might signal sustained interest and support for the current price trend. Conversely, if volume percentile lags significantly, it might warn of potential trend weakness.
Best Practices:
Multiple Timeframe Analysis: While the indicator provides real-time updates on any timeframe, consider using it alongside higher timeframe analysis to confirm trends and volume behavior across different periods.
Customization: Adjust the period lengths based on the asset’s typical volume and price behavior, as well as your trading strategy (e.g., short-term scalping vs. long-term trend following).
Complement with Other Indicators: Use this indicator in conjunction with other volume-based tools, trend indicators, or momentum oscillators to gain a comprehensive view of market dynamics.
Stochastic Moving Average Delta Oscillator (SMADO)This is an interesting take on the stochastic oscillator. What I have done here is I've taken the cumulative sum of the deltas of all the simple moving averages from 1 to 200 and summed them. Next I transform this into a stochastic oscillator with ta.stoch. The point of this is to show you trends, tops and bottoms. I hope you find this indicator as interesting as I did. Please enjoy!
The Feature include: Stochastic Window, Number of MA's to check, General Smoothing, and Direction Indication.

Volume ROC and 2nd Derivative by ianhThe purpose of this code is to graph a volume simple moving average (sma) and it's first and second derivatives to provide traders with additional information that might determine if volume is converging or diverging with price. The yellow line represents the volume sma, the red line represents the first derivative or the rate of change of the volume and the green line represents the second derivative or acceleration of volume. For long term trading, if the yellow line is "trending" upwards with higher highs and higher lows it means that volume is supporting the over all long term price trend. If the volume is decreasing over the long term then it is not supporting the current price trend. The first and second derivatives may help short term weekly traders confirm price movements. There are several different conditions to look for:
First (Red) ++ Second (Green) --, Trading volume at the current price has "peaked" and the price may reverse soon.
First (Red) -- Second (Green) ++, Trading volume at the current price has "troughed" and the price may reverse soon.
First (Red) + Second (Green) +, Trading volume is not only increasing but it's accelerating which might confirm a large price movement.
First (Red) - Second (Green) -, Trading volume is not only decreasing but it's decelerating which might indicate little to no price movement.

Polynomial Regression Derivatives [Loxx]Polynomial Regression Derivatives is an indicator that explores the different derivatives of polynomial position. This indicator also includes a signal line. In a later release, alerts with signal markings will be added.
Polynomial Derivatives are as follows
1rst Derivative - Velocity: Velocity is the directional speed of a object in motion as an indication of its rate of change in position as observed from a particular frame of reference and as measured by a particular standard of time (e.g. 60 km/h northbound). Velocity is a fundamental concept in kinematics, the branch of classical mechanics that describes the motion of bodies.
2nd Derivative - Acceleration: In mechanics, acceleration is the rate of change of the velocity of an object with respect to time. Accelerations are vector quantities (in that they have magnitude and direction). The orientation of an object's acceleration is given by the orientation of the net force acting on that object.
3rd Derivative - Jerk: In physics, jerk or jolt is the rate at which an object's acceleration changes with respect to time. It is a vector quantity (having both magnitude and direction). Jerk is most commonly denoted by the symbol j and expressed in m/s3 (SI units) or standard gravities per second (g0/s).
4th Derivative - Snap: Snap, or jounce, is the fourth derivative of the position vector with respect to time, or the rate of change of the jerk with respect to time. Equivalently, it is the second derivative of acceleration or the third derivative of velocity.
5th Derivative - Crackle: The fifth derivative of the position vector with respect to time is sometimes referred to as crackle. It is the rate of change of snap with respect to time.
6nd Derivative - Pop: The sixth derivative of the position vector with respect to time is sometimes referred to as pop. It is the rate of change of crackle with respect to time.
Included:
Loxx's Expanded Source Types
Loxx's Moving Averages

Binance Big Open Interest Delta Change v2 Note: This script will only work properly with Binance Futures symbols.
This script simply looks at the open interest for the symbol you are currently viewing and determines if a large change in open interest has occurred, which triggers a background color alert.
It does this by comparing the absolute value of the range of the current open interest bar with a simple average (length set by user) of the past x range. The user also determines what is considered a 'large' change in open interest by setting a multiplier with which the current range must exceed compared to the average range in order to trigger an alert.
If the change in open interest is an increase in OI, the alert is blue, and if the change in open interest is a decrease, the alert is orange.
The open interest ticker that is used for calculation is derived by adding the current ticker and "_OI" so that it auto changes each time you switch to a new Binance futures contract.

Premium IndexThis indicator shows the premium index data for the market (only crypto) you're currently looking at.
The premium index is the difference in price between the perpetual swap contract and the spot index price.
In plain and simple English: it shows whether the spot market for a specific coin is trading at a discount or at a premium.
This is official data from the exchange itself.
At the moment of publishing TradingView only has data for Binance.
So only use this indicator on Binance charts right now (USDT perps and BUSD perps).
Make sure you're looking at a perpetual swap contract, if you're looking at the spot market for example the indicator won't work.
Once TradingView adds more data like this I'll try to make sure that the logic of the code will also work for other markets.

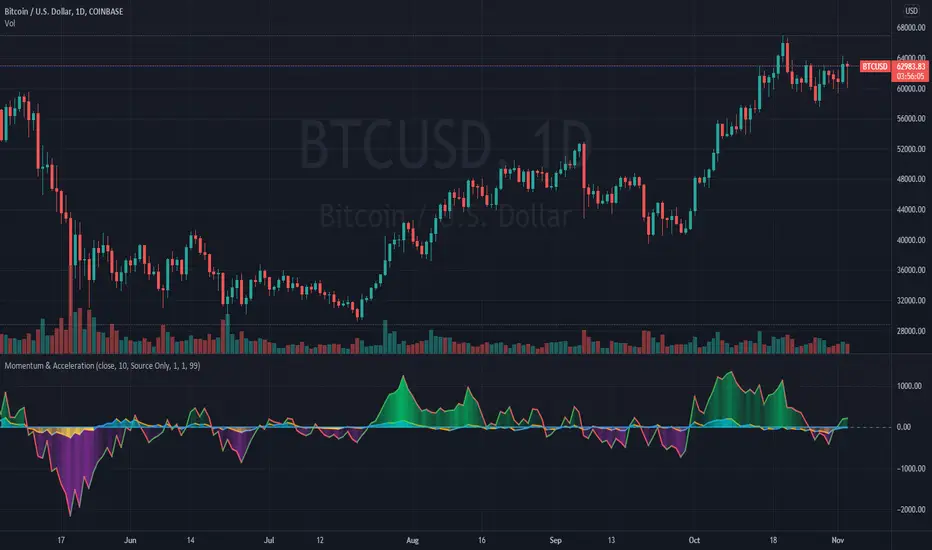
Momentum and AccelerationThe following oscillator is a twist on momentum, incorporating a 2nd derivative "acceleration" to help determine changes in momentum. Both are plotted directly accessing previous series values rather than using a moving average.
The script has an option to divide so the formula is d(Price)/d(Time), like a derivative. The script also provides options for the user to use their price source, volume, or a combination of price and volume.
Credit: This script utilizes the "color gradient framework" tutorial by LucF (PineCoders) to create user-adjustable gradient visuals.
Definitions
"1st Derivative - Momentum" - Momentum is most commonly referred to as a rate and measures the acceleration of the price and/or volume of a security.
"2nd Derivative - Acceleration" - Acceleration is the rate of change of momentum.
Value Added
This script may help the trader to assess directional changes in momentum easier.
This script also plots using previous series values rather than using a moving average function. To my knowledge, I was unable to find one that does this for "2nd derivative", so it had to be created.
MYX Malaysia Bursa Futures Derivatives Auto DetectThis indicator intended for Malaysia Market only for auto detect Futures Market Derivatives refer to Bursa Malaysia
Indikator ini adalah untuk pasaran Malaysia sahaja untuk automatik mengenalpasti Derivatif Pasaran Hadapan rujuk kepada Bursa Malaysia
Indicator features :
1. Able to detect futures market.
2. List similar symbol or counter including total.
3. Font size small for mobile app and font size normal for desktop.
4. Show date updated by Bursa Malaysia.
Kemampuan indikator :
1. Boleh mengenal pasti pasaran hadapan.
2. Senarai simbol atau kaunter yang terlibat termasuk jumlah.
3. Saiz font kecil untuk mobile app dan saiz size normal untuk desktop.
4. Memaparkan tarikh kemaskini oleh Bursa Malaysia.
FAQ
1. Credits / Kredit
LucF & PineCoders
2. Code Usage / Penggunaan Kod
Free to use for personal usage.
Bebas untuk kegunaan peribadi.
3. Why table overlap with chart ? To avoid this, click indicator > Visual Order > Send to Front.
Kenapa table bertindih dengan carta ? Untuk mengatasi ini, klik indikator > Visual Order > Send to Front.
4. Some symbols not display such as Commodities Derivatives (OCPO and OPOL) and Equity Derivatives (OKLI).
These symbol are offcially displayed at Bursa Malaysia but not available in Trading View under prefix MYX.
And also Futures Market are not available in Trading View.
Beberapa simbol tidak dapat dipaparkan Derivatif Komoditi (OCPO and OPOL) and Derivatif Equiti (OKLI).
Simbol berikut dipaparkan secara rasmi di Bursa Malaysia tetapi tiada di Trading View di bawah prefix MYX.
Dan Pasaran Hadapan juga tiada di Stock Screener.
All Setting enabled.
Semua seting diaktifkan.
Example of recommended usage.
Contoh penggunaan yang disarankan.
Example of other derivatives. Similar derivatives can be shown.
Contoh derivatif lain. Derivatif yang sama boleh dipaparkan

China to Derivateves DeltaCONCEPT
This indicator shows the delta between the Chinese market and the Derivatives, which implies the ability to track how China is trading.
FEATURES
USDT fixed Delta
Absolute Delta
Tether Desirability
TRADING
It's simple when USDT Fixed C2D, Absolute C2D and Tether Desirability are negative – this signals an increased pressure from sellers from China, also vice versa.
If you want access send me a private message so we can discuss it.
Cheers.

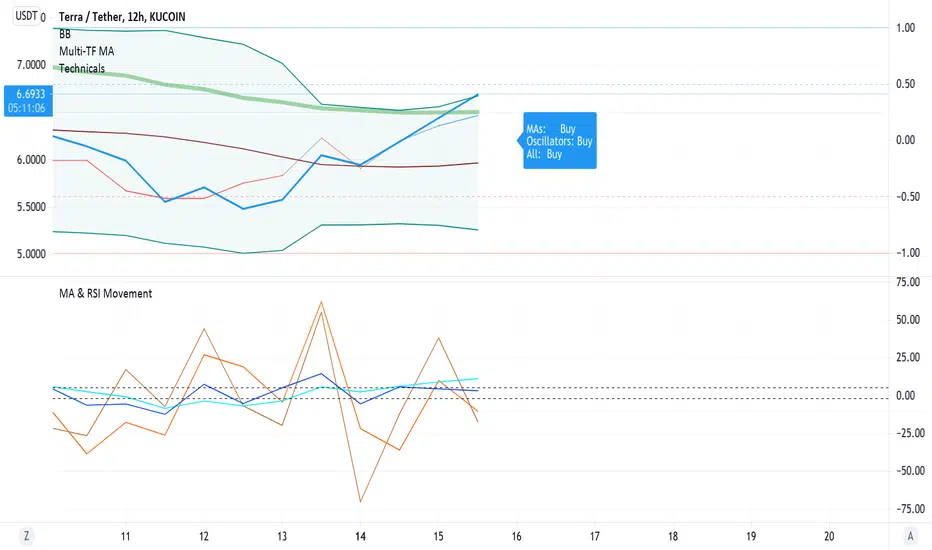
Barholle eMA and RSI Movement TestThis is a test that offers insight into whether and asset is heading into bullish or bearish territory.
This indicator/test offers insight into the Exponential Moving Average's velocity and acceleration as well as the Stochastic RSI's velocity, acceleration and jerk. Included is a 'Stochastic Difference' and 'Stochastic Growth' indicators (commented out) that measure the difference between K and D in the Stoch RSI as well as the rate of it's change. This test is all about crossovers - the best leading indicator is a downward cross of the eMA velocity over the eMA acceleration, indicating a drop in price in the current or next bar.
The lines or importance have been set to -2 and 5, but these should be adjusted to suit your preferences. These numbers were chosen in order to try and create some kind of threshold after which action might be suggested. Backtesting is highly recommended so you can see how the test does and does not work. It is super powerful, but it is not omniscient - its an RSI and eMA derivative, past success does not necessarily dictate future success.
Please look at the code for several more plots you can use of derivatives and other ideas explore but commented out for greater legibility of the graph. Commenting and commenting (or uncommenting all and just disabling some in the settings) and comparing the graphs and crossovers is a useful exercise. To that end, one last concept - the MARSI - a combined moving averages and RSI measurement - was abandoned because it didn't appear to indicate anything of use, however you may find crossovers or patterns with it comparing it to other graphs, so it was left in but commented.
Please take a look at the comments and all the math and indicators 'left on the cutting room floor' in the script. Maybe you'll find a gem in the redux version of this script.
Outreach regarding the script, patterns noticed and full-on stealing of the script are all permitted. Many elements of this script were nabbed from other scripts - thank you to a community of coders who put it all out there.
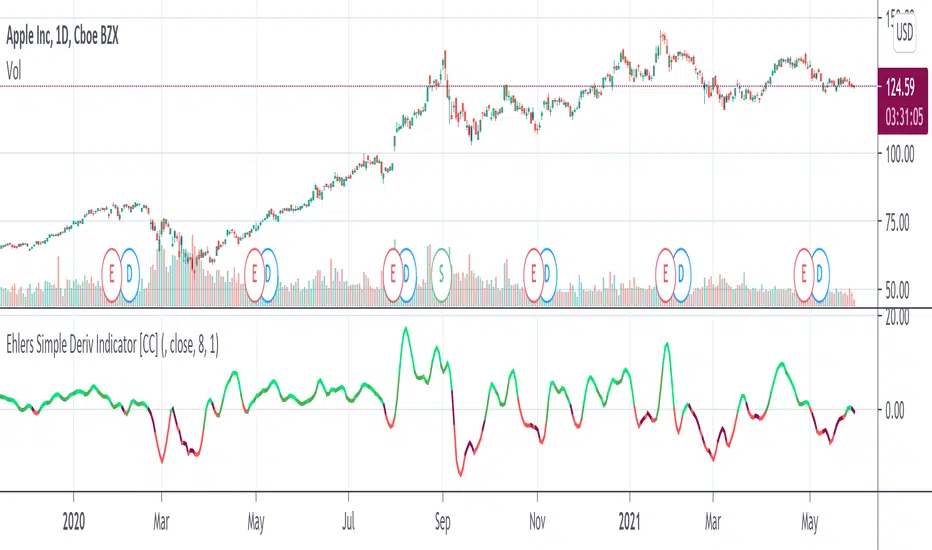
Ehlers Simple Deriv Indicator [CC]The Simple Deriv Indicator was created by John Ehlers (Stocks and Commodities June 2021 pg 10) and this is a heavily modified version of his original script that changes the buy and sell signals. I did testing with his original settings but they didn't seem to be very profitable for most stocks so I created my own system. This indicator does have a lag though so it is best used for trend confirmation imo. Buy when the line turns green and sell when it turns red.
Let me know if there are any other indicators you would like to see me publish!
Liquidation Levels
I got sick of calculating leverage all of the time, so I made this real time calculator. It is primarily for crypto derivatives.
It tracks and displays the liquidation price for 5 customisable leverage levels and plots them either historically and/or in real time, with labels beside each including the estimated price.
These calculations include maintenance margin and can be configured for linear futures (USDT) or non-linear futures. Never again make dumb mistakes that are obvious with a bit of maths.
To jazz it up, you can customise the colours, disable various labels, set different leverage multiples, and change the offsets and number of bars to plot in the past.
Alternatively, you can change the offset to 24 on an hourly chart and change show last bars to 0. By doing this, you can see which levels most often get liquidated. It is crude, I know, and there are better tools for tracking liquidation hunts. This is not an attempt to replace or compete with them.
Enjoy and trade safely.

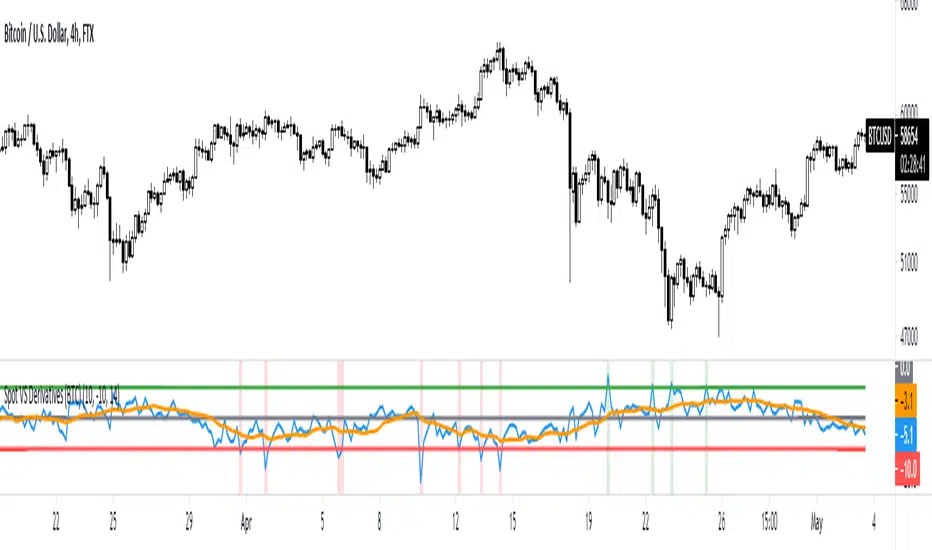
Spot VS Derivatives (BTC)This indicator shows you the difference between the price on the spot exchanges and the derivatives exchanges. When the ratio spikes upward, it is a good buying opportunity, and when it spikes downward, it is a good moment to sell. The best timeframe for this indicator is 4h. The calculation includes top 10 spot and derivatives exchanges by volume .
100 Derivatives, Averages, and Plot SeriesSimple Indicator that shows derivatives of chosen source data up to 100 and averaging treatment, plus various plot series for additional insight. Will be adding more Averages and more series as time goes on.

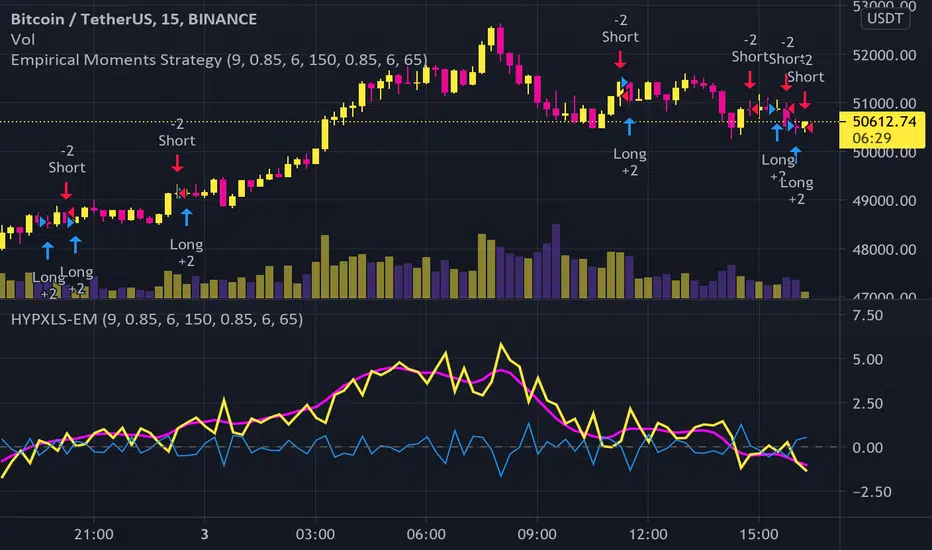
Empirical MomentsBINANCE:BTCUSDT I thought I’d make an indicator for the “fast trader”. This indicator compares the changing high prices with the close prices and in doing so, detects positive “anomalies” (the outlier drift). It gets more complicated than that; the practical indicator is the “empirically weighted drift”, which is a weighted average of the former with its derivatives up to the third order I.e. the “outlier yank”. The empirically weighted drift crossing above and below zero with long and short actions, respectively is used as the strategy. With this strategy, current backtesting for the 15 minute BTCUSDT on the Binance market yields a Sharpe ratio of 1.47 and profit factor of 1.12. Publishing the strategy as well.
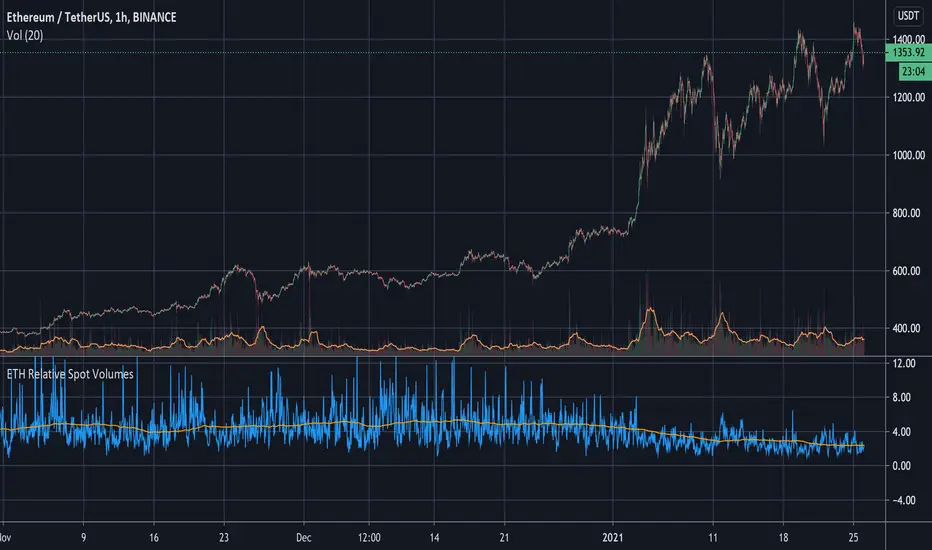
ETH Relative Spot VolumesCompares ETHUSD spot market volumes to ETHUSD perpetual swap volumes.
A higher ratio indicates higher spot buying interest and a more sustained growth overall.
Rallies-driven by spot are deemed more resilient to being affected by high funding rates on futures markets. The long-term trend seems to be increased derivatives volume on ETHUSD contracts making spikes of spot interest more noticeable.
A 200-period Simple Moving Average is applied to indicate a long-term trend.
Weighted derivatives premium BTCCan be extended with more derivative or spot pairs, see the comments in the code for instructions. Most importantly, the pairs need to be added to the respective arrays in the same order, so that the weights are applied to the correct pairs.

Premium Index Generic TheHuntThis indicator is similar to the standard premium index we made for bitcoin, but this one is for alts.
Just like with the bitcoin premium index, you can compare the spot price of a certain altcoin with the price on a futures exchange. The indicator can be used to spot potential strength or weakness in the market.
You can fill in 1 spot exchange pair and compare it with 2 futures exchange pairs.
For example fill in ETHUSD on coinbase and compare it with the future prices on bitmex and bybit.
We can clearly see that on that dump in the blue area, the premium index showed that spot prices were consistently higher than future prices which told us spot was buying the dip.

Truenomic's Volume Weighted Aggregated BTC Premium IndexAn indicator that determines the aggregated volume-weighted premium from all leading derivatives exchanges:
Bybit
Bitmex
Binance
Ftx
Deribit
Okex
Huobi

Truenomic's BTC Premium IndexAn indicator that determines the premium from all leading derivatives exchanges:
Bybit
Bitmex
Binance
Ftx
Deribit
Okex
Huobi
