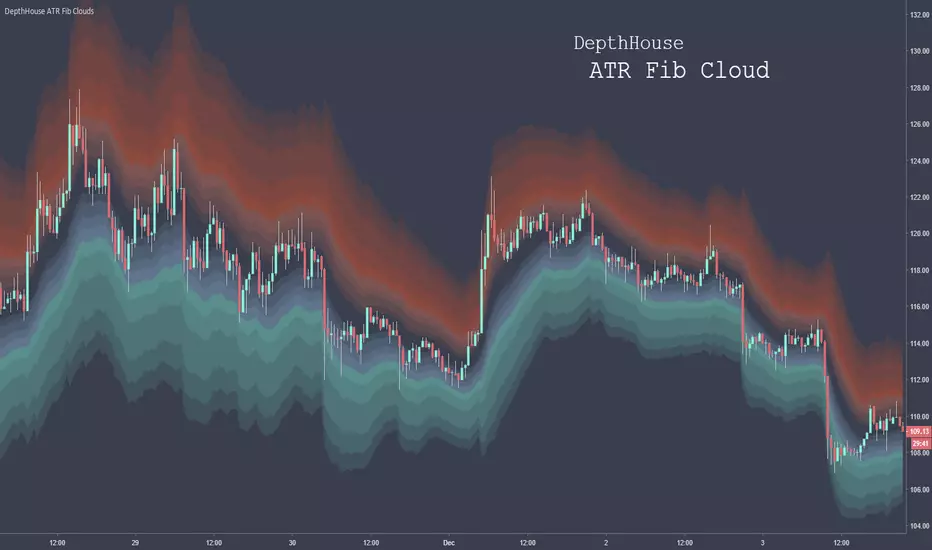
DepthHouse - ATR Fib CloudsDepth House ATR Fib Clouds is used to help traders spot dynamic support, resistance, retracement zones, and over-extensions.
Here is a video which I give a brief overview and show it in action:
youtu.be
Based on the zoning colors above:
Red and Blue zones represent common retracement zones.
Green and Orange zones represent possible over-extension zones, and trend changes.
This tool can also help differentiate between bull and bear markets on larger time frames. Trending markets tend to stick within the bottom or top of the loud zones.
Please Note: There are NOT trading signals. Each colored candle represents nothing other than a possibility of which way the trend may go. Be sure to use your own adequate analysis. Use at your own financial risk.
How to get:
As you can see this is an invite only script. In the coming months this indicator, along with many others will become pay to use only. (website on my profile page)
However all my indicators will be FREE until May 1, 2018. So please try them out!
To take advantage of this FREE trial :
1. Subscribe to my YouTube channel. I have many more videos to come! Maybe even leave a comment of what you would like to see next!
2. Comment on this indicator post! Maybe even give me a follow :D
I hope you all enjoy!!
Indicator website: depthhouse.com
Depthhouse
DepthHouse - Trend & Reversal CandlesticksDepth House Trend and Reversal Candlestick Indicato r is a custom trading tool designed to help traders determine trend direction, and possible trend reversal points.
Here is a video which I give a brief overview and show it in action:
youtu.be
How it works:
Based on the default settings, there are 5 primary colors that each have their own possible signal.
The colors are:
Green - Trending upwards
Red – Trending downwards
Lime –Trending upwards with a chance of reversal
Orange – Trending downwards with a chance of reversal
Grey – General trend is unknown
Please Note: There are NOT trading signals. Each colored candle represents nothing other than a possibility of which way the trend may go. Be sure to use your own adequate analysis. Use at your own financial risk.
How to get:
As you can see this is an invite only script. In the coming months this indicator, along with many others will become pay to use only. (website on my profile page)
However all my indicators will be FREE until May 1, 2018 . So please try them out!
To take advantage of this FREE trial:
1. Subscribe to my YouTube channel. I have many more videos to come! Maybe even leave a comment of what you would like to see next!
2. Comment on this indicator post! Maybe even give me a follow :D
I hope you all enjoy!!
Indicator website: depthhouse.com

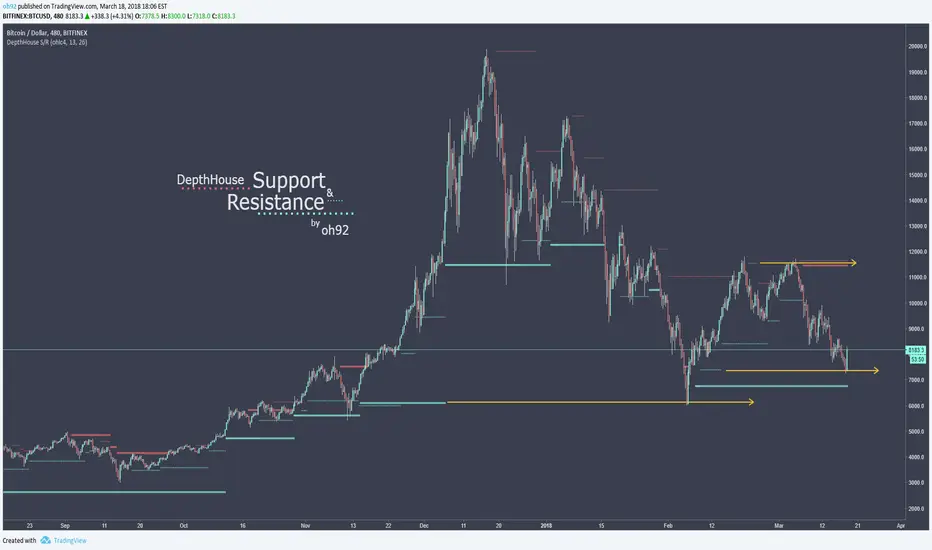
DepthHouse - Support and Resistance IndicatorDepth House Support & Resistance Indicator is a custom trading tool designed to help traders locate possible support and resistance levels on stocks, cryptocurrencies, and all forex pairs.
A fantastic tool on all time frames.
Here is a video which I give a brief overview and show it in action:
youtu.be
How it works:
Based on the default settings, the ticker dots represent strong support and resistance while the smaller lines tend to represent weaker support/resistance.
As shown on the chart above, even after a line stops plotting, it still serves as possible support and/or resistance.
Changing the settings completely alters the support lines, so adjust and find what works best for you!
How to get:
As you can see this is an invite only script. In the coming months this indicator, along with many others will become pay to use only. (website on my profile page)
However all my indicators will be FREE until May 1, 2018 . So please try them out!
To take advantage of this FREE trial:
1. Subscribe to my YouTube channel. I have many more videos to come! Maybe even leave a comment of what you would like to see next!
2. Comment on this indicator post! Maybe even give me a follow :D
I hope you all enjoy!!
Indicator website: depthhouse.com