Ichi-Price WaveWelcome to the Ichi-Price Wave. This indicator is designed for day trading options contracts for any ticker, using a number of indicators — Ichimoku Cloud, Volume-Weighted Average Price, Stochastic Relative Strength Index, Exponential Moving Average (13/48) — and calculating how they interact with each other to provide entry and exit signals for both Calls and Puts on normal days. ****Read the Important Information section before opening any positions based on this indicator. (Also *NFA)
The general concept is that you, the trader, are a Surfer 🏄🏾 who rides the best waves in deep water until it gets dangerous.
Emoji storyline: The 🏄🏾 emoji (Call or Put, depending on the color of its Green or Red label, respectively) indicates an upcoming *potential* entry that, for a number of reasons, may be disregarded. (See: Important Information section below). And just as there are no certainties in the stock market itself, the tiered exit signals are ranked by low 🐬, medium 🦈 and high risk 🦑 tolerance. (In other words, it's relatively safe to surf with dolphins around, but there's the off chance they even strike trainers and become aggressive. It's more dangerous to swim with sharks. And on the unlikely, rare occasion you see a literal, giant, mythical, ship destroying Kraken 😬 ... you definitely need to get out of the water.
Surfing for as long as possible reaps the greatest rewards — but risk/reward are to be considered for entries and exits. Exiting every time you see a 🐬 (E1) should secure profits nearly 100% of the time, but they'll be very minimal. Whereas surfing til you reach a Kraken 🦑 (which will not even appear on most Price Wave cycles) would reap the most rewards. (NFA: I recommend considering sharks 🦈 as an exit point for the majority of positions, and perhaps only keeping a few runners open with the hopes of finding that shiny Kraken. (On the non-Emoji chart, the low, medium and high risk exits are named E1, E2 and E3, respectively. Got to the indicator's Settings > Inputs > then toggle EMOJIs ON/OFF)
Boring stuff: The entry 🏄🏾 signals are triggered by multiple conditions that must be all true. For Call entries, one of the necessary conditions is that the RSI's K must be maximum 10 (this can be changed in default). This, along with another condition where current price must be below the VWAP Lower Bound 1, serves as a great reference point showing the stock price is currently uncomfortable where it is and may likely soon snap back closer to the VWAP, perhaps even to the other side due to a pendulum effect.
Important information
Relying on those two factors for setting entry and exit points are great for normal days. (Normal, as in the ticker price bounces within a channel (e.g., ≤3% + or -) that's trending slightly bullish or bearish depending on greater market trend). But there are abnormal days where news catalysts (e.g., CPI data, CEO scandals, unexpected company data release, etc.) trigger FOMO and FUD, ultimately rendering the logic behind most indicators non applicable (e.g., RSI's "buy when oversold"). On the chart, this indicator accounts for this with two measures:
One, you should only "Surf" in the water. That is, there are two bands — Shallow and Deep Water. Any "Surf" emojis where price action is outside of the water should be ignored**. Two, there are additional EMOJIs that show you "Bearish trend" ⛈ and "Bullish trend ☀️. (Story time again: You obviously shouldn't surf in thunder and lightning. But also, surfing in the blistering sun with no clouds in the sky during a heatwave is also dangerous to your health.)
You can use these two measures to disregard the "surfers" suggesting you join them in opening a position in the suggested direction. And surfers followed by Cloud EMOJIs — 🌤️ (Put) or 🌧️ (Call) — can be used as "perfect entry" points. (The clouds represent weather being less extreme and better for surfing).
(**While these should mostly be ignored, these have not been muted because there is the possibility of a very strong turn around if you happen to catch the last one (which is not ideal for risk-averse traders). Use other indicators, such as the MACD and trend lines, to find potential bottoms (or tops) as price action plunges (or soars) due to abnormal news circumstances.)
Entry and exit buffers
At the beginning of each day, most indicators usually are not immediately calibrated correctly due to premarket trading and open market (at least to the degree that the day's sentiment can be best read from them due to the amount of volatility). What I recommend when using this indicator is disregarding signals during the first 15 minutes (or possibly 30 minutes) of market open to get the best results. And also, considering this indicator is meant for day trading (i.e., not holding positions overnight), disregarding ENTRY signals for the last 45 minutes of the trading day could give yourself enough buffer on the back end for exiting comfortably.
RSI entry
Preparing for an entry when you see a surfer is recommended, but actually opening the position when you see a 🌤️ (Put) or 🌧️ (Call) would yield best results and avoid misfires — particularly when those two cloud EMOJIs are signaled when the RSI is overbought and K is at least 95 (Puts), or oversold and K at maximum 5 (Calls). (Story time logic: The cloud eclipsing the Sun means it's cooling off and better for surfing. And the rain cloud no longer having lightning means the "bearish" storm is possibly soon over).
Delta and the Greeks
You should experiment yourself, but keep in mind that this is for capitalizing off of a day's minor price swings (≤3% + or -). Entering a same day expiry contract that's deep OTM is not going to work with this indicator (even if you enter at a surfer 🏄🏾 and exit at a Kraken 🦑) because the price wave from one end to the other won't be enough to compensate for the other Greeks working against you. Use another indicator (or insider knowledge ... Just kidding, that's illegal, don't do that) if you want to buy those kind of contracts.
I personally purchase contracts w/ minimum 80% Implied Volatility and somewhere between 20-40 Delta. Having a nice range for yourself with these factors, depending also on the size of your own portfolio and the risk tolerance you have, will determine how much you're able to capitalize off successful entry and exits.
Tips
• I set stop losses 5-10% depending on the ticker. (e.g., $TSLA's volatility may require SL closer to 10% whereas using it on $SPY, a 5% could suffice). This is in addition to ignoring entry signals that don't meet the aforementioned two requirements (i.e., it's risky to Surf in shallow water, and you shouldn't try to Surf at all outside of the water, ref. Band 2 and outside of Band 2). Remember, this is the stock market — not the casino. We rely on strategy and risk management — not hope.
• It's recommended you use time intervals ≤ 5 min. (I use 1 minute and 5 min)
• Liquidity . Using these signals on a ticker with low liquidity (particularly if you enter on the Ask side), can reduce your profits to 0% or even to a loss even if you have a perfect entry and exit. I always point to SPY as the optimal bid-ask spread, but keep that in mind.
What's with the name "Ichi-Price Wave"?
The "Ichi" gives credit to Japanese journalist Goichi Hosoda, whose indicator I used in conjunction with the 13/48 Exponential Moving Averages to create some of the exit signal conditions (e.g., E2🦈). That E2 condition is: Signal the first time the price intersects the Ichimoku conversion line *after* it has entered the VWAP UB/LB channel on one end and has exited on the opposite end). And it's named "Price Wave" because it's a literal price wave, which is where the fun surf narrative comes in. Also, "Price" doubles as me naming it after myself (in a less pretentious way). It's actually convenient that my last name is literally Price. Almost as if I was born for this. Nonetheless, this indicator is far more accurate in spotting directional changes than the free 13/48 cross, which oddly enough, influencers are charging for access. It's free, but the code is protected, for now at least.
Try it out on any ticker and look at how accurately it catches the tops and bottoms (keeping in mind to ignore misfires according to the two measures and also setting ~5-10% stop losses). And of course, use this in conjunction with other indicators. Ignoring all of my other emojis and simply setting surfer 🏄🏾 alerts could serve as additional confirmations for your personal strategy. Or you could simply enter at a surfer 🏄🏾 and exit when it reaches VWAP (or at least increase your Stop Loss to sell at break even if it doesn't reach). That strategy is the most conservative and would secure consistent gains). AND AGAIN, use your stop losses. Either it makes a move or it doesn't. Simply re-enter at a better point if necessary.
Daytrading

BE - Volume Scalping ProDear Traders,
Here with presenting the new Indicator (Strategy) for scalping which is primarily built based on the the Volume Analysis.
Idea behind this Indicator: I am sure every trader would agree that Volume is one of the Leading indicator along with Price, and hence thought to use the same for scalping the trades. There is a direct co-relation between the price and volume and thereby used this as a base for arriving at strength of the volume pumped in. Indicator is working on the Logic of "What is the ROC in price for the volume dumped in and does ROC quantify the same which is happened in the recent past of x candles." In order to be successful in scalping trade, Accuracy, Risk to reward and Money Management is very much crucial and hence thought so much on this to make it happen.
Note: Accuracy here being profitable in the trade and not hitting the bulls eye all the time.
What this indicator is providing:
Based on the volume, ROC & Candle Thresholds and using the inputs provided for RISK and Money Management options, Indicator continuously scans for trading opportunities and provides alerts for possible trades.
Alerts & Notifications:
There are basically 3 types of Alerts provided one with General Notification and Other with Dhan HQ notifications to support Algo Trades and AlgoJi for supporting Algo trades too.
Self Declaration:
I have been testing the performance in 30 seconds and 1 min chart and I haven't faced any issues yet. I strongly recommend users to use the same in timeframe less than 10 Min only.
Enjoy!
DISCLAIMER: No sharing, copying, reselling, modifying, or any other forms of use are authorized for our documents, script / strategy, and the information published with them. This informational planning script / strategy is strictly for individual use and educational purposes only. This is not financial or investment advice. Investments are always made at your own risk and are based on your personal judgement. I am not responsible for any losses you may incur. Please invest wisely.
Happy to receive suggestions and feedback in order to improve the performance of the indicator better.

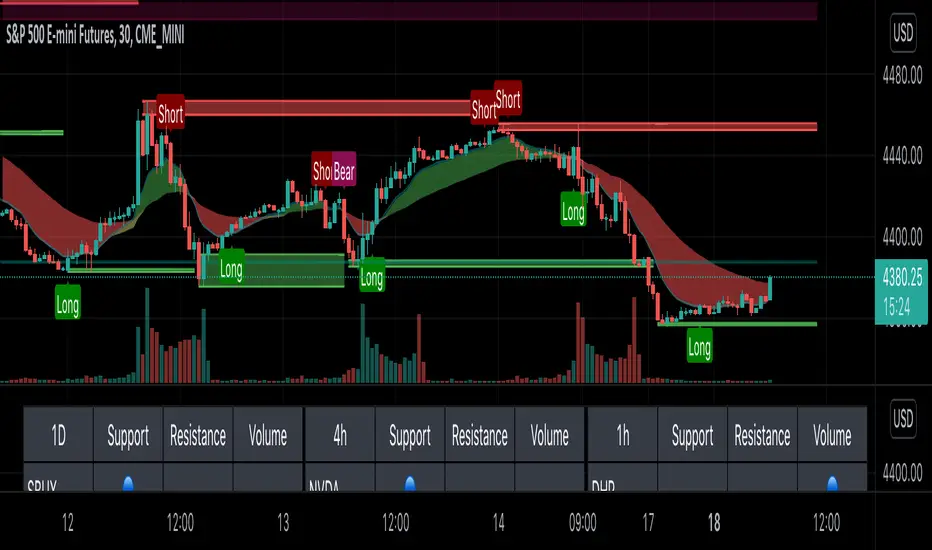
Effortless ScalpingEffortless Scalping is an indicator that primarily is used for stock options trading.
Effortless Scalping is based off of momentum. Our script takes into account the price action, volume, and historical data points of a stock to give potential "buy" and "sell" areas.
Effortless Scalping is a protected script because its Buy and Sell signals are based off of custom coded confirmations. This is what makes our script unique. We also have custom coded CHOP Filters in the indicator.
Effortless Scalping has a custom EMA line that flows with the trend of the market. It also changes colors to indicate a bullish or bearish trend . It also will change into a yellow color if the CHOP of the market exceeds your allowance. This EMA line is the only "classic" element of our custom coded script.
You can easily use Effortless Scalping by applying it straight to your chart. You can customize several visual effects in the settings menu.
Effortless Scalping also has two types of signals--RISKY signals and normal signals. Risky signals have a higher risk, but also a higher reward.
Effortless Scalping also features take profit levels based off of ATR levels.
Effortless Scalping also has custom support and resistance lines to better help you analyze the movement of a stock. These levels are based off of pivot levels.
Effortless Scalping can not predict the future move of a stock. Our script uses historical data points to alert POTENTIAL entries. These historical data points by NO MEANS predict the future movement of the market.
Effortless Scalping was created to help me understand the movement of a stock and why it may be moving in that direction. I personally found success using this script. I am sharing it because I am hoping that others find success in this script as well. I also like to trade quite frequently, and several times a day, so I made an indicator that is both accurate and alerts frequently.
This indicator does NOT provide financial advice. It is intended for general use only.
Moving Average Directional IndexMADX is ADX-inspired indicator with moving averages that determines strength of a trend, as well as its direction. Indicator works following:
As the value of MADX increases, so does the strength of a trend
If MADX+ ( green line - bullish MADX ) crosses above MADX- ( red line - bearish MADX ) we consider trend as bullish and vice versa..
There will be situations where MADX- and MADX+ cross multiple times in a short period of time -> that will mean that market indecision is happening and big move will most likely happen after it.
For the calculation of MADX+ and MADX- we need Moving Averages or Exponential Moving Averages with three specific sources ( high, close, low ).
Now, the calculation of each MADX will differ
=> for MADX+: Moving Average (high) / Moving Average (close)
=> for MADX-: Moving Average (close) / Moving Average (low)
Length of Moving Average is editable.

SUPPORT RESISTANCE STRATEGY [5MIN TF]A SUPPORT RESISTANCE BREAKOUT STRATEGY for 5 minute Time-Frame , that has the time condition for Indian Markets
The Timing can be changed to fit other markets, scroll down to "TIME CONDITION" to know more.
The commission is also included in the strategy .
The basic idea is when ,
1) Price crosses above Resistance Level ,indicated by Red Line, is a Long condition.
2) Price crosses below Support Level ,indicated by Green Line , is a Short condition.
3) Candle high crosses above ema1, is a part of the Long condition .
4) Candle low crosses below ema1, is a part of the Short condition .
5) Volume Threshold is an added confirmation for long/short positions.
6) Maximum Risk per trade for the intraday trade can be changed .
7) Default qty size is set to 50 contracts , which can be changed under settings → properties → order size.
8) ATR is used for trailing after entry, as mentioned in the inputs below.
// ═════════════════════════//
// ————————> INPUTS <————————— //
// ═════════════════════════//
→ L_Bars ———————————> Length of Resistance / Support Levels.
→ R_Bars ———————————> Length of Resistance / Support Levels.
→ Volume Break ———————> Volume Breakout from range to confirm Long/Short position.
→ Price Cross Ema —————> Added condition as explained above (3) and (4).
→ ATR LONG —————————> ATR stoploss trail for Long positions.
→ ATR SHORT ————————> ATR stoploss trail for Short positions.
→ RISK ————————————> Maximum Risk per trade intraday.
The strategy was back-tested on TCS ,the input values and the results are mentioned under "BACKTEST RESULTS" below.
// ═════════════════════════ //
// ————————> PROPERTIES<——————— //
// ═════════════════════════ //
Default_qty_size ————> 50 contracts , which can be changed under
Settings
↓
Properties
↓
Order size
// ═══════════════════════════════//
// ————————> TIME CONDITION <————————— //
// ═══════════════════════════════//
The time can be changed in the script , Add it → click on ' { } ' → Pine editor→ making it a copy [right top corner} → Edit the line 27.
The Indian Markets open at 9:15am and closes at 3:30pm.
The 'time_cond' specifies the time at which Entries should happen .
"Close All" function closes all the trades at 3pm , at the open of the next candle.
To change the time to close all trades , Go to Pine Editor → Edit the line 92 .
All open trades get closed at 3pm , because some brokers don't allow you to place fresh intraday orders after 3pm .
// ═══════════════════════════════════════════════ //
// ————————> BACKTEST RESULTS ( 100 CLOSED TRADES )<————————— //
// ═══════════════════════════════════════════════ //
INPUTS can be changed for better Back-Test results.
The strategy applied to NSE:TCS ( 5 min Time-Frame and contract size 50) gives us 60% profitability , as shown below
It was tested for a period a 6 months with a Profit Factor of 1.8 ,net Profit of 30,000 Rs profit .
Sharpe Ratio : 0.49
Sortino Ratio : 1.4
The graph has a Linear Curve with Consistent Profits.
The INPUTS are as follows,
1) L_Bars —————————> 4
2) R_Bars —————————> 4
3) Volume Break ————> 5
4) Price Cross Ema ——> 100
5) ATR LONG ——————> 2.4
6) ATR SHORT —————> 2.6
7) RISK —————————> 2000
8) Default qty size ——> 50
NSE:TCS
Save it to favorites.
Apply it to your charts Now !!
Thank You ☺ NSE:TCS

PIVOT STRATEGY [INDIAN MARKET TIMING]
A Back-tested Profitable Strategy for Free!!
A PIVOT INTRADAY STRATEGY for 5 minute Time-Frame , that also explains the time condition for Indian Markets
The Timing can be changed to fit other markets, scroll down to "TIME CONDITION" to know more.
The commission is also included in the strategy .
The basic idea is when ,
1) Price crosses above ema1 ,indicated by pivot highest line in green color .
2) Price crosses below ema1 ,indicated by pivot lowest line in red color .
3) Candle high crosses above pivot highest , is the Long condition .
4) Candle low crosses below pivot lowest , is the Short condition .
5) Maximum Risk per trade for the intraday trade can be changed .
6) Default_qty_size is set to 60 contracts , which can be changed under settings → properties → order size .
7) ATR is used for trailing after entry, as mentioned in the inputs below.
// ═════════════════════════//
// ————————> INPUTS <————————— //
// ═════════════════════════//
Leftbars —————> Length of pivot highs and lows
Rightbars —————> Length of pivot highs and lows
Price Cross Ema —————> Added condition
ATR LONG —————> ATR stoploss trail for Long positions
ATR SHORT —————> ATR stoploss trail for Short positions
RISK —————> Maximum Risk per trade for the day
The strategy was back-tested on RELIANCE ,the input values and the results are mentioned under "BACKTEST RESULTS" below .
// ═════════════════════════ //
// ————————> PROPERTIES<——————— //
// ═════════════════════════ //
Default_qty_size ————> 60 contracts , which can be changed under settings
↓
properties
↓
order size
// ═══════════════════════════════//
// ————————> TIME CONDITION <————————— //
// ═══════════════════════════════//
The time can be changed in the script , Add it → click on ' { } ' → Pine editor→ making it a copy [right top corner} → Edit the line 25 .
The Indian Markets open at 9:15am and closes at 3:30pm .
The 'time_cond' specifies the time at which Entries should happen .
"Close All" function closes all the trades at 3pm, at the open of the next candle.
To change the time to close all trades , Go to Pine Editor → Edit the line 103 .
All open trades get closed at 3pm , because some brokers don't allow you to place fresh intraday orders after 3pm .
NSE:RELIANCE
// ═══════════════════════════════════════════════ //
// ————————> BACKTEST RESULTS ( 128 CLOSED TRADES )<————————— //
// ═══════════════════════════════════════════════ //
INPUTS can be changed for better back-test results.
The strategy applied to NIFTY ( 5 min Time-Frame and contract size 60 ) gives us 60% profitability y , as shown below
It was tested for a period a 6 months with a Profit Factor of 1.45 ,net Profit of 21,500Rs profit .
Sharpe Ratio : 0.311
Sortino Ratio : 0.727
The graph has a Linear Curve with consistent profits .
The INPUTS are as follows,
1) Leftbars ————————> 3
2) Rightbars ————————> 5
3) Price Cross Ema ——————> 150
4) ATR LONG ————————> 2.7
5) ATR SHORT ———————> 2.9
6) RISK —————————> 2500
7) Default qty size ——————> 60
NSE:RELIANCE
Save it to favorites.
Apply it to your charts Now !!
↓
FOLLOW US FOR MORE !
Thank me later ;)

3c Ultimate reversal strategy With scanner and backtester v2This might just be the ultimate strategy to identify reversals.
This strategy includes a scanner, a backtester and ability to connect it with you 3 commas bot(See adviced settings below)
Strategy:
-Signals reversal that happened in the last bar. This signal DO NOT repaint.
-Identifies potential reversal that might happen in the current bar but can also not happen depending upon the timeframe closing price.
-The strategy combines the Moving Average Trend Changer, SuperTrend (ATR price detection) and ADX.
-It reduces the number of false signals in sideways market conditons and give more reliable trade signals.
-The signal does not repaint and can be used in any market condition. It determines the trend with high precision.
Take profit:
-Set 2 separate TP conditions.
-You can take profit using percentage, ATR, or RR(Risk Reward), aswell as using Trailing Take Profit.
- Use sell signal from the strategy(I often find way better results using that)
Stoploss:
-You can use either ATR, Percentage or sell signal from the strategy
(For now to let the strategy itself decide when to TP or SL, just set these parameters really high.)
Scanner:
-Identifies coins that are currently in the sell zone
-Identifies coins that are currently in the buy zone
-Screener explores up to 20 pairs in current graph's time frame.
-Optimize the strategy to your liking and use the built in backtester to see if it is a viable strategy.
3commas settings:
-For now you can only use simple bots.
-Create LONG and SHORT bots for the coins you like to trade and set up alerts(You can send long and short signal from the same alert)
-Set TP to 50% the strategy will handle buys and exits based on your inputs.
-Set safety orders to 0. I might add DCA to the strategy if testing proves that to be a good solution.
-When you have made the bots input the bot ID and token adress in the settings of the strategy.
-When creating the alert use this webhook :https://3commas.io/trade_signal/trading_view
-In the message field you use {{strategy.order.alert_message}} as the placeholder.
In the future this signal might make it to the 3commas marketplace. You can then subscribe to that signal where I have cherrypicked coins based on thorough backtesting and optimization.

Trade HourThis script is just finds the best hour to buy and sell hour in a day by checking chart movements in past
For example if the red line is on the 0.63 on BTC/USDT chart it mean the start of 12AM hour on a day is the best hour to buy (all based on
It's just for 1 hour time-frame but you can test it on other charts.
IMPORTANT: You can change time Zone in strategy settings.to get the real hours as your location timezone
IMPORTANT: Its for now just for BTC/USDT but you can optimize and test for other charts...
IMPORTANT: A green and red background color calculated for show the user the best places of buy and sell (green : positive signal, red: negative signals)
settings :
timezone : We choice a time frame for our indicator as our geo location
source : A source to calculate rate of change for it
Time Period : Time period of ROC indicator
About Calculations:
1- We first get a plot that just showing the present hour as a zigzag plot
2- So we use an indicator ( Rate of change ) to calculate chart movements as positive and negative numbers. I tested ROC is the best indicator but you can test close-open or real indicator or etc as indicator.
3 - for observe effects of all previous data we should indicator_cum that just a full sum of indicator values.
4- now we need to split this effects to hours and find out which hour is the best place to buy and which is the best for sell. Ok we should just calculate multiple of hour*indicator and get complete sum of it so:
5- we will divide this number to indicator_cum : (indicator_mul_hour_cum) / indicator_cum
6- Now we have the best hour to buy! and for best sell we should just reverse the ROC indicator and recalculate the best hour for it!
7- A green and red background color calculated for show the user the best places of buy and sell that dynamically changing with observing green and red plots(green : positive signal, red: negative signals) when green plot on 15 so each day on hour 15 the background of strategy indicator will change to 15 and if its go upper after some days and reached to 16 the background green color will move to 16 dynamically.

Days and Session
This indicator optionally displays 2 informations:
- The Day of the week
- The New session's Candle
You can turn off/on the displayed information
Disclaimer: Scripts that I post publicly are experimental. They are not financial advices. Always backtest your ideas using your own methodologies.

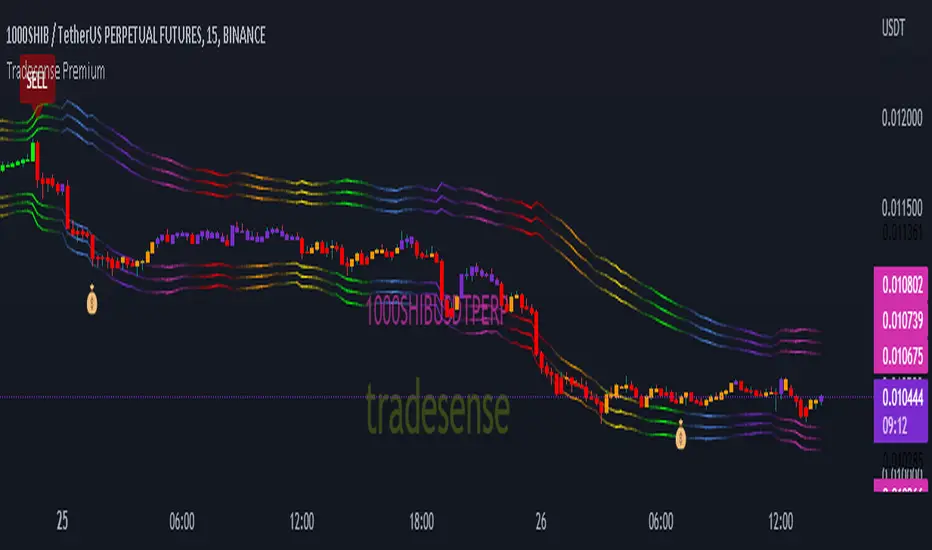
Tradesense PremiumTradesense Premium
Tradesense Premium indicator offers a buy & sell signal that is based from our senior analyst who have more than 10years of experience in Forex, Stock and Crypto trading and made it possible by our pine script developers.
Our script can detect market volatility based on the price direction and the absolute value of exponential moving average are multiplied to specific numbers to get a different trading style such as Scalper, Swing Trader and Trend Follower. We also filtered out all the signals using a different known indicators such as RSI, ATR, and ADX, and the results will allow you to enter a trade before the big moves occur. We also included all the important indicator which appears in real-time to get a competitive advantage in any market environment.
If you are a trader for a long time you should know that there is no way to avoid risk in trading. Every single trade could, theoretically at least, end up a loser. That is why our script also provides automatic risk management system which can gives you the ability to know exactly where to take the profit and to stop.
Trading style preset options - Will allows you to get the signals the way you wanted depending on your trading style. Ex. Scalper, Swing Trader or a Trend follower.
Bar color - Our bar colors are based on the price actions which detects the weakness of the bar or if the bar is ranging.
Reversal Zone - This indicator would identify possible price reversal zones.
Support & Resistance - This indicator draw a line at the pivot point to show possible support and resistance area.
Target Profit indicator based on price actions - This indicator will gives you an option to reduce your position or go out of the trade before the reversal happens.
Target Profit / Stop Loss based on ATR - This indicator will gives you a simple but effective risk management system to protect your capital. The TP/SL is based from the ATR.
Alert System - We are giving you an options to customize your alerts.
Our mission is to provide systematic way to build your success.
Release notes: Tradesense Premium V1.1
✅Trading style preset options
✅Bar color
✅Reversal Zone
✅Support & Resistance
✅Target Profit indicator based on price actions
✅Target Profit / Stop Loss based on ATR
✅Alert System
❓Trading style
Currently we have 3 sets of preset options that the user can use.
Scalp - this preset is made for the trader that wants a quick in and out of the trade. The best timeframe to this is 1min to 5mins chart.
Swing - this preset is for the trader who can wait a little bit longer in a trade. The best timeframe to use is 15mins to 1hour chart.
Trend - this preset is made for the busy people that can hold a trade more than a day. The best timeframe to use is 4hours to 1day chart.
❓Bar color
This options will change the color of your bars to lessen the noise of your chart.
Green Color is a bullish indicator
Red Color is a bearish indicator
Orange Color will signify that the trend is weakening
Purple Color is a consolidation/ranging price action
❓Reversal Zone
From the name it self, once the price is already hit the Reversal Zone the price will more likely to reverse or will make a correction.
❓Support & Resistance
When this option is enabled, the support and resistance levels will show up.
❓Target Profit indicator based on price actions
When this option is enabled, you will see a "💰" which means it's time to take profit or reduce your positions.
❓Target Profit / Stop Loss based on ATR
Most of the trader uses ATR as a stop loss level. When this option is enabled, the indicator for Stop Loss and Take Profit will show up and the TP/SL levels can be changed by changing the ATR Multiplier (Default is 1.8).
❓Alert System
Function alert is added and the user can customize it the way they want it.
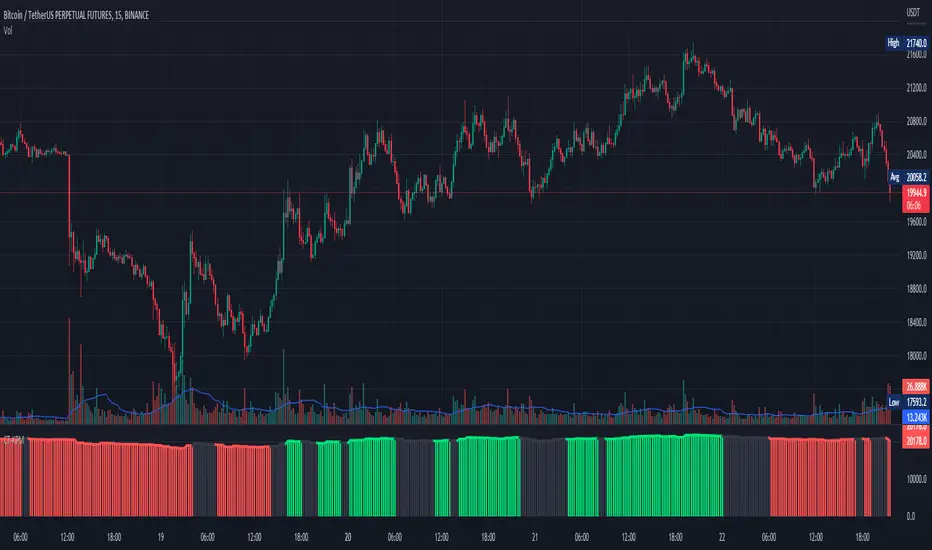
3C QFL Mean reversalWhat is QFL trading strategy?
QFL stands for Quickfingersluc, and sometimes it is referred to as the Base Strategy or Mean Reversals. Its main idea is about identifying the moment of panic selling and buying below the base level and utilizing Safety orders.
What is Base level or Support Level?
Base level or Support Level refers to the lowest price level that was reached before the moment the price started increasing again. At that level, you can notice that buyers of some cryptocurrencies make a strong reaction.
In this strategy we can also reverse the strategy and go short. But i must warn you that that is alot riskier.
QFL is meant to be used on higher TF's like 1hr, 2hr and 4hr. But this strategy also work well on lower Timeframes.
The script also simulates DCA strategy with parameters used in 3commas DCA bots for futures trading.
Experiment with parameters to find your trading setup.
Beware how large your total leveraged position is and how far can market go before you get liquidated!
Do that with the help of futures liquidation calculators you can find online!
Included:
An internal average price and profit calculating, instead of TV`s native one, which is subject to severe slippage.
A graphic interface, so levels are clearly visible and back-test analyzing made easier.
Long & Short direction of the strategy.
Table display a summary of past trades
Vertical colored lines appear when the new maximum deviation from the original price has
been reached
All the trading happens with total account capital, and all order sizes inputs are expressed in percent.

3C Crossover with TTP & TSLThis is not a set and forget strategy. It needs constant tweaking to maintain a high winrate. Also what works on one pair can be horrible on another.
This strategy works best on the 1 min or 5 min TF but also works well on the 15 min. Haven't done any testing in higher TF's as im only interested in scalping.
If enabled you can retrive data for the filters on any TF.
The strategy do not repaint.
You do not need a 3c subscription to run this strategy as the bot turns on and off the bot itself.
Instructions for the 3commas connector:
1. First, you need to prepare 3commas Long/Short bots that will only listen to custom TV signals.
2. Inputs for the 3commas bot can be found at the end of the user inputs.
3. Once you have entered the required details into the inputs, turn on 3commas comments. They should appear on the chart (looks messy).
4. Now you can add the alert where you should paste the 3commas Webhook URL: 3commas.io
5. For the alert message text insert the placeholder {{strategy.order.comment}} and delete the rest. 6. Once the alert is saved, you can turn off those 3commas comments to have a clearer chart.
7. With a new alert, the bot and trade should launch.
Long or Short trades are determined with a crossing of the fast MA over the slow MA for Long and the opposite for Short. By checking Close position on MA cross the deal will close on a crossover/under of the 2 MA's
You can select from various different MA's and of course lenghts. You can add both EMA filter on any lenght aswell as ATR to determine to go long or short.
Using the MA gap can help you to not enter trades in a low volatile ranging market.
The RSI filter, sets the maximum RSI threshold for a long position and the minimum for a short. By default and what i recomend is that you enter Longs when RSI is above 50 and shorts when RSI are below 50.
-You can set confirmation of the trade direction with RSI , i.e. for Long the RSI must rise a specified number of bars back, vice versa for Short.
Enabling the pullback filter is great to avoid Longing tops and Shorting bottoms.
Stop loss can be set be either a fixed percentage or by using ATR
Take profit can be set by using percentage, ATR or RiskReward ratio(RR). if you use ATR as a stoploss i recomend using RR as the TP.
Yu can choose to trail the TP with either Percentage or ATR
Whats ahead. I really want to incorporate RSI divergencies, but haven't figured out how yet. Any other ideas would be greatly appreciated.
Have a look at my other strategies. They are similar to this but works abit differently.

3C MACD & RSI Scalper no repaintThis is not a set and forget strategy. It needs constant tweaking to maintain a high winrate. Also what works on one pair can be horrible on another.
This strategy works best on the 1 min or 5 min TF but also works well on the 15 min. Haven't done any testing in higher TF's as im only interested in scalping.
If enabled you can retrive data on the MACD and RSI from any timeframe.
The strategy do not repaint.
You can filter on sessions as well as days. Often trading during say only the EU times and not trading during weekends yields better results. This is because weekeds and eg. the Asia Sessions are alot less volatile.
You do not need a 3c subscription to run this strategy as the bot turns on and off the bot itself.
Instructions for the 3commas connector:
1. First, you need to prepare 3commas Long/Short bots that will only listen to custom TV signals.
2. Inputs for the 3commas bot can be found at the end of the user inputs.
3. Once you have entered the required details into the inputs, turn on 3commas comments. They should appear on the chart (looks messy).
4. Now you can add the alert where you should paste the 3commas Webhook URL: 3commas.io
5. For the alert message text insert the placeholder {{strategy.order.comment}} and delete the rest. 6. Once the alert is saved, you can turn off those 3commas comments to have a clearer chart.
7. With a new alert, the bot and trade should launch.
Long or Short trades are determined with a crossing of the fast MA over the slow MA for Long and the opposite for Short. Trades should only happen close to the crossovers.
You can select from various different MA's and of course lenghts. I often find that using HEMA as the fast MA and DEMA as the slow give more trades while also maintaining a high winrate.
Then for Long we use the MACD indicator where we look for high peaks in negative values for Long and vice versa for Shorts. These should be significantly higher than other peaks (or if you will lower peaks for a Long).
The key is to detect high peaks on the histogram, which we will try to achieve by checking if the last 2 values were higher than X bars back. If you want to make it even more specific, then you can turn on the additional checkbox which compares the current value to the average value of X bars back, and if it is greater than, say, 72% the value of the average then it's ok to enter the trade.
The RSI filter, sets the maximum RSI threshold for a long position and the minimum for a short. By default and what i recomend is that you enter Longs when RSI is above 50 and shorts when RSI are below 50.
-You can set confirmation of the trade direction with RSI, i.e. for Long the RSI must rise a specified number of bars back, vice versa for Short.
Enabling the pullback filter is great to avoid Longing tops and Shorting bottoms.
Whats ahead. I really want to incorporate RSI divergencies, but haven't figured out how yet. Any other ideas would be greatly appreciated.
Have a look at my other strategies. They are similar to this but works abit differently.
The 3 strike line and the engulfing candles are not something that has an impact on the script yet, and might never be. But i do like to turn them on for a visual to see if the trade the strategy opened is a good one.

God Number Channel V1 (GNC V1)Channel, made of 5 MAs, which a made this way: High of N-period SMA - Low of N-period SMA + X-period SMA (check the code), where N and X are defined by your input.
Main purpose: helps you understand in what range price can move.
WARNING!
HAS TO BE USED WITH OTHER INDICATORS TO HAVE MORE ACCURATE ENTRIES!!!
If the price is above or below the channel, it means that the movement is very strong and you count it as a trend, but be careful then the price returns to the channel, as correction will follow very soon. Use fib correction tool to understand the approximate depth of correction, works pretty good.
Recommendation: consider using the Vortex Indicator( len 21 and 14 are fine; for trend) and "Vumanchu Divergencies + B"(for anything, but calibrate for accuracy, otherwise there will be too much false signals). If you want to see more options where the price might go, just add new MA and add/substract to/from its value avg1*(any of fibonacci correction levels, I personally use 1.618 and 2.618 and for me it is ok): plot(show_ma1 ? ma1+( [ [ ]]]*avg1) : na, color = ma1_color, title="MA №1")
Recommendations and feedback are welcome(!)
Take your wins

Crypto_Troll_Turtle_StrategyTurtle Strategy for high marketcap cryptocurrencies
I'm glad to launch my strategy which is based on
moving averages / bollinger bands / RSI and volume
It's basically made for scalping with an interesting return over the last two years and a perspectively low drawdown
if you're interested in the strategy and you want to use it for futures trading you can contact me for a money & risk management rules that you can use and prevent you from a huge loss !! it's for free don't worry xD you can find my contact in the author's instructions' label
The optimal timeframe to use is 1H
I'll be trying to launch telegram signals for this strategy as soon as possible for the following pairs: BTCUSDT ETHUSDT BNBUSDT timeframe: 1H
I'm open to all reviews ! thanks !

Current Trend [KPM] - Buy / SellYou can filter the trend with this indicator. Green Lines indicate a short-term up trend and Red lines indicate a short-term downtrend. and black lines indicate short-term consultation.
I'm not regarding anything with this indicator. All risk is yours
Thank you
Scalping Alice 3/5INTRO
Scalping Alice is a work in progress. I made it to help with my Scalping Long strategy as a helper for entrances.
This instance of the indicator is for 3min and 5min chart analysis only.
It still needs to further adopt and calibrate multi-frame data, but for the moment it takes from the Daily, the Hourly and the 15min.
It is meant to be used WITHOUT candles. This is because, one of the goals I'm trying to achieve is to compress data and leave out unwanted noise.
The 3min and 5min candles are very dynamic (specially in the crypto market), so I don't need to know the whole OHLC, but I do need a range.
COMPONENTS
Small Blob
The first component is the current time-frame Price Blob. The top line is the candle Highs and the bottom line is the candle Lows.
The Price Blob's Color changes according to a Double RSI which you can modify the values for.
The default is 13 for the Fast RSI and 34 for the Slow RSI.
When the Fast RSI is on top it turns Green. When the Slow RSI is on top it turns Red.
Big Blob
The Outer Blob is the same as the inner blob, but in the 15min time-frame. It changes color the exact same way, but with 15min values.
WMA Line
The closest line to the blob is the WMA line. You can change the default value, which is 21.
The color changes according to a complex modifier, that I will try to explain, but most likely fail.
It takes a sort of Tenkan (see Ichimoku Cloud if you don't know what a Tenkan is) value from the 15min chart and the Hourly chart.
It then compares the difference from these Tenkans and adds it to the 15min mid price.
And finally tries to find a fast Trend of the movement of the price for the last 3 candles.
The Tenkan value can be changed from it's default 3. Be wary, this changes the Tenkans for all the timeframes.
Blue Tenkan
The slower line is an Hourly Tenkan but with a value of 9.
Saturation Clouds
The last piece are the orange Saturation Clouds. These appear in bigger price movements and work weirdly.
They are differences between Hourly Tenkan and current frame Tenkan, along added to the mid point of the price and a little bit of Bollinger math.
Again, hard to explain, but they are very useful. Maybe one of the most useful parts of Alice.
BULL AND BEAR
Bullish :
- Green Small Blob
- Green Big Blob
- Green WMA
- Small Price Blob Above WMA
- Small Price Blob Above Blue Tenkan
- Small Price Blob Inside Upper Saturation Cloud
- Lower Saturation Cloud appears but DOES NOT touch Small Price Blob
Bearish
- Red Small Blob
- Red Big Blob
- Red WMA
- Small Price Blob Below WMA
- Small Price Blob Below Blue Tenkan
- Small Price Blob Inside Lower Saturation Cloud
- Upper Saturation Cloud appears but DOES NOT touch Small Price Blob
SMALL TIPS
Saturation Clouds
When the Saturation Clouds appear, it is an indication of strong price decision.
If it appears but it is far from the Small Blob then this indicates Price Reversal.
Most likely a nice moment to enter an opposite trend trade.
If the cloud appears touching the Small Blob and the Small Blob enters the cloud, this is Trend Confirmation.
The price is going to go strongly towards the Trend is is on.
Most likely a nice moment to enter an accompanying trend trade.
Price Bounce
The Small Blob bounces inside the Big Blob. This is very useful for numerous short plays.
You have better chances opening longs when the price is on the Lower parts of the Blobs.
The same goes for shorts on the Upper Parts.
Slow and Fast
The color of the WMA is a very fast indicator, it's the least reliable one.
Then comes the Small Blob color, then comes the WMA itself.
Following that you have the Big Blob color, then the blue Tenkan.
And finally the Saturation Clouds are the most reliable part.
FINAL THOUGHTS
This is a publishable version of this strategy. I hope to keep working on these types of strategies, maybe even upgrading this one.
Enjoy, share and leave comments!

Camarilla Pivots - Signals, Alerts, TP and SL by Tech Store OnThis is a Camarilla Pivots indicator script, which will show signals, take profit and stop-loss on the chart with alerts based on Camarilla Pivot strategies:
LONG signals: S5 > S4, TP1: S4, TP2: S3, TP3: R3 SL: Manual | S3 > R3, TP1: R3, TP2: R4, TP3: R5, SL: S4 | R4 > R5, TP1: R5, SL: R3
SHORT signals R5 > R4, TP1: R4, TP2: R3, TP3: S3, SL: Manual | R3 > S3, TP1: S3, TP2: S4, TP3: S5, S4 > S5, TP1: S5, SL: S3
Mainly, the script is based on the pivot levels and price action. The script will trigger a signal if a supporting direction candle breaks or bounces at certain pivot, triggering a direction of the potential trade with the next pivot serving as a Price Target area, each signal will potentially wait for 3 Price Target areas and if they happen will show each on chart. An opposite direction pivots are used as a Stop Loss, which the indicator will show on the chart. If stop-loss will be hit, the script will not show take profit areas considering the trade is closed with a loss. Same way if take profit area 1 is reach, it is considered that SL is moved to Entry and therefore the script will no longer show stop-loss for that trade. This indicator was mainly tested via 15min timeframe, but feel free to try different timeframes as the concept is the same.
This strategy was extensively manually tested, trade by trade, with S&P 500 ETF 15min timeframe, for back-testing results for the whole 2021 year (this is simply if you would LONG/SHORT stocks, don’t forget that if you trade Options, there is also Theta present (options price decay over time), the win rate is: 86.12%
*** If a trade was uncertain > it was marked immediately as stop-loss
*** A position was always closed at the end of the day no matter what (profit/loss)
Config: Alerts need to be set for each signal, take profit and stop-loss, it is pretty much self-explanatory, just right click the chart, select “Add alert” > next to Conditions select “Camarilla Pivot…”, for each trade signal and stop-loss, make sure it is “Once per Bar Close” and for each take-profit make sure it is “Once Per Bar”. Stop-losses are confirmed price breaks, while take-profits – we just need to touch those pivots.
Config: By Default, indicator signals are given during regular BEST (after 3PM ET – it’s power hour, which often is unpredictable + market will be closing soon) US standard market hours: 9:30AM-3PM ET, take profit and stop-losses by default are set to 9:30AM-4PM ET (US standard market hours. Both can be adjusted via Inputs. If you wish for the signals/take profit and stop-losses to be tracked 24/7 > choose the “EMPTY” space for both.
Config: Number of candles/bars to track back for opened positions is the number of Candles/Bars tracked back for each position. You can change this setting as it relates to timeframe versus trading style (day trading/swing), play around to find your best settings, by default it’s 13, which is best for day trading/15M timeframe. Please note: if position takes “too long” to reach TP or SL, it may not show TP or SL, so you need to keep an eye on this. It is best to use slightly lower number for day trading, because otherwise if you receive the same signal more than twice during the day > it will not show TP or SL for the second/third/etc. position. This is custom for you to change though, so if you want longer position tracking for the day, choose: 26 candles (this is the amount of 15M candles during the day), but keep in mind that for second/third position > it may not show you the TP1/SL.
Config: The table showing positions will show current open position on the bottom cell if position is opened per indicator, you can move or even hide this table in the indicator settings. (Please note: this is decorative thing and sometimes may show a position open, which is not actually open, especially when the market is not currently open).
Tip: Note: if pivots are too far away from each other and there is either big profit already or another support/resistance indicator (VWAP, SMA, support & resistance levels, etc.) – it is wise to take some profit off and move SL to Entry to secure profits in case market decides to turn around. This is especially wise if you trade Options as they include Theta (options price decay over time). Please note: back-test results displayed above were done without VWAP.
Tip: R5 > R4 and S5 > S4 are riskier signals as there are no pivots above/below for the SL, the script does not have a built-in stop-loss level/indicator for these, so you will need to manually set your stop-losses for these signals. Last day pivots often can help with this or simply use most recent support & resistance levels.
Tip: If trading S&P: be careful opening positions near 3PM ET, as during the “power hour” – 3-4PM ET > volatility increases and direction of the price becomes much more unpredictable. Similar: if you are in profit, it is wise to close the majority of your position at 3PM ET, before the “power hour” starts.
Tip: Very conservative trading approach: after signal happens, wait for a bounce back (price going back touching the pivot) and open position right there, that way > SL will be smaller and better risk/reward ration.
Tip: There is no limit on how many signals the script will show if it meets the conditions (in case you miss one of the signals and conditions repeat > you can still get into decent trade at next signal if it matches the condition).
Note1: if candle closes crossing/breaking several pivots at the same time and that same candle will touch take profit pivot – the script is configured to minimize showing/alerting signals/TP/SL for such conditions, so that you don’t get a very dirty chart / spammed with alerts, however sometimes it may or may not show signals and/or take profits/losses incorrectly. Overall, when you see such huge candles, it means that market volatility is bigger than usual, so a caution should be practiced.
Note2: If the signal candle almost nearly touches the first take profit area > it’s best not to open a position (you literally opening it at the first take profit pivot, and it may bounce the other way from that same pivot).
Note3: You may sometimes see take profit/stop-loss indicators in the beginning of the day or simply when pivot levels change, this is due to script registering the position open per old pivot levels and then show you take profit/stop-loss per new pivot levels.

FCPO IntradayThis script is specially developed for the reference of Crude Palm Oil Futures ( CPO ) market traders.
Before using this script, traders need to know a few important things, namely:
1. Use of this script is limited to the Crude Palm Oil Futures ( CPO ) market only;
2. The appropriate time-frame for the purpose of using this script is 30 minutes.
Procedures for using indicators.
1. The line on the trading day will only be known after the first candle is completed, i.e. at 10:59:59 am;
2. Then, key in order.
Entry.
The recommended max Entry is once Long and once Short only on the same day.
Long.
1. Traders can only make a purchase when the market price hits the green line;
2. If traders hold a long position, traders can make a sale to close the long position when the price hits the blue line.
Short.
1. Traders can only make a sale when the market price hits the red line;
2. If traders hold a short position, traders can make a purchase to close the short position when the price hits the orange line.

ATR and IV Volatility TableThis is a volatility tool designed to get the daily bottom and top values calculated using a daily ATR and IV values.
ATR values can be calculated directly, however for IV I recommend to take the values from external sources for the asset that you want to trade.
Regarding of the usage, I always recommend to go at the end of the previous close day of the candle(with replay function) or beginning of the daily open candle and get the expected values for movements.
For example for 26April for SPX, we have an ATR of 77 points and the close of the candle was 4296.
So based on ATR for 27 April our TOP is going to be 4296 + 77 , while our BOT is going to be 4296-77
At the same time lets assume the IV for today is going to be around 25% -> this is translated to 25 / (sqrt (252)) = 1.57 aprox
So based on IV our TOP is going to be 4296 + 4296 * 0.0157 , while our BOT is going to be 4296 - 4296 * 0.0157
I found out from my calculations that 80-85% of the times these bot and top points act as an amazing support and resistence points for day trading, so I fully recommend you to start including them into your analysis.
If you have any questions let me know !

Hulk Strategy x35 Leverage 5m chart w/Alerts This strategy is a pullback strategy that utilizes 2 EMAs as a way of identifying trend, MACD as an entry signal, and RSI and ADX to filter bad trades. By using the confirmation of all of these indicators the strategy attempts to catch pullbacks, and it is optimized to wait for high probability setups. Take not that the strategy is optimized for use on BTCUSDT along with 35 times leverage(Using leverage is risky). The Hulk Strategy waits for strong trend confirmation and then attempts to identify pullbacks using MACD and RSI. By using these it identifies strong short term movement against the trend(hence the name Hulk). To use the strategy wait for the strategy to make an entry, and then enter with a stop loss of 1.1% and a take profit of 1.35% with respect to if it is a long or short position. The trade frequency of this strategy is high as it is made for use on the 5m timeframe. But this does not mean you will have to be staring at your computer constantly as an average of 1 trade takes place each day. This will vary a lot though, somedays the strategy enters up to 4 times. I wish you good trading and hope that you like this strategy!
P.S. The indicators on my chart are visualizations of the indicators used in the strategy, they are not necessary for the strategy to work though. Also the colored in cloud on the price chart is an EMA cloud and it comes with the strategy when you add it to your chart. This EMA cloud consists of two EMAs a 50 and a 200 EMA.

EMAs Daily ResetThis indicator displays 3 EMAs that recalculate every day.
This is useful for intraday trading by removing the bias of the previous day's ema price. This ensures your EMAs stay near the most current price action.
Note: If your length is larger than the number of bars in the day, your EMAs will not have time to properly catch up in the day.
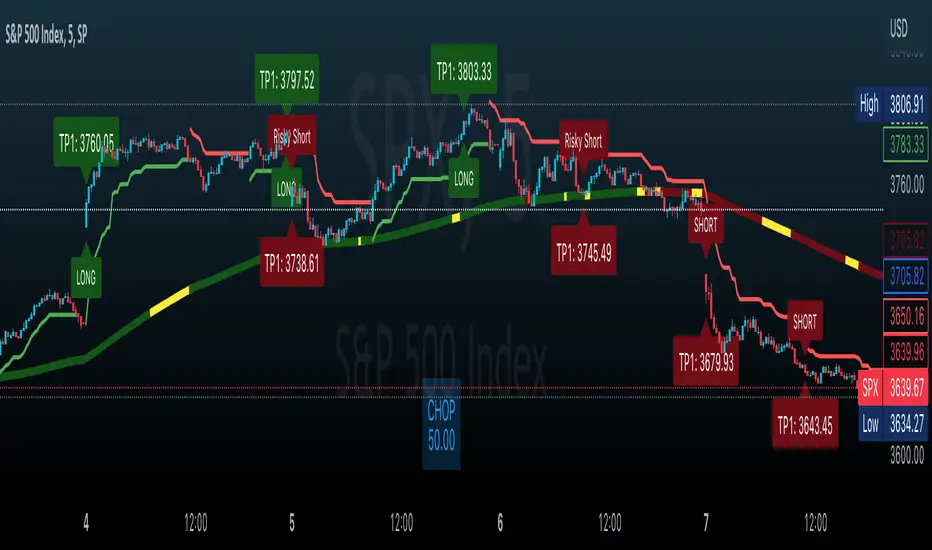
Clutch AlgoThe Clutch Algo provides reversal signals and trend signals. The indicator can be used for stocks, crypto and forex. It can also be used for day trading and swing trading.
Reversal signals were done by modifying the Bollinger Bands and MACD and combining them in a unique way to find explosive price actions. These have been modified to provide signals at the bottom or top of a trend to catch price reversals and to improve margin of safety on trades. These signals are labeled as “Long” and “Short”.
We also added automatic support and resistance zones to increase the accuracy of the “Long” and “Short” signals. This was done by using historical price action of highs and lows and periods of consolidation where price reversed.
The trend signals, which are labeled as “Bull” and “Bear” signals use a combination of exponential moving averages. These signals can be used as trend continuations.
We also added an exponential moving average cloud to help traders easily visualize trend. This can be used as a guide to help you stay in a trade to maximize profits. It can also be used as a guide to get out of a trade if price breaks out of the cloud. The third use of the cloud can be used as support resistance in between high/low support and resistance zones.
Tips:
- Only take long/short signals when there is a support or resistance zone formed at or near the long/short signal, preferably within 1-3 bars of the support or resistance zone. Signals too far from "Long" or "Short" signals reduces your margin of safety.
- When in a Long or Short position, use support or resistance zones as a stop loss level as price is likely to go against the position.
- When taking a Long/Short or Bull/Bear signal, wait for candles to be completed to get best entry possible.
- Previous support zones can be used as resistance zones and previous resistance zones can be used as support zones.
- The support and resistance (SR) period can be adjusted. Numbers in the SR settings are bars looking back. For example, a setting of 10, looks back 10 bars.