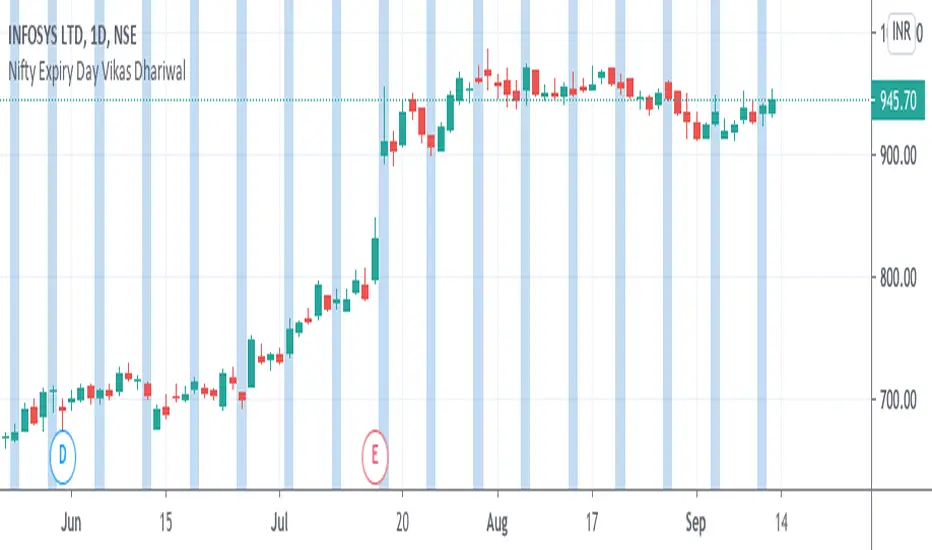
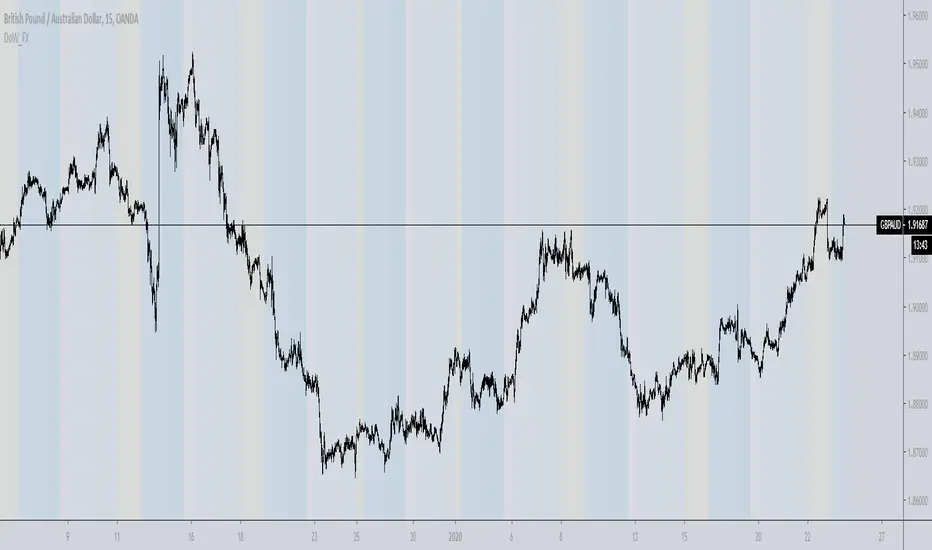
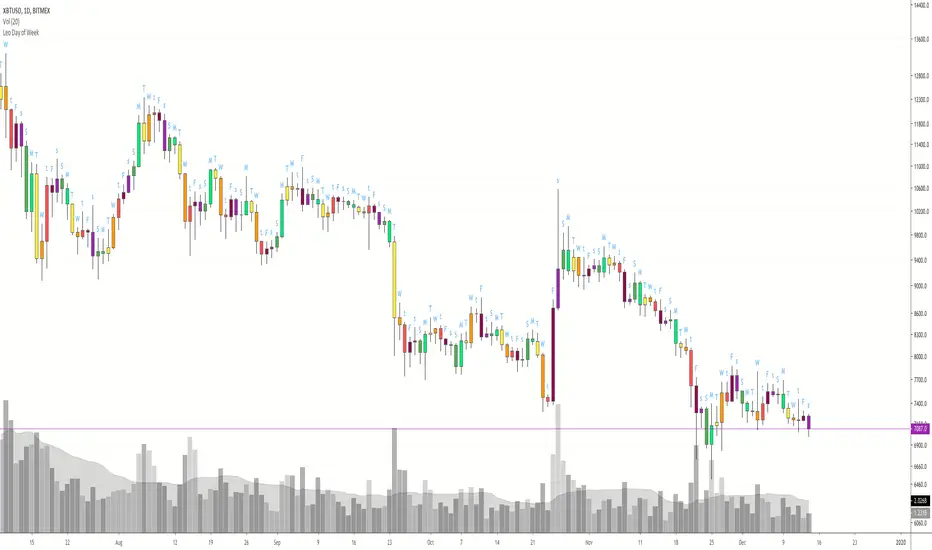
GÜN
Günlük Al Sat Stratejileri / Day Trade StrategyMerhaba bu script ile günlük veya uzun vade için alım satım yapacağınız coinleri takip edebilirsiniz.DayTrade scriptini RSI ve MACD indikatörü ile beraber kullanırsanız daha net sonuçlar alırsınız.
Günlük alım satım yapacaksanız 5dk, 10dk ve 30dk periyotlarında coinlere göz atmalısınız.
Raven/Btc 15dk grafiği inceleyelim.DayTrade scriptini kullanırken sarı çizgi maviyi yukarı kestiğinde yükseliş başlangıcı olduğu için coini Al Aşağı keserse Sat.Tabiki bu scripti tek başına kullanmaktan ziyade RSI ve MACD indikatörü ile beraber kullanırsanız daha net sonuçlar alırsınız.Örnek bir resim ekleyeyim.
Görüldüğü üzere kırmızı ile işaretlediğim bölgede sarı çizgi yukarı kestiği halde rsı ve macd alım için net sonuç vermiyor.Yeşil bölgede ise DayTrade scripti, Rsı ve Macd alım sinyali veriyor ve coini alıyoruz.Sarı çizği mavi çizğiyi aşağı doğru kestiği zaman satış yapıyoruz.Tekrar yukarı kestiğinde alım yapılmalı.
RVN/BTC 1D grafik
350 satoshiden alınan Raven coin 1500 satoshiden satıldı.
Bittimi tabiki bitmedi :)
Sizi bilgisayar başında beklemekten kurtaran bir yöntemden bahsedeceğim.İstediğiniz zaman aralığında coini takip etmek istiyorsunuz ama sürekli pc başında beklemek istemiyorsanız kesişmelere alarm kurabilirsiniz.
Alım ve satım sinyallerinde hem bilgisayardan hemde tradingview uygulamalası üzerinden bildirim alabilirsiniz.
Üst paneldeki Saat işaretine tıklayın.5dk zaman dilimine göre alarm kuruyorum.Her kesişmede alarm çalacak ve uygulamayı kullanıyorsanız bildirim gelecek.Siz kaç dk takip etmek istiyorsanız ona göre alarm kurabilirsiniz.
Açılan penceredeki ayarları bu şekilde yapın
Herkese bol kazançlar.Bu sayede kazanç sağladıysanız kazancınızın bir kısmı ile düzenli olarak yardıma muhtaç insanlara yardım etmeyi unutmayız.
Faydalanılan kaynaklar www.tradingview.com
B3 FisherTransform TraderB3 Fisher Transform Trader ~ As you may have found, Fisher Transform (FT) is not an easy beast to tame. However, I have never seen an indicator so consistently early to a move, so, I had to pry into it some more. I tend to stick with indicators that work on many symbols and time-frames, but FT isn't one of them. For starters, I only had a small amount of success in back-tests and only with stocks not futures. I did find however that when set to 9-10 and tightly trailed with a signal average and then put to a intermediate chart like 2h to day bars, it seems to have a nice sweet space in back-tests. I found this to work in multiple platforms, and after plenty of testing, I came up with a few personal tweaks to the indicator. Then walking forward the tests have played out like the back-testing, which is key!
Each symbol you trade will have a sweet spot bar interval in that intermediate area, so long as you keep the input setting to 9-10 for the FT and 2-3 for the signal average length. You are welcome to test well beyond these parameters . :)
Here is a quick view of the success the system has had trading AAPL in binary long or short at all times fashion over the last 10 years.
virtuosotrader.files.wordpress.com
~B3
Higher Timeframe EMAThis script plots a higher timeframe EMA to your chart.
You can specify the timeframe and the length of the EMA in the settings.
This chart demonstrates the 5-minute 50EMA (black) combined with the 1-hour 50EMA (colored) on the 1 minute timeframe.
400 Day Simple Moving AverageAlways shows the 400d simple moving average, regardless of currently-shown timeframe.
Session RangeSimple script for showing the high/low/midrange of a session. By default configured to do the Daily range using the "regular" session. But it's configurable. For example on this chart I am showing the Weekly range.
Day25RangeDay25Range(1) - Plot on the candle the 25% low range of the daily price. This helps to show when the current price is at or below the 25% price range of the day. Best when used with other indicators to show early wakening strength in price. On the attached chart, if you look at Jan 23, 2018 you will see a red candle that closed below the 25% mark of the trading day. For that day the 25% mark was at 38.66 and the close of the day was at 38.25 That indicators a potential start of a strong swing trade down. A second signal was given on Jan 25, 2018 when a red candle closed (37.25) below the 25% mark (38.08) again. Within the next few days a third weak indicator signaled on Jan 30,2018 with a close (35.88) below the Day25Range (37.46). price continued down from there for the next 4 days before starting to reverse. If the price closes below the 25% daily range as shown on the Day25Range(1) indicator, this could indicate a possible start of weakening in the price movement.
Day25RangeDay25Range(1) - I use this indicator to show where the lower 25% daily range of a stock is. This helps to show weakness in a stock during the trading day. I use this indicator with a CIRCLE or DOT plotted on the candle. Makes it easy to show weakness during the trading day.
Day75RangeDay75Range(1) use to plot the 75% range of a trading day. I use a CIRCLE or DOT to indict the 75% range of the trading day.
DynamicSR DTI: Auto Support and Resistance AreaThis works only on charts with real volume...if it does work
Inside Bars Multiple Time Frames ColorHello, this is just a script that helps to identify "inside bars" on the current time frame or a higher one, by coloring them with the selected color.
Kaufman Adaptive Moving Average (day)The KAMA will not change when the interval changes from day to something like 5 minutes or 30 minutes. Allows for more precise trading with the same indicator on a different interval.