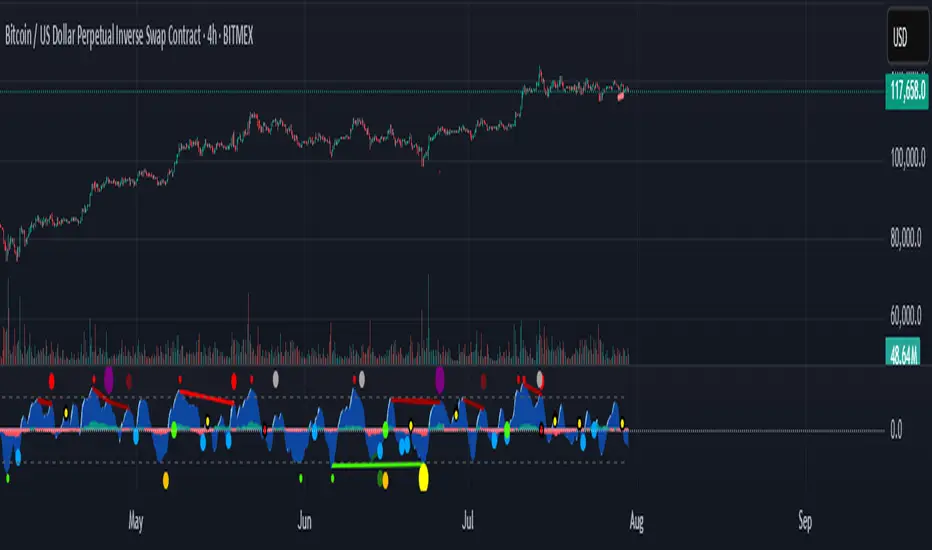
CUO WITH BLUE BULL// Core Ultra Oscillator (CUO) with Blue Bull
//
// The Core Ultra Oscillator (CUO) is a technical analysis tool designed to identify potential trend reversals and breakout opportunities by combining momentum, volume, and divergence analysis.
// It aims to enhance divergence-based trading by incorporating additional filters to reduce false signals during strong market trends.
// The indicator integrates WaveTrend Oscillator, regular volume and Cumulative Volume Delta (CVD), generating unique divergence signals enhanced with trend filters to allow greater flexibility in trading style and market type.
//
// Key Features:
// - WaveTrend Oscillator: Plots momentum with customizable overbought and oversold levels, displaying buy (green dots) and sell (red dots) signals for prints in extreme zones.
// - Divergence Detection: Identifies regular and hidden bullish/bearish divergences on WaveTrend and CVD, using green/red lines to connect fractal points for potential trend reversals.
// - Cumulative Volume Delta (CVD): Measures buying and selling pressure with smoothed, normalized delta, enhanced by trend and slope filters for signal reliability.
// - Trend Shift Dots:
// - Green White Dot: Indicates the end of a bearish CVD trend, suggesting a potential bullish shift.
// - Black Dot (Red Center): Signals the end of a bullish CVD trend, indicating a potential bearish shift.
// - Seven Unique Dot Signals:
// - Blue Dot (Blue Bull): Highlights potential bullish breakouts based on accumulated momentum.
// - Yellow Dot (Gold Extreme Buy): Marks potential buying opportunities near market bottoms, often following an amber dot.
// - Purple Dot (Extreme Sell): Identifies high-probability sell signals using divergence and trend weakness filters.
// - Black Dot (Yellow Center): Targets first sign of weakness after a strong bullish trend ends, aiming to capture significant selloffs.
// - Dark Blue Dot: Signals peaks in oversold regions after a bullish trend has ended and momentum has flipped towards the bears.
// - Dark Grey Dot: Warns of potential tops via CVD bearish divergences, ideally confirmed with Purple Dot or regular divergences.
// - Amber Dot: Indicates potential bottoms via CVD bullish divergences, to be confirmed with Yellow Dot or regular divergences.
// - Comprehensive Alerts: Includes 15 alert conditions for WaveTrend, CVD, and dot signals to support real-time trading decisions.
//
// How to Use:
// - Apply the indicator to any chart to monitor momentum, volume, and divergences.
// - Adjust Trend momentum, WaveTrend, CVD, and trend thinning parameters through input settings.
// - Use dot signals and divergence lines to time trade entries and exits.
// - Configure alerts for real-time notifications of key signals.
//
// Note: This indicator is for informational purposes only and does not constitute financial advice. Users are encouraged to backtest thoroughly and evaluate the indicator’s performance in their trading strategy.
CVD
TradingIQ - OrderFlow IQIntroducing “OrderFlow IQ”
OrderFlow IQ is an all-in-one order-flow and volume-profiling suite crafted to bring true market microstructure to your TradingView charts. It bundles footprints, per-bar and intra-bar delta analytics, class-based delta tracking, adaptive volume profiles, bubble-style trade tapes, live time-and-sales feeds, cumulative-volume fight meters, iceberg detection, and more—all driven by a single, user-friendly interface.
Features
The list below details an ever=expanding list of the indicators capabilities; more to come in the future!
Tick-based Footprints
Imbalance and stacked imbalance detection
Tick-based chronicled volume profile
Delta classification (small order, medium order, and block order delta)
Tick-based order flow bubble tape
Live order feed with total buying volume against total selling volume
Tick-based CVD
Iceberg order detection
Delta class lines
Tick-based bar statistics
Key Components and Their Functions
Data Granularity
• 1-Tick / 1-Second / 1-Minute modes let you choose the resolution of every calculation. On true tick charts you get genuine tick-by-tick precision; on second charts you see every intra-second print; on anything else it falls back to minute bars.
Footprint Engine
Bid vs Ask Volume Columns – Each candle is sliced into tick-level price rows showing buy-volume, sell-volume, total volume, delta and delta%.
CVD-Level Columns – Optionally color each row by net cumulative delta instead of raw volume to spotlight buying or selling pressure trends.
Imbalance Detection – Highlight rows where one side exceeds your % threshold, with “stacked” imbalances calling out multi-row alignment ahead of potential breaks.
Value Area & POC – Automatically compute and draw the 70% value area (VAH/VAL) and mark the Point of Control per session or any chosen timeframe.
Footprint
The image above shows the volume profiling data calculated for each row across the footprint engine.
Delta: Shows the net difference between buying and selling
Delta Percentage: Calculates delta as a percentage of total volume
Total Volume: The total volume at the price block
Buy Volume: The total buying volume at the price block
Sell Volume: The total selling volume at the price block
Additionally, you can select to only show buying volume and selling volume at each price block, as shown in the image above.
POC
The image above shows the visuals used to mark the POC of the footprint. The POC is marked yellow by default; the color can be changed in the settings.
Value Area
The image above shows the visuals used to mark the value area of the footprint.
Imbalance Detection
The image above shows the Footprint Engine detecting and marking buying/selling imbalances.
Stacked Imbalances
The image above shows the Footprint Engine detecting and marking stacked imbalances. Stacked imbalances are shown as consecutive, small blocks to the right of the footprint.
CVD Levels
The image above shows the footprint engine calculating CVD across the footprint, rather than net delta that resets bar by bar. Traders can enable the "Use CVD Levels" setting to have net delta persist across price bars, allowing traders to see the net CVD across various price blocks as the footprint develops.
Delta Class Statistics
With the inclusion of tick volume, The Delta Class Statistics component of the indicator classifies volume delta by order size to give traders detailed insights into whether small players are buying/selling and whether big players are buying/selling.
The image above shows a full view of the Delta Class Statistics feature.
The image above further explains the Delta Class Statistics view.
Orders are distributed (classified) across various order size amounts. From here, a rolling CVD is calculated across each order size. This feature gives traders detailed insights into whether big money is buying/selling (big player sentiment) and whether small money is buying/selling (small player sentiment).
Analysis
The image above shows a net-negative CVD for the session for both small orders (small money) and big orders (big money), while "medium" sized orders are currently at a net-positive CVD.
Consequently, sentiment for big players is bearish.
Additionally, small triangles are printed alongside each Delta Class box for each bar. You can hover over these labels with your cursor to see the net delta for the bar for each order size.
Bar Delta Statistics
With the inclusion of tick data, OrderFlow IQ is designed to generate detailed tick-based bar statistics for each candlestick.
The image above shows the feature in action.
Metrics
Volume: Total volume for the bar
Bar VWAP: The individual bar's VWAP
Delta: Net delta for the bar
Delta %: Delta % of the bar
Max Delta: The maximum positive delta achieved during the bar
Min Delta: The lowest negative delta achieved during the bar
CVD: Cumulative volume delta measurement by the bar
Buy Volume: Total buying volume for the bar
Sell Volume: Total selling volume for the bar
Iceberg Detection (Tick-Data Only)
An Iceberg Order is a type of large trading order that is broken up into much smaller visible portions. Only a small part of the order is displayed in the public order book at any given time, while the rest is hidden (like an iceberg where only the tip is above water).
Why are Iceberg Orders Important?
Minimizing Market Impact
If a trader were to post a 10,000-share sell order openly, the market would immediately react:
Buyers might panic, thinking there's a rush to sell.
Sellers could undercut the price aggressively.
This would likely drive the price down before the large order even finishes executing.
By revealing only a small portion at a time, Iceberg orders help avoid spooking the market and allow the trader to sell closer to the original price.
Hiding Trading Intentions
Markets are highly sensitive to order flow — the balance of buying and selling pressure.
If competitors, market makers, or algorithmic traders see a massive order, they might:
Front-run it (selling before it completes to profit from the expected price drop).
Reassess their own models about supply/demand imbalances.
Iceberg orders protect against this by masking true supply or demand.
Our Iceberg Detection Model
Using a proprietary iceberg order detection algorithm, OrderFlow IQ is capable of detecting/alerting iceberg orders when they occur.
The image above shows the Iceberg Detector in action.
When an iceberg order is identified, the size of the order in the quote currency, price of execution, and number of executions will be displayed.
It's important to set alerts for this feature, as iceberg orders aren't frequent and are easy to miss when away from the chart.
IQ Volume Profile (Chronicled Volume Profile)
OrderFlow IQ generates a Chronicled Volume Profile to give traders detailed insights into net delta by price level, but also historical net delta by price level.
The image above shows the feature in action. While the chronicled volume profile is seemingly a normal volume profile, the narrow-lines across the chronicle profile show historical min/max delta at each price level.
The image above exemplifies the feature.
The wide price blocks show the current net delta at each price area, while the small lines (with a circle at the end) show historical min/max delta at the price level.
This tool allows traders to see if buying/selling always dominated a price level, or if control of the price level changed hands between buyers/sellers throughout development of the profile.
Additionally, traders can hover over the small circles on the profile with their cursor to see the detailed delta statistics at each price area. The statistics will show the minimum delta at the price area, maximum delta, and the live change in delta.
Order Feed
OrderFlow IQ is capable of generating a live order feed with various metrics to assist real time orderflow traders in their analysis.
The image above exemplifies the feature.
Bid/Ask: The bid price and ask price of the current bar
Buys | Price: The size of a buy order and price of execution
Sells | Price: The size of a sell order and price of execution
▴ Vol: Cumulative buying volume (in quote currency) for the feed
▾ Vol: Cumulative selling volume (in quote currency) for the feed
Speed of tape: The average speed between each order fill
OrderFlow Bubble Tape
OrderFlow IQ also displays a traditional orderflow indicator, also known as OrderFlow Bubble Tape.
The image above shows the feature in action.
Orderflow Bubble Tape is a visual tool that shows recent market trades ("tape") as bubbles, where each bubble represents a trade.
The size of each bubble indicates the trade size (volume), and the color shows whether the trade was a buy (aggressive at the ask) or sell (aggressive at the bid).
Instead of showing trades as plain text (like a traditional tape), the bubble format makes it easier to spot bursts of aggressive buying or selling visually.
Clusters of large, fast bubbles in one color suggest momentum or imbalances in order flow, often signaling short-term price pressure.
Traders use Bubble Tape to quickly read supply/demand dynamics, identify hidden buyers/sellers (like iceberg orders), and anticipate short-term price moves.
Blue Bubble = Buy
Red Bubble = Sell
The larger the bubble, the larger the order. Traders can hover over each bubble with their cursor to see the exact size of the order.
Delta Class Lines
OrderFlow IQ shows Live Delta Class Lines grouped by order size buckets:
The blue line shows delta coming only from very large orders (100K–10B in size).
The red line shows delta coming from medium-large orders (50K–100K size).
The green line shows delta from small to medium orders (0–50K size).
Each line is the cumulative net delta for its class — meaning it is adding the buy and sell imbalances only from trades of that size class, live as trades occur.
For example, when a 30K-sized aggressive buy hits, it adds to the green line; if a 70K-sized sell hits, it subtracts from the red line.
The number next to each label is the current net delta value for that class, telling you whether buyers or sellers are dominating at that order size.
• Three Custom Dollar Brackets – Define “small,” “mid,” and “block” trade-size ranges (e.g., 0–50 K, 50 K–100 K, > 100 K).
• Live Streaming Lines – While a bar is forming, watch real-time totals for each bracket plotted as vertical columns or stair-step lines on the chart edge.
CVD
OrderFlow IQ also displays CVD as either candles or a line.
The image above shows the candles visualization for CVD. CVD can be calculated using tick data, 1-second bars, or 1-minute bars. The higher the granularity the more accurate the measurement.
More Features To Come
New features and calculations will be added to OrderFlow IQ based on community feedback, so feel free to share any requests you might have!
Summary
OrderFlow IQ brings a full suite of order-flow analytics into one Pine Script: footprints, delta analytics, dollar-bracket classes, adaptive profiles, bubble tapes, live feeds, CVD meters, and iceberg scans. Its unified Data Granularity switch and Preset System let you toggle entire dashboards with a click—scalpers, intraday traders, and long-term analysts alike can dial in the exact microstructure view they need without switching scripts. Publish once, share your preset layouts, and your TradingView community gains plug-and-play access to professional-grade order-flow tools—no extra installations or feeds required.
Ücretli komut dosyası

Liquidation Heatmap ║ BullVision 🧠Overview
The Liquidation Heatmap ║ BullVision 💥 is a high-precision visualization tool engineered to highlight probable liquidation levels in crypto markets. It leverages multi-exchange Open Interest data, real-time volume dynamics, and structure-aware volatility signals to reveal where leveraged traders are most at risk of forced position closures.
📖 What Are Liquidations?
In leveraged derivatives markets, a liquidation occurs when a trader’s margin becomes insufficient to maintain their position, triggering an automatic force-close by the exchange. These events are typically clustered around price levels where large volumes of overleveraged positions accumulate. When breached, they often result in sharp, aggressive price movements — also known as liquidation cascades.
This indicator is designed to detect and project such high-risk zones before they trigger, giving traders an edge in visualizing hidden pressure points in the market.
🧠 How It Works
The core engine aggregates real-time ∆OI (Open Interest delta) data from multiple major exchanges and applies a layered filtering system that considers:
Relative Open Interest shifts, normalized against an adaptive moving average baseline
Volume acceleration patterns, compared to a rolling historical benchmark
Market structure context, identifying meaningful directional breaks and failed retests
Leverage-tier modeling, using probabilistic distance rules to simulate where liquidations from 5x to 100x positions would be triggered
Each qualifying liquidation level is rendered using dynamic gradient lines and optional glow-enhanced zone visuals. The display adapts in real time to structural confirmation, volatility regime, and liquidity depth.
Exemple of Liquidation cascades
Exemple of Liquidation rejection
🔍 Key Features
🔗 Multi-Exchange OI Aggregation: Binance, OKX, BitMEX, Kraken (toggleable)
📊 Leverage-Tier Mapping: 5x, 10x, 25x, 50x, 100x projections
🎨 Gradient Zones: Custom color ramps reflect level significance
🧱 Structure-Sensitive Filtering: Noise reduction via multi-condition confirmation logic
🧠 Contextual Directional Bias: Zones filtered based on recent bullish/bearish transitions
⚙️ Fully Customizable: User-defined intensity thresholds, color palette, and range filtering
🧩 Why It’s Worth Paying For
This is not a mashup of public indicators. The script introduces an original, multi-layered architecture combining real-time Open Interest dynamics, structural analysis, and custom liquidation modeling.
Unlike speculative support/resistance plots or volume-only heatmaps, this tool is built to:
Detect liquidation zones before they cascade
React dynamically to market shifts
Filter noise through structural confirmation
Retain historical zones for visual learning and backtesting
✅ Compliance & Originality
This script was developed entirely in-house with original detection logic. No reused open-source components are included. Data requests are made through TradingView’s native .P_OI feeds, and all calculations, signal conditions, and visual logic were coded from scratch for this script.
⚠️ Risk Disclaimer & Access Policy
This script is a visual risk-awareness tool, not a signal generator or financial advice mechanism. No guarantee is made regarding future price action, liquidation triggers, or trading performance.
Use at your own discretion, with proper position sizing, risk management, and awareness of the market's inherent uncertainty.
🔒 Why This Script Is Invite-Only and Closed-Source
To protect its proprietary detection engine, this script is both closed-source and invite-only. The algorithm uses original methods to:
Aggregate real-time Open Interest delta across exchanges
Simulate leverage-based liquidation zones
Dynamically filter zones using structure and volatility layers
Opening the source would expose core detection logic to copycats or misuse. Likewise, access is limited to ensure the tool is used responsibly by serious traders and not distributed or repackaged unethically.
This model preserves the script’s quality, originality, and intended value.

CVD Divergence Insights📘 CVD Divergence Insights – by Colicoid
Pine Script v6 | Volume Delta Divergence Oscillator with Spike Detection
⸻
🔍 Overview
CVD Divergence Insights is a volume-aware oscillator and divergence spike detector that helps you spot smart money activity, absorption, failed pressure, and hidden strength or weakness — even when price action alone gives little away.
It works by comparing normalized Cumulative Volume Delta (CVD) against normalized price movement, and optionally applying a volume-weighting layer to highlight when aggressive participation is truly behind the divergence. The result is a dynamic visual tool that identifies tension in the market, and helps you trade based on how that tension resolves.
⸻
🧠 Core Concept
• When price moves one way and CVD moves another, it reflects imbalance between aggression and result.
• Divergence is not a trigger — it’s a build-up of pressure.
• The real edge lies in the resolution of that pressure.
• Optional volume-weighting helps you ignore noise and focus on high-conviction moves only.
⸻
⚙️ How It Works
1. CVD Calculation
CVD is generated using lower-timeframe delta volume (buy vs. sell pressure), accumulated per bar.
2. Oscillator
A normalized divergence between the smoothed CVD and smoothed price.
3. Volume Weighting (optional)
Emphasizes divergences occurring on higher-than-normal volume, deprioritizes low-volume noise.
4. Signal Line (optional)
A short EMA of the oscillator to help track momentum shifts (hidden by default).
5. Divergence Spikes
Statistical spike detection using standard deviation — green/red dots highlight unusually large divergence activity.
⸻
🎛️ Inputs
Anchor Period
Higher timeframe where the CVD is accumulated and processed.
Lower Timeframe
Optional override for granularity of buy/sell volume data.
SMA Length
Used for smoothing both price and CVD before divergence is calculated.
Volume Weighted?
Enables adaptive weighting based on relative volume size.
Volume Normalization Length
Lookback period used to define what is “normal” volume.
Divergence Spike Threshold
StdDev-based threshold to detect abnormally large divergences.
Signal Line Length
Controls the EMA smoothing of the optional signal line (hidden by default).
⸻
📈 Trade Setup Example: Hidden Bullish Divergence
1. Price forms a higher low, but CVD forms a lower low — hidden bullish divergence.
2. This shows aggressive sellers are trying, but price is resilient — likely absorption.
3. You wait for a "convergent signal bar":
• A bullish candle with strong structure or body
• Confirmed by CVD starting to turn upward
4. That’s your trigger bar — the tension resolves upward.
⸻
🤝 Recommended Pairings
For best results, combine CVD Divergence Insights with the companion script:
🔗 Cumulative Volume Delta Line (also by Colicoid)
This lets you:
• See the raw CVD line and its SMA visually
• Spot standard and hidden divergences in price/CVD directly
• Use the Insights indicator to evaluate divergence quality and flag aggressive bull/bear behavior
• Use the same SMA length on both indicators for alignment
👉 Tip: To save screen space, drag the CVD Line indicator into the same panel as CVD Divergence Insights.
⸻
🧰 Why Use This?
• ✅ Catch absorption setups and failed pressure zones
• ✅ Filter out low-quality divergences using volume context
• ✅ Understand why price is hesitating or breaking out
• ✅ Add smart confirmation to breakout/reversal trades
• ✅ Align your execution with who’s actually in control
⸻
📎 Created by Colicoid
Built in Pine Script v6 for advanced price-volume analysis, with focus on effort vs result, market psychology, and smart money detection.

Trailing Stop Loss Smart [TradingFinder] Market Trend + CVD/EMA🔵 Introduction
Trailing Stop Loss (TSL) is one of the most powerful tools available. A Trailing Stop Loss is a modification of a typical stop order that adjusts dynamically based on market price movement. It can be set at a defined percentage or dollar amount away from the security's current market price, making it a flexible tool for locking in profits while minimizing risk. Unlike standard stop-loss orders, a Trailing Stop follows the market in the direction of the trade, protecting gains without requiring constant manual adjustments.
The Trailing Stop Loss Smart (TFlab Trailing Stop) indicator takes this concept even further by incorporating advanced metrics like Cumulative Volume Delta (CVD), volume dynamics, and Average True Range (ATR). This combination not only enhances risk management but also acts as a trend identifier, providing traders with a powerful tool to capitalize on both short-term and long-term price movements.
This indicator also supports various Order Types, allowing for flexible strategies that include a trailing stop/stop-loss combo to maximize winning trades while minimizing losses. The trailing stop limit is particularly useful for traders who want to set their stop at a precise level relative to the current market price, either by a percentage or a dollar amount. The Trailing Stop Loss Smart indicator can help ensure that traders do not exit too early during trends, while the stop-loss feature kicks in during reversals.
The advantages of using a Trailing Stop Loss are its ability to protect profits and reduce the emotional decision-making process in volatile markets. However, like all trading strategies, it has disadvantages, such as the risk of triggering too early during normal market fluctuations. By understanding how the Trailing Stop Loss Smart indicator integrates features like CVD, ATR, and volume analysis, traders can leverage its full potential while navigating these pros and cons.
With its unique ability to track market movements and trends using Cumulative Volume Delta, volume dynamics, and ATR-based trailing stops, this indicator offers a complete solution for traders looking to secure profits while minimizing downside risk. Whether you're employing a simple trailing stop or a trailing stop/stop-loss combo, this tool provides all the flexibility and precision needed to execute winning trades in various markets, including Forex, Crypto, and Stock.
🔵 How to Use
The Trailing Stop Loss Smart indicator integrates multiple advanced components to provide traders with superior risk management and trend identification.
Here’s how each part of the logic works :
🟣 Cumulative Volume Delta (CVD) Logic
The CVD tracks buying and selling pressure by calculating the difference between upward and downward price movements. When there’s more buying pressure, the CVD is positive, indicating a potential bullish trend. Conversely, more selling pressure results in a negative CVD, pointing to a bearish trend.
CVD Trend Detection : The indicator determines whether the market is in a bullish or bearish phase by comparing the CVD to its moving average. A bullish trend is confirmed when the CVD is above its moving average and the price is closing higher.
A bearish trend occurs when the CVD is below its moving average and the price is closing lower. This trend detection is critical for determining whether the trailing stop should be placed below the price (bullish) or above it (bearish).
🟣 Volume Dynamics
Volume is a key factor in identifying market strength. The Trailing Stop Loss Smart indicator pulls volume data based on the market selected (Forex, Crypto, or Stock) and adjusts the trailing stop based on whether the market is experiencing high volume or low volume.
High Volume : When the current volume exceeds the average volume, the market is in a high-volume state. During these conditions, the trailing stop is placed closer to the price, as high volume often indicates strong trends with less chance of reversals.
Low Volume : In low-volume conditions, the trailing stop gives the market more room to breathe by placing the stop further away from the price. This prevents premature stop-outs in periods of reduced market activity.
🟣 ATR-Based Trailing Stop
The Average True Range (ATR) is used to measure market volatility. The Trailing Stop Loss Smart uses the ATR to dynamically adjust the stop-loss distance.
Bullish Market : When a bullish trend is detected, the trailing stop is placed below the lowest price of the recent bars (determined by the Bar Back parameter), and adjusted by the ATR Multiplier. This allows for tighter protection during strong bullish trends.
Bearish Market : When the market is bearish, the trailing stop is placed above the highest price of recent bars, also adjusted by the ATR Multiplier. This ensures that short positions are safeguarded against sudden reversals.
🟣 Dynamic Stop-Loss Updates
The trailing stop is updated every few bars (according to the Refiner parameter), ensuring it remains relevant to the most recent price action and volume changes. This dynamic feature ensures the stop-loss adapts to both trending and volatile market conditions, without requiring manual intervention.
High Volume with Trends : In periods of high volume and a confirmed trend, the stop-loss is positioned tightly to lock in profits while minimizing the risk of reversal.
Low Volume with Trends : In low-volume conditions, the stop-loss is placed further from the price, allowing the market to move freely without triggering premature exits.
🟣 Visual Representation
The indicator visually represents the trailing stop on the chart, with green lines indicating bullish trends and red lines for bearish trends. This visual aid helps traders quickly assess the state of the market and the position of their trailing stop in real-time.
🔵 Settings
The Trailing Stop Loss Smart indicator offers several customizable settings to suit various trading strategies. Understanding these inputs is key to optimizing the tool for your specific trading style.
🟣 General Settings
Cumulative Mode : This controls how the CVD is calculated.
You can choose between :
EMA : Exponential Moving Average smoothing.
Periodic : Sums the delta over a fixed period.
CVD Period : Defines the look-back period for CVD calculation. A longer period smooths the data, making it less sensitive to short-term fluctuations.
Ultra Data : This Boolean input aggregates volume across multiple exchanges for a more comprehensive view of market activity.
Market Ultra Data : Select between Forex, Crypto, and Stock to ensure the indicator pulls accurate volume data for your market.
🟣 Logical Settings
Moving Average CVD Period : Defines the period for the moving average of the CVD. A longer period smooths the trend, reducing noise.
Moving Average Volume Period : Sets the period for the moving average used to distinguish between high and low volume conditions.
Level Finder Bar Back : Determines how many bars to look back when identifying the highest or lowest price for trailing stop placement.
Levels update per candles : Sets how often (in bars) the trailing stop should be updated to remain in sync with market movements.
ATR On : Toggles the use of ATR to adjust the trailing stop based on volatility.
ATR Multiplie r: Defines how far the stop is placed from the price based on the ATR. A larger multiplier increases the stop distance, reducing the likelihood of getting stopped out during market fluctuations.
ATR Multiplier Adjusts the distance of the trailing stop based on the ATR. A higher multiplier places the stop further from the price, providing more breathing room in volatile markets.
🔵 Conclusion
The Trailing Stop Loss Smart indicator is a comprehensive tool for traders looking to manage risk while identifying market trends. By incorporating Cumulative Volume Delta (CVD) to detect buying and selling pressure, volume dynamics to gauge market activity, and ATR to adjust for volatility, this indicator ensures that stop-loss levels are both adaptive and protective.
Whether you’re trading in Forex, Crypto, or Stock markets, the Trailing Stop Loss Smart allows you to capitalize on trends while dynamically adjusting to changing market conditions. Its ability to distinguish between high-volume and low-volume periods ensures that you’re not stopped out prematurely during periods of consolidation or market hesitation.
By providing real-time visual feedback, dynamic adjustments, and trend identification, this indicator serves as a vital tool for traders aiming to maximize profits while minimizing risk. Its versatility and adaptability make it an essential part of any trader’s toolkit, helping you stay ahead in fast-moving markets while safeguarding your positions.

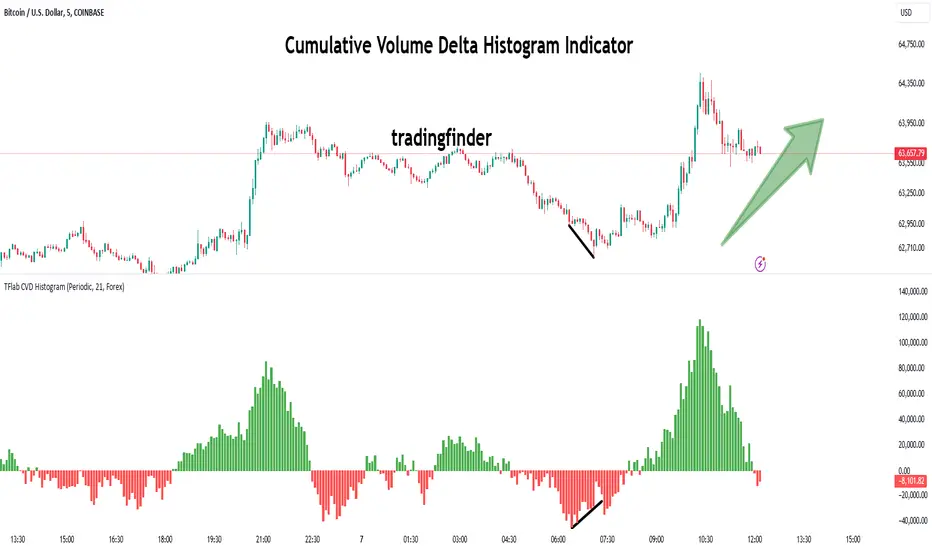
Cumulative Volume Delta Histogram [TradingFinder] CVD Histogram🔵 Introduction
To fully understand Cumulative Volume Delta (CVD), it’s important to start by explaining Volume Delta. In trading, "Delta" refers to the difference between two values or the rate of change between two data points. Volume Delta represents the difference between buying and selling pressure for each candlestick on a chart, and this difference can vary across different time frames.
A positive delta indicates that buying volume exceeds selling volume, while a negative delta shows that selling pressure is stronger. When buying and selling volumes are equal, the volume delta equals zero.
The Cumulative Volume Delta (CVD) indicator tracks the cumulative difference between buying and selling volumes over time, helping traders analyze market dynamics and identify reliable trading signals through CVD divergences.
🔵 How to Use
Cumulative Volume Delta (CVD) is an essential technical analysis tool that aggregates delta values for each candlestick, creating a comprehensive indicator. This helps traders evaluate overall buying and selling pressure over market swings.
Unlike standard Volume Delta, which compares the delta on a candle-by-candle basis, CVD provides a broader view of buying and selling pressure during market trends. A downward-trending CVD suggests that selling pressure is dominant, which is typically a bearish signal.
Conversely, an upward-trending CVD indicates bullish sentiment, suggesting buyers are in control. This analysis becomes even more valuable when compared with price action and market structure, helping traders predict the direction of asset prices.
🟣 How to Use CVD in Trend Analysis and Market Reversals
Understanding how to detect trend changes using Cumulative Volume Delta is crucial for traders. Typically, CVD aligns with market structure, moving in the same direction as price trends.
However, divergences between CVD and price movements or signs of volume exhaustion can be powerful indicators of potential market reversals. Recognizing these patterns helps traders make more informed decisions and improve their trading strategies.
🟣 How to Spot Trend Exhaustion with CVD
CVD is particularly effective for identifying trend exhaustion in the market. For instance, if an asset's price hits a new low, but CVD doesn’t follow, this might indicate a lack of seller interest, signaling potential exhaustion and a possible reversal.
Similarly, if an asset reaches a new high but CVD fails to follow, it can suggest that buyers lack the strength to push the market higher, indicating a possible reversal to the downside.
🟣 How to Use CVD Divergence in Price Trend Analysis
Another effective use of CVD is identifying divergences in price trends. For example, if CVD breaks a previous high or low while the price remains stable, this divergence may indicate that buying or selling pressure is being absorbed.
For instance, if CVD rises sharply without a corresponding increase in asset prices, it may suggest that sellers are absorbing the buying pressure, which could lead to a strong sell-off. Conversely, if prices remain stable while CVD declines, it may indicate that buyers are absorbing selling pressure, likely leading to a price increase once the selling subsides.
🟣 CVD Display, Candlestick vs. Histogram – What’s the Difference?
CVD can be displayed in two different formats :
Candlestick Display : In this format, the data is shown as green and red candlesticks, each representing the difference in buying and selling pressure over a given time period. This display allows traders to visually analyze market pressure along with price changes.
Histogram Display : Here, the data is represented as vertical green and red bars, where each bar’s height corresponds to the volume delta. This format offers a clearer view of the strengths and weaknesses in market buying and selling pressure.
🟣 What are the Key Settings for CVD?
Cumulative Mode : CVD offers three modes: "Total," "Periodic," and "EMA." In "Total" mode, CVD accumulates the delta from the beginning to the end of the session. In "Periodic" mode, it accumulates volume periodically, resetting at specific intervals. In "EMA" mode, the CVD is smoothed using an Exponential Moving Average (EMA) to filter out short-term fluctuations.
Period : The "Period" setting allows you to define the number of bars or intervals for "Periodic" and "EMA" modes. A shorter period captures more short-term movements, while a longer period smooths out the fluctuations and provides a broader view of market trends.
Market Ultra Data : This feature integrates data from 26 major brokers into the volume calculations, providing more reliable volume data. It’s important to specify the type of market you are analyzing (Forex, crypto, etc.) as different brokers contribute to different markets. Enabling this setting ensures the highest accuracy in volume analysis.
🔵 Conclusion
Cumulative Volume Delta (CVD) is a powerful technical indicator that helps traders assess buying and selling pressure by aggregating the delta values of each candlestick. Whether displayed as candlesticks or histograms, CVD provides insights into market trends, helping traders make informed decisions.
CVD is particularly useful in identifying divergences and exhaustion in market trends. For example, if CVD does not align with price movements, it can signal a potential trend reversal. Traders use this tool to fine-tune their entry and exit points and better predict future market movements.
In summary, CVD is a versatile tool for analyzing volume data and understanding the balance of buying and selling pressure in the market, making it an invaluable asset in any trader’s toolkit
Tick CVD [Kioseff Trading]Hello!
This script "Tick CVD" employs live tick data to calculate CVD and volume delta! No tick chart required.
Features
Live price ticks are recorded
CVD calculated using live ticks
Delta calculated using live ticks
Tick-based HMA, WMA, EMA, or SMA for CVD and price
Key tick levels (S/R CVD & price) are recorded and displayed
Price/CVD displayable as candles or lines
Polylines are used - data visuals are not limited to 500 points.
Efficiency mode - remove all the bells and whistles to capitalize on efficiently calculated/displayed tick CVD and price
How it works
While historical tick-data isn't available to non-professional subscribers, live tick data is programmatically accessible. Consequently, this indicator records live tick data to calculate CVD, delta, and other metrics for the user!
Generally, Pine Scripts use the following rules to calculate volume/price-related metrics:
Bullish Volume: When the close price is greater than the open price.
Bearish Volume: When the close price is less than the open price.
This script, however, improves on that logic by utilizing live ticks. Instead of relying on time-series charts, it records up ticks as buying volume and down ticks as selling volume. This allows the script to create a more accurate CVD, delta, or price tick chart by tracking real-time buying and selling activity.
Price can tick fast; therefore, tick aggregation can occur. While tick aggregation isn't necessarily "incorrect", if you prefer speed and efficiency it's advised to enable "efficiency mode" in a fast market.
The image above highlights the tick CVD and price tick graph!
Green price tick graph = price is greater than its origin point (first script load)
Red price tick graph = price is less than its origin point
Blue tick CVD graph = CVD, over the calculation period, is greater than 0.
Red tick CVD graph = CVD is less than 0 over the calculation period.
The image above explains the right-oriented scales. The upper scale is for the price graph and the lower scale for the CVD graph.
The image above explains the circles superimposed on the scale lines for the price graph and the CVD graph.
The image above explains the "wavy" lines shown by the indicator. The wavy lines correspond to tick delta - whether the recorded tick was an uptick or down tick and whether buy volume or sell volume transpired.
The image above explains the blue/red boxes displayed by the indicator. The boxes offer an alternative visualization of tick delta, including the magnitude of buying/selling volume for the recorded tick.
Blue boxes = buying volume
Red boxes = selling volume
Bright blue = high buying volume (relative)
Bright red = high selling volume (relative)
Dim blue = low buying volume (relative)
Dim red = low selling volume (relative)
The numbers displayed in the box show the numbered tick and the volume delta recorded for the tick.
The image above further explains visuals for the CVD graph.
Dotted red lines indicate key CVD peaks, while dotted blue lines indicate key CVD bottoms.
The white dotted line reflects the CVD average of your choice: HMA, WMA, EMA, SMA.
The image above offers a similar explanation of visuals for the price graph.
The image above offers an alternative view for the indicator!
The image above shows the indicator when efficiency mode is enabled. When trading a fast market, enabling efficiency mode is advised - the script will perform quicker.
Of course, thank you to @RicardoSantos for his awesome library I use in almost every script :D
Thank you for checking this out!

Cumulative Volume Delta LineThis script is a refined version of TradingView's Cumulative Volume Delta (CVD) indicator. It features a CVD line for lower time frames and automatically switches to a Simple Moving Average (SMA) line on daily time frames and higher. This functionality makes it easier to spot Volume Delta divergences on daily charts while maintaining utility on intraday time frames.
Key Features:
Line Chart and Oscillator Configuration: Unlike TradingView's standard CVD, this script can be configured as a line chart or an oscillator, enhancing flexibility and usability.
Line chart for easier divergence spotting: The line chart format is preferred for spotting divergences, providing a clearer visual representation compared to other formats.
Accurate Calculations: Many older community CVD scripts use approximate calculations that can be inaccurate. This script leverages TradingView's own calculations, which are the most accurate available without tick data feeds.
Intraday and Daily Adaptation: The Traditional CVD script is a per bar volume delta on Daily and higher timeframes and cumulative volume delta for intraday session timeframes which makes it very hard to spot divergences on higher timeframes. This script resolves that by using an SMA on daily time frames and higher.
Auto-Switching Feature: The script intelligently switches between the CVD line and the SMA line based on the active time frame. This feature can be toggled off if you prefer to use the CVD on all time frames or the SMA on all time frames.
Customizable Settings: Building on TradingView's CVD script, this version includes all the same settings in addition to the new auto-switch, SMA length etc.
About Volume Delta and Cumulative Volume Delta:
Volume Delta is the difference between the buying and selling volume within a specified period. It helps traders understand the net buying or selling pressure in the market. A positive volume delta indicates more buying activity, while a negative volume delta indicates more selling activity.
Cumulative Volume Delta (CVD) aggregates the volume delta over time to provide a running total. This cumulative approach helps traders see the overall buying and selling pressure trends, making it easier to identify potential reversals or continuations in the market trend.

Order Chain [Kioseff Trading]Hello!
This indicator "Order Chain" uses live tick data (varip) to retrieve live tick volume.
This indicator must be used on a live market with volume data
Features
Live Tick Volume
Live Tick Volume Delta
Orders are appended to boxes, whose width and height are scaled proportional to the size of the order.
CVD recorded at relevant tick levels
Order chain spans up to 450 ticks (might include aggregates)
The image above shows key features for the indicator!
The image above explains line and color placements.
The image above shows the indicator in action for a live market!
How It Works
The indicator records the difference in volume from "now" and the previous tick. Predicated on whether the "now" price is greater than or less than price one tick prior, the difference in volume is recorded as "buy" or "sell" volume.
This filled order (or aggregates) is colored in congruence with price direction. The filled order is subsequently appended to its relevant tick level and added (buy order) or subtracted (sell order) from the CVD value at the identified tick level.
Of course, thank you to @PineCoders and @RicardoSantos for their awesome libraries :D
Thank you!

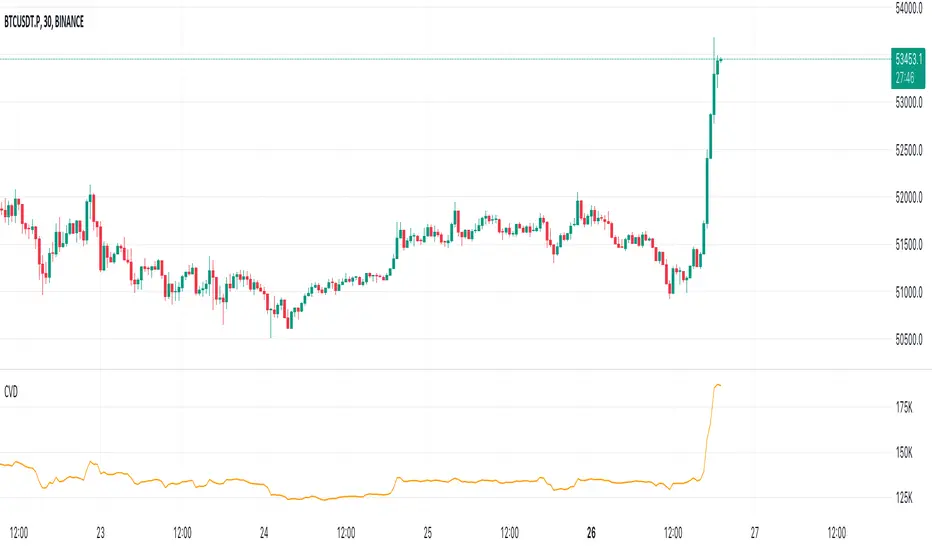
Cumulative Volume Delta (CVD)█ OVERVIEW
Cumulative Volume Delta (CVD) is a volume-based trading indicator that provides a visual representation of market buying and selling pressure by calculating the difference in traded volumes between the two sides. It uses intrabar information to obtain more precise volume delta information than methods using only the chart's timeframe.
Volume delta is the net difference between Buy Volume and Sell Volume. Positive volume delta indicates that buy volume is more than sell volume, and opposite. So Cumulative Volume Delta (CVD) is a running total/cumulation of volume delta values, where positive VD gets added to the sum and negative VD gets subtracted from the sum.
I found simple and fast solution how to calculate CVD, so made plain and concise code, here is CVD function :
cvd(_c, _o, _v) =>
var tcvd = 0.0, delta = 0.0
posV = 0.0, negV = 0.0
totUV = 0.0, totDV = 0.0
switch
_c > _o => posV += _v
_c < _o => negV -= _v
_c > nz(_c ) => posV += _v
_c < nz(_c ) => negV -= _v
nz(posV ) > 0 => posV += _v
nz(negV ) < 0 => negV -= _v
totUV += posV
totDV += negV
delta := totUV + totDV
cvd = tcvd + delta
tcvd += delta
cvd
where _c, _o, _v are close, open and volume of intrabar much lower timeframe.
Indicator uses intrabar information to obtain more precise volume delta information than methods using only the chart's timeframe.
Intrabar precision calculation depends on the chart's timeframe:
CVD is good to use together with open interest, volume and price change.
For example if CVD is rising and price makes good move up in short period and volume is rising and open interest makes good move up in short period and before was flat market it is show big chance to pump.
Price and Volume Stochastic Divergence [MW]Introduction
This indicator creates signals of interest for entering and exiting long and short positions on equities. It primarily uses up and down trends defined by the change in cumulative volume with some filtering provided by a short period exponential moving average (9 EMA by default).
Settings
Moving Average Period : The moving average over which the cumulative volume delta is calculated. Default: 14
Short Period EMA : The EMA used to represent price action, and is used to generate the EMA Delta line. Default: 27 (3*3*3)
Long Period EMA : The second EMA used to calculate the EMA Delta line. Default: 108 (2*2*3*3*3)
Stochastic K Value : The value used for stochastic curve smoothing. Default: 3
Dot Size : The diameter of the larger indicator. Default: 10
Dot Transparency : The transparency level of the outer ring of the primary BUY/SELL signal. Default: 50 (0 is opaque, 100 is transparent)
Band Distance from 0 to 100 : The upper and lower band distance. Default: 20
Calculations
The cumulative volume delta (CVD) is calculated using candle bodies and wicks. For a red candle, buying volume is calculated by multiplying the volume by the spread percentage of the average of the top and bottom wicks, while Selling Volume is calculated multiplying the volume by the spread percentage of the average of the top and bottom wicks - in addition to the spread percentage of the candle body.
For a green candle, buying volume is calculated by multiplying the volume by the spread percentage of the average of the top and bottom wicks - plus the spread percentage of the candle body - while Selling Volume is calculated using only the spread percentage average of the top and bottom wicks.
Once we have the CVD, we can then perform a stochastic calculation of the CVD value.
stochastic calculation = (current value - lowest value in period) / (highest value in period - lowest value in period)
We’ll do the same stochastic calculation for the short term EMA (27 EMA default) as well as for the difference between the short term and long term EMA.
When the stochastic CVD value is rising from zero and the short term EMA stochastic value equals 100, then it’s a major bullish signal. When the stochastic CVD value is falling from 100 and the short term EMA stochastic value equals 0, then it’s a major bearish signal.
Sometimes, after a bullish or bearish signal, the stochastic CVD will reverse direction triggering a new opposing signal.
How to Interpret
The CVD indicates when there is either more buying than selling or vice versa. A value over 50 for the stochastic CVD curve represents more buying taking place. A value below 50 represents more selling. One might intuitively believe that when there is more buying volume than selling volume that the price would follow suit. This is not always the case.
Most of the time buying volume will precede consistent price movement upwards, and selling volume will precede consistent price movement downwards. When this divergence occurs, the indicator generates a signal. When this divergence begins to fail, and buying or selling volume reverses, then another signal is generated indicating that the buying/selling impulse is headed back into the direction of price action.
These interactions are visually represented on the chart with the coral line that represents CVD, and the yellow line that represents the EMA, or the average price. When the coral line goes up and the yellow line stays down, that’s the BUY signal. When the coral line goes down and the yellow line stays up, that’s the sell signal. When the coral line switches direction, the chart generates another signal showing that volume is moving in a direction that supports the price.
The orange line represents the stochastic representation of the difference between the short EMA (27 by default) and the long EMA (108 by default). EMA differences is a method that can be used to define a trend. When a short term EMA is above a longer term EMA, that may represent a bullish trend. When it is below, that may represent a bearish trend. When all 3 lines are rising or falling in the same direction at the same time, it tends to indicate a movement that has the potential to continue.
Other Usage Notes and Limitations
It's important for traders to be aware of the limitations of any indicator and to use them as part of a broader, well-rounded trading strategy that includes risk management, fundamental analysis, and other tools that can help with reducing false signals, determining trend direction, and providing additional confirmation for a trade decision. Diversifying strategies and not relying solely on one type of indicator or analysis can help mitigate some of these risks.
This indicator can be paired with the MW Volume Impulse indicator if it is desired to see the actual buying and selling cumulative volume deltas. Also, in many cases, the BUY and SELL signals tend to correspond with Keltner Bands (ATR Bands) becoming extended. Lastly, volume weighted average price (VWAP) along with other macro events can impact price and negate signals. To view VWAP lines, you may choose to use the Multi VWAP or Multi VWAP for Gaps indicator to help ensure that the signals you see in this indicator are not being affected by VWAP lines.

Trended CVD [Mxwll]Hey!
This indicator "Trended CVD" categorizes price movement by trend (using zig zag) and calculates cumulative volume delta for the entirety of the price move.
Features
CVD calculated for the trend
CVD divergences are distinguished (uptrend and falling CVD / downtrend and rising CVD)
CVD output normalized to scale with chart, and is plotted alongside the trend
Can be used for trend confirmation (CVD trend correlating with price trend)
All regular zig-zag features available
What constitutes a trend is customizable. Can locate small, medium, large price trends with detailed user-input settings.
How-To Use Trended CVD
The image above shows one of two primary uses for the indicator.
In the left-half of the image, price is downtrending simultaneously with CVD; thereby, CVD is confirming the downtrend.
The right-half of the image shows price uptrending simultaneously with CVD; CVD is confirming the uptrend.
This information can be used to classify the "strength" of the price move, and decide to trade with it or against it.
The image above shows the second primary use for the indicator.
A slight price decrease transpires while CVD increases - CVD diverging upwards from the price trend.
This information can be used to classify the strength of the downtrend, and decide to trade against it, or abstain from trading with it.
The image above shows, subsequent to divergence, price failed to sustain "meaningful" downwards movement.
Labels oriented at the final pivot of a trend show the cumulative volume delta for the entirety of the price move (distinguishable by the superimposed zig zag line).
That's really it! A more complex concept integrated with a simple output.
Thank you!

Logarithmic CVD [IkkeOmar]The LCVD is another Mean-Reversion Indicator. it doesn't detect trends and does not give a signal per se. However the logarithmic transformation is made to visualize the direction of the trend for the volume. This allows you to see if money is flowing in or out of an asset.
What it does is tell you if we have a flashcrash based on the difference in volume.
Think of this indicator like a form of a volatility index.
Smoothing input:
The only input is an input for the smoothing length of the logDelta.
Volume Calculation:
// @IkkeOmar
//@version=5
indicator('Logarithmic CVD', shorttitle='CVD', overlay=false)
smooth = input.int(defval = 25, title = "Smoothing Distance")
// Calculate buying and selling volume
askVolume = volume * (close > open ? 1 : 0) // Assuming higher close than open indicates buying
bidVolume = volume * (close < open ? 1 : 0) // Assuming lower close than open indicates selling
// Delta is the difference between buying and selling volume
delta = askVolume - bidVolume
// Apply logarithmic transformation to delta
// Adding a check to ensure delta is not zero as log(0) is undefined
logDelta = delta > 0 ? math.log(math.abs(delta)) * math.sign(delta) : - math.log(math.abs(delta)) * math.sign(delta)
// use the the ta lib for calculating the sma of the logDelta
smoothLogDelta = ta.sma(logDelta, smooth)
// Create candlestick plot
plot(logDelta, color= color.green, title='Logarithmic CVD')
plot(smoothLogDelta, color= color.rgb(145, 37, 1), title='Smooth CVD')
These lines calculate the buying and selling volumes. askVolume is calculated as the total volume when the closing price is higher than the opening price, assuming this indicates buying pressure. bidVolume is calculated as the total volume when the closing price is lower than the opening price, assuming selling pressure.
The Delta is simply the difference between buying and selling volumes.
Logarithmic Transformation:
logDelta = delta > 0 ? math.log(math.abs(delta)) * math.sign(delta) : - math.log(math.abs(delta)) * math.sign(delta)
Applies a logarithmic transformation to delta. The math.log function is used to calculate the natural logarithm of the absolute value of delta. The sign of delta is preserved to differentiate between positive and negative values. This transformation helps in scaling the delta values, especially useful when dealing with large numbers.
This script essentially provides a visual representation of the buying and selling pressures in a market, transformed logarithmically for better scaling and smoothed for trend analysis.
Hope it makes sense!
Stay safe everyone!
Don't hesitate to ask any questions if you have any!

Volume Delta Methods (Chart) [LuxAlgo]The Volume Delta Methods (Chart) aims at highlighting the relationship between Buying or Selling Pressure and Price by presenting Volume Delta , and multiple derivatives of volume delta such as Cumulative Volume Delta (CVD) , Buy/Sell Volume , Total Volume , etc on top of the Main Price Chart .
The script uses two different intrabar (chart bars at a lower timeframe than the chart's) analyses to achieve the most approximate calculation of the volume delta and offers fully customizable visualization features using various types of charts such as line, area, baseline, candles, and histograms.
The script allows traders to see "within" the price bar, provides more transparency over a traditional volume histogram, and also allows users to monitor price and volume activity together.
🔶 USAGE
Volume delta is the difference between the buying volume and the selling volume, in other words, it is the net demand at a given bar allowing traders a more detailed insight when analyzing the market sentiment. A volume delta greater than 0 indicates more buying than selling pressure, whereas a volume delta less than 0 indicates more selling than buying pressure.
Volume delta plus total volume (regular volume) adds additional insight, where the total volume represents all the recorded trades for security that occurs in a given time interval. It is a measurement of the participation, enthusiasm, and interest in a given security.
Divergences occur when the polarity of the volume delta does not match the polarity of the price bar.
The users can enable the display of the numerical values of the volume delta.
Cumulative Volume Delta (CVD) is a way of using Volume Delta to measure an asset’s mid-to-long-term buy and sell pressure. It compares buying and selling volume over time and offers insights into market behavior at specific price points. Cumulative Volume Delta is effectively a continuation of the principles of Volume Delta but involves longer time periods and offers different trading signals.
Like the Volume Delta, the Cumulative Volume Delta (CVD) indicator measures the relationship between buy and sell pressure but does not focus on one specific candle in particular. Rather, the Cumulative Volume Delta takes the relative differences and combines them all over an extended time period.
Users have the ability Cumulative Volume Delta in various types of charts along with an optional smoothing line.
Placed above price bars options.
Interacting with price bar options helps to better identify CVD Divergences.
CVD Divergences
CVD reveals buying and selling trends that may or may not complement the price trend of the asset itself. Sometimes, price trends can run in contrast to trading behavior — sell volume can be dominant while the spot price is rising, and vice versa.
🔶 DETAILS
Theoretically, volume delta is calculated by taking the difference between the volume that traded at the ask price and the volume that traded at the bid price. The most precise calculation method uses tick data but requires huge amounts of data on historical bars, which usually limits the historical depth of charts. This indicator uses two different intrabar analysis methods for the volume delta calculation, where intrabars are chart bars at a lower timeframe than the chart's timeframe:
The logic used to assign intrabar volume to the "up" or "down".
- Buying/Selling pressure of the intrabar option (default)
(close - low) > (high - close) => UP
(close - low) < (high - close) => DOWN
(close - low) = (high - close) => close - previous close is used
- Polarity of the intrabar option
close > open => UP
close < open => DOWN
close = open => close - previous close is used
🔶 SETTINGS
The script takes into account user-defined parameters and performs calculations and presentations based on them, where detailed usage for each user-defined input parameter in indicator settings is provided with the related input's tooltip.
🔹 Calculation Settings
Calculation Method: Calculation method selection, available options 'Intrabar Buying/Selling Pressure' or 'Intrabar Polarity'.
Lower Timeframe Precision: Sets indicator precision, default option is 'Auto'.
🔹 Presentation Settings
Volume Delta: Toggles the visibility of the Volume Delta
Cumulative Volume Delta: Toggles the visibility of the Cumulative Volume Delta
Volume Delta/Price Bar Divergences: Toggles the visibility of the Volume Delta Divergences
Volume Delta Numerical Values: Toggles the visibility of the Volume Delta Numerical Values
🔹 Other Features
Volume MA: Toggles the visibility of the Volume Moving Average
CVD Smoothing: Toggles the visibility of the Cumulative Volume Delta's Smoothing Line
🔹 Volume Delta, Others
Volume Delta: Positive, Negative: Volume Delta color customization options
Volume Histogram: Growing, Falling: Volume Histogram color customization options
Display Length: Length of the visual objects presented with this indicator
Volume Delta Height: Volume delta height customization options
Volume Histogram Height: Volume histogram height customization options
Vertical Offset: Volume delta and histogram vertical positioning customization options
🔹 Cumulative Volume Delta, Others
CVD Line, Width, and Color: Cumulative Volume Delta - Line Width and Color customization options
CVD Area/Baseline, Gradient Coloring: Cumulative Volume Delta - Area and Baseline background gradient coloring customization options
CVD Candles Color, Positive, and Negative: Cumulative Volume Delta - Candles coloring customization options
CVD/Smoothing Background: Highlights and adjusts the transparency of the area between the Cumulative Volume Delta Line and it's Smoothing Line
🔶 RELATED SCRIPTS
Liquidity-Sentiment-Profile
EquiVolume
Volume-Footprint

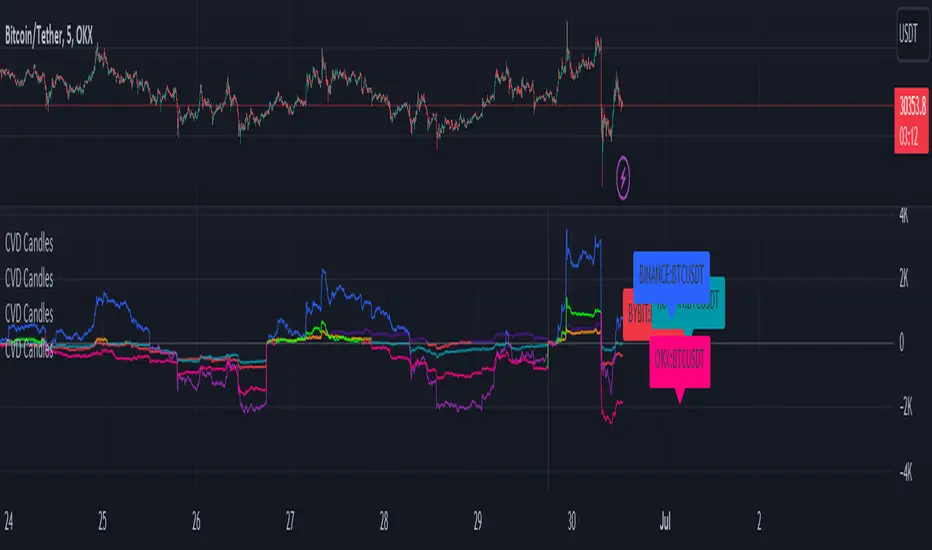
CVD+ - Multi Symbol Cumulative Volume DeltaEdit of TradingView's LTF CVD
TradingView's CVD is already the most accurate CVD on the platform because of the LTF data. The purpose of the edit is to provide the ability to compare volume flow between multiple exchanges, futures & spot, multiple symbols or any other potential use case. All in single layout or even a single pane.
Added features:
- Option to manually select a symbol from which to calculate the LTF CVD
- Option to normalize the selected symbol's CVD to the chart's symbol's CVD (Useful when you want to compare futures and spot on the same pane)
- Label that displays the selected symbol's name and exchange
- Changed presets to plot the CVD line as the predetermined option
All of TV's original features remain the same.
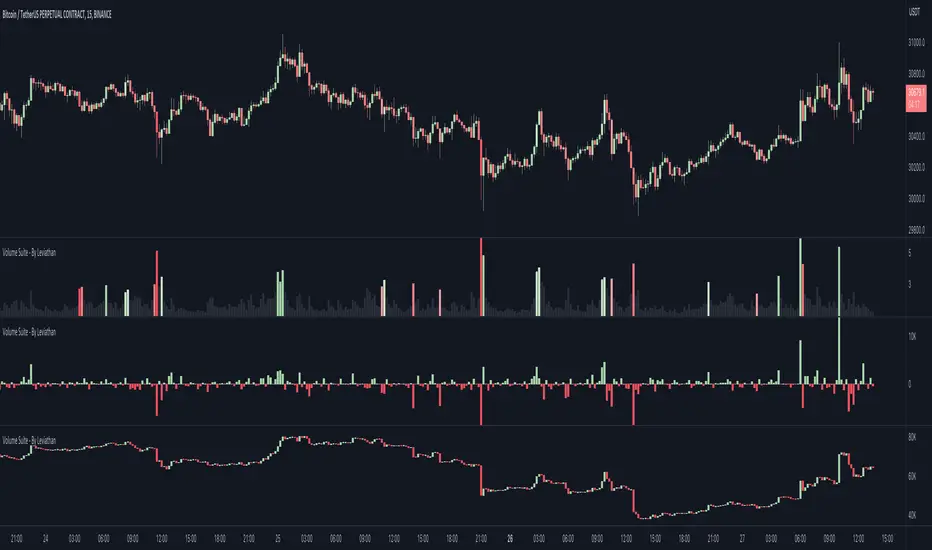
Volume Suite - By Leviathan (CVD, Volume Delta, Relative Volume)Volume Suite is an all-in-one script that includes several volume-based indicators such as CVD, Volume Delta, Relative Volume, Buy/Sell Volume, Cumulative Relative Volume and more. Additionally, it offers fully customisable appearance and features for improved data visualization, such as highlights for high volume activity, small price changes with high volume, or large price changes with low volume and more.
Data available in version 1:
- Volume Delta
Volume Delta is the net difference between Buy Volume and Sell Volume at a given bar. Positive Delta indicates that Buy Volume > Sell Volume, while Negative Delta means that Sell Volume > Buy Volume. As there is not way to get tick data on Tradingview, calculating Volume Delta is improvised by using the direction of lower timeframe candles and their volume.
- Cumulative Volume Delta (CVD)
CVD is a running total/cumulation of Volume Delta values, where positive VD gets added to the sum and negative VD gets subtracted from the sum. It can be used for trend strength analysis, divergence strategies, sentiment, etc.
- Buy/Sell Volume
Buy and Sell Volume provides an insight into volume activity in a given bar by estimating the buying/selling volume based on the direction of lower timeframe candles and their volume.
- Relative Volume
Relative Volume is used to compare current trading volume to past trading volume over a given period. For instance, a relative volume of 1.0 indicates that volume is at an average level, while a relative volume of 2.0 suggests that the volume is twice as high as the average.
- Cumulative Relative Volume (CRVOL)
CRVOL is a running total/cumulation of Relative Volume values, where RVOL at close>open gets added to the sum and RVOL at close
Open Interest Profile [Fixed Range] - By LeviathanThis script generates an aggregated Open Interest profile for any user-selected range and provides several other features and tools, such as OI Delta Profile, Positive Delta Levels, OI Heatmap, Range Levels, OIWAP, POC and much more.
The indicator will help you find levels of interest based on where other market participants are opening and closing their positions. This provides a deeper insight into market activity and serves as a foundation for various different trading strategies (trapped traders, supply and demand, support and resistance, liquidity gaps, imbalances,liquidation levels, etc). Additionally, this indicator can be used in conjunction with other tools such as Volume Profile.
Open Interest (OI) is a key metric in derivatives markets that refers to the total number of unsettled or open contracts. A contract is a mutual agreement between two parties to buy or sell an underlying asset at a predetermined price. Each contract consists of a long side and a short side, with one party consenting to buy (long) and the other agreeing to sell (short). The party holding the long position will profit from an increase in the asset's price, while the one holding the short position will profit from the price decline. Every long position opened requires a corresponding short position by another market participant, and vice versa. Although there might be an imbalance in the number of accounts or traders holding long and short contracts, the net value of positions held on each side remains balanced at a 1:1 ratio. For instance, an Open Interest of 100 BTC implies that there are currently 100 BTC worth of longs and 100 BTC worth of shorts open in the market. There might be more traders on one side holding smaller positions, and fewer on the other side with larger positions, but the net value of positions on both sides is equivalent - 100 BTC in longs and 100 BTC in shorts (1:1). Consider a scenario where a trader decides to open a long position for 1 BTC at a price of $30k. For this long order to be executed, a counterparty must take the opposite side of the contract by placing a short order for 1 BTC at the same price of $30k. When both long and short orders are matched and executed, the Open Interest increases by 1 BTC, indicating the introduction of this new contract to the market.
The meaning of fluctuations in Open Interest:
- OI Increase - signifies new positions entering the market (both longs and shorts).
- OI Decrease - indicates positions exiting the market (both longs and shorts).
- OI Flat - represents no change in open positions due to low activity or a large number of contract transfers (contracts changing hands instead of being closed).
Typically, we monitor Open Interest in the form of its running value, either on a chart or through OI Delta histograms that depict the net change in OI for each price bar. This indicator enhances Open Interest analysis by illustrating the distribution of changes in OI on the price axis rather than the time axis (akin to Volume Profiles). While Volume Profile displays the volume that occurred at a given price level, the Open Interest Profile offers insight into where traders were opening and closing their positions.
How to use the indicator?
1. Add the script to your chart
2. A prompt will appear, asking you to select the “Start Time” (start of the range) and the “End Time” (end of the range) by clicking anywhere on your chart.
3. Within a few seconds, a profile will be generated. If you wish to alter the selected range, you can drag the "Start Time" and "End Time" markers accordingly.
4. Enjoy the script and feel free to explore all the settings.
To learn more about each input in indicator settings, please read the provided tooltips. These can be accessed by hovering over or clicking on the ( i ) symbol next to the input.

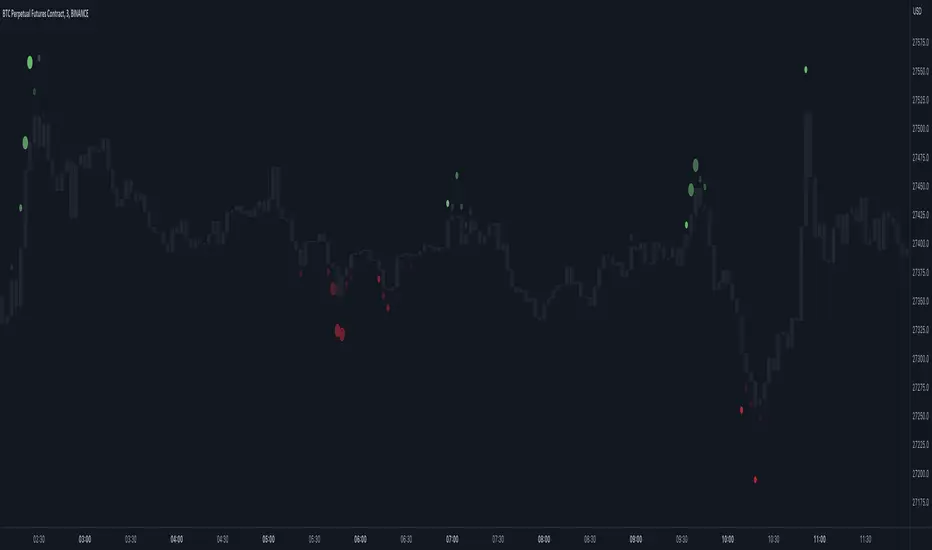
Market Order Bubbles - By Leviathan"Market Order Bubbles" is a volume-based indicator that helps visualize the occurrences of increased aggressiveness in market buying/selling and can serve as a useful confluence for trading reversals or as a simple tool for observing real-time market dynamics.
I created Market Order Bubbles six months ago as an additional tool included in my Liquidation Levels script. Due to their popularity, I decided to publish them as a standalone indicator with some new features. The script is based on a calculation that uses volume data (imitation of CVD) and price action to estimate where there is a surge in the quantity and magnitude of market buy and sell orders. These occurrences are visualized with circles (bubbles) that appear above the bar (market buy orders) or below the bar (market sell orders). Most of the time, the approach to interpreting the bubbles is contrarian, meaning that the appearance of Market Buy Order Bubbles can serve as a confluence to look for shorts, and the appearance of Market Sell Order Bubbles can serve as a confluence to look for longs.
The concept behind taking a contrarian approach:
Market Buy Order Bubbles appear above the price and possibly signal the following:
- Short positions being liquidated (exit short = buy order)
- New traders entering late longs based on FOMO (enter long = buy order)
- Smarter traders getting their limit sell orders filled by aggressive buyers/stopped out shorts
⇒ Possible reversal to the downside / short-term pullback / start of ranging price action (PA)
Market Sell Order Bubbles appear below the price and possibly signal the following:
- Long positions being liquidated (exit long = sell order)
- New traders entering late shorts based on FOMO (enter short = sell order)
- Smarter traders getting their limit buy orders filled by aggressive sellers/stopped out longs
⇒ Possible reversal to the upside / short-term pullback / start of the ranging PA
These events are identified and filtered by EMA and STDEV-based "thresholds," which can be modified in the indicator settings.
1. If the buy/sell volume exceeds the first threshold, a Small Bubble is displayed.
2. If the buy/sell volume surpasses the second threshold, a Medium Bubble is displayed.
3. If the buy/sell volume exceeds the third threshold, a Large Bubble is displayed.
Increasing the multipliers effectively increases the threshold for a given bubble to appear, making the conditions for its occurrence more strict.
Decreasing the multipliers effectively decreases the threshold for a given bubble to appear, making the conditions for its occurrence less strict.
Settings Overview
"Bubble Position" - Choose whether the bubbles are displayed above/below the candle, at the candle high/low, or at the intrabar POC of the candle.
"Strength Gradient Color" - This option adjusts the transparency of the bubble's color relative to the volume on that bar.
"Threshold EMA Length" - Choose the length of the EMA used for determining the thresholds.
"Threshold STDEV Length" - Choose the length of the ta.stdev() function used on the EMA.
"Appearance Delay" - This input allows you to delay the appearance of the bubble for x number of bars. The default is 0.
"Show POC" - Show/hide intrabar POCs displayed as "-".
"Timeframe-Adjusted Settings" - Different timeframes might require different parameters. In this section, you can set custom parameters (Lengths and Multipliers) for four different timeframes, and the script will automatically switch to those settings as you browse through different timeframes.
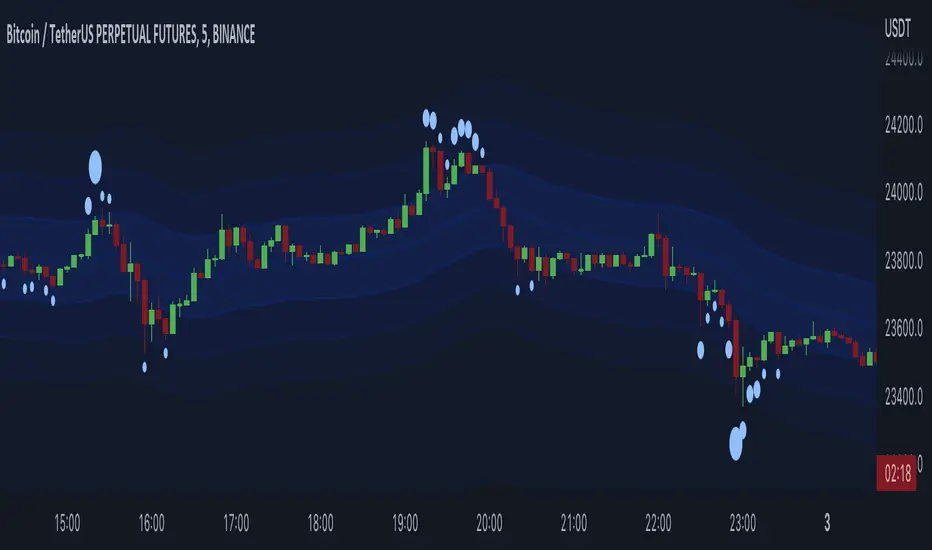
Liquidation Bands (+CVD Bubbles) - By LeviathanAlong with CVD bubbles, this script plots continuous bands that represent 100x, 75x, 50x, 25x liquidation levels. The bands can serve as support/resistance, reversal points, expected volatility range and more.
The indicator uses either the Exponential Moving Average (EMA) or the Volume Weighted Average Price (VWAP) as a base for plotting continuous lines and zones set at the approximate distance of 100x, 75x, 50x, 25x leverage liquidation prices.
These bands can help you visualize:
- Dynamic Support and Resistance levels
- Levels that the price will gravitate towards
- Expected price range (potential volatility)
- Reversal points
- ...
The "CVD Bubbles" part of this script plots circles that are based on my imitation of Cumulative Volume Delta (CVD).
CVD Bubbles will appear when buy/sell volume is increased. The larger the bubble, the more buying/selling at that candle.
"Buy Order" CVD Bubbles appear above candles and might signal:
- Late longers entering the market
- Large short liquidations (closed short=buy order)
- Large market buys getting absorbed by limit sell orders
=> Bias: potential reversal to the downside
"Sell Order" CVD Bubbles appear below candles and might signal:
- Late shorters entering the market
- Large long liquidations (closed long=sell order)
- Large market sells getting absorbed by limit buy orders
=> Bias: potential reversal to the upside
Combining Liquidation Bands and CVD Bubbles can serve you as confluence for taking a trade, but don't follow them blindly.
Settings:
"Mode" - Choose the base for Liquidation Bands (EMA or VWAP)
"EMA/CVD Length" - Choose the length (number of bars) for calculating EMA and CVD
"Level Calculation Mode" - Choose between 3 variations of calculating the distance to Liquidation Bands
"Standard Deviation Length" - Choose the length used for calculating the thresholds of CVD
"Appearance" - Choose the colors of lines, zones and CVD Bubbles
"STDEV MULT." - Multiply the thresholds used for CVD Bubble Sizes
Cumulative Volume Delta [Aggregated]This Indicator is known as Cumulative Volume Delta (CVD), and it represents the total difference between buying and selling pressure.
This indicator use intrabar analysis to strike a balance between the most straightforward and accurate approaches of computing volume delta.
Intrabar analysis is the most accurate method to determine volume delta on historical bars on our charts when TradingView does not currently have historical tick data available.
What is included in the indicator:
Candle Type CVD
Line Type CVD
Aggregated Data which is derived from different exchanges
● Binance
● Bybit
● OKX
● Delta
● WooNetwork
You can choose between Aggregated Data or Single Data by choice.
Aggregated Data - Gathered Data from multiple exchanges which is summarize and became one.
Single Data - Data on your current chart.
Aggregated Data for CVD is still limited to BTC pair as of the moment. The indicator automatically switches to Single Data Type if the opened chart is not a BTC pair.
Candle Colors are fully customizable just like the Tradingview candle settings.
This indicator is mostly compatible to all Crypto.
NOTE: Most code is derived from my library to keep everything neat and clean.

Aggregated Volume Spot & Futures ⚉ OVERVIEW ⚉
The indicator presents a comprehensive approach to Aggregated Volume Data . Works on almost all CRYPTO Tickers!
The script also includes several input parameters that allow the user to control which exchanges and currencies are included in the aggregated data.
This script allows the user to choose from several data display modes, including volume, spot & perp, delta, cumulative delta, and others.
The user can also choose how volume is displayed (in assets, U.S. dollars or euros) and how it is calculated (sum, average, median, or dispersion).
WARNING Indicator is for CRYPTO ONLY.
______________________
⚉ SETTINGS ⚉
‾‾‾‾‾‾‾‾‾‾‾‾‾‾‾‾‾‾‾‾‾‾
Mode — Choose Mode.
• Volume — This displays the Volume
• Volume (Colored) — Shows aggregated volume but applying different volume colors for different exchanges.
• Delta — This displays the difference between the number of sellers and buyers.
• Cumulative Delta — This displays the cumulative delta between sellers and buyers.
• Spot & Perp — Shows Spot and Futures volume at the same time.
• Delta (Spot - Perp) — Shows the difference between Spot and Futures Volume.
• Liquidations — Displays Potential Liquidations. (Calculated between the difference in volume between Futures and Spots)
• OBV — On Balance Volume.
• MFI — Money Flow Indicator.
• Data Type — Choose Single or Aggregated data.
• Single — Show only current Volume.
• Aggregated — Show Aggregated Volume.
Volume By — You can also select how the volume is displayed.
• COIN — Volume in Actives.
• USD — Volume in United Stated Dollar.
• EUR — Volume in European Union.
• RUB — Volume in Russian Ruble.
Calculate By — Choose how Aggregated Volume it is calculated.
• SUM — This displays the total volume from all sources.
• AVG — This displays the average price of the volume from all sources.
• MEDIAN — This displays the median volume from all sources.
• VARIANCE — This displays the variance of the volume from all sources.
* 🡅 Be Careful, Reacts to Every Mode.
Additional features
• Show MA — Show Movieng Average of Volume.
• MA Period — Period of MA.
• Lookback — Lookback period for 'Cumulative Delta' and for 'MFI'.
• Liquidation Filter — Filters out small or negative difference values.
• Show Table — Table shows the current volume of the last candle. Also in the Mode "Colored" shows the color of exchanges if they have volume.
________________
⚉ NOTES ⚉
‾‾‾‾‾‾‾‾‾‾‾‾‾‾‾‾
I don't pretend to be the best choice for calculating CVD , Delta and Liquidations, the calculations are chosen to be optimal from what I have seen and know.
If you have any ideas what to add to my work to add more sources or make calculations cooler, suggest in DM .

Liquidation Levels - By LeviathanThis indicator generates liquidation levels of over-leveraged traders and utilizes a variety of different tools to analyze data such as Open Interest and Volume to provide an edge in your trading system and help you with valuable market insights.
The concept of this indicator is inspired by the platform Hyblock and their Liquidation Levels tool.
The script offers a lot of flexibility in settings, so please read these instructions and test out different parameters to see what works best for you. Here is a short overview of all inputs, one by one.
PRIMARY SOURCE OF DATA
This input allows you to choose the primary source of data that the script uses to calculate liquidation levels. I encourage you to test them all and see which works best for the assets and timeframes you trade. You can also regularly switch between to see confluences.
My personal favorite inputs (and also most accurate ones) are Open Interest, Open Interest + Volume (OI+VOL), and Open Interest + CVD (OI+CVD), as they utilize Open Interest in the calculations, which is the most important factor when it comes to analyzing position opening/closing and market activity in general. The other options that do not include Open Interest (Volume, CVD) were mainly added to provide the possibility to use the indicator on pairs where OI data is not available. Please note that this indicator is built on Tradingview and can only use data (e.g., Open Interest) provided by Tradingview, which is unfortunately quite limited. This is why I recommend using the script with OI-based data source inputs on Binance's perpetual futures pairs, as this is where OI data is available. The volume-based data source inputs can be used on spot pairs, forex, indices, and other markets, where Open Interest data is not provided.
To summarize the use of Primary Source of Data input:
1. Open Interest - use on Binance’s perpetual futures or anywhere else where OI data is available
2. OI + VOL - use on Binance’s perpetual futures or anywhere else where OI data is available
3. OI + CVD - use on Binance’s perpetual futures or anywhere else where OI data is available
4. CVD - use on any pair you wish
5. Volume - use on any pair you wish
DIRECTIONAL BIAS
If turned on, the Directional bias function uses volume and some other calculations to predict which side’s liquidation levels are more likely to be filled and only keep those levels on your chart.
- Directional Bias for Liquidation Levels
Turned ON: only one side’s liquidation levels are shown on the chart
Turned OFF: all liquidation levels are shown on the chart
- Directional Bias for Liquidation Level Bubbles
Turned ON: only one side’s liquidation level bubbles are shown on the chart
Turned OFF: all liquidation level bubbles are shown on the chart
I've separated directional bias options between Liquidation Levels and Liquidation Level Bubbles because sometimes it can be useful to have one of them ON and the other one OFF.
REDUCE SENSITIVITY
The Reduce Sensitivity option allows you to multiply the thresholds for "Smaller Size Liquidation," "Medium Size Liquidation," and "Large Size Liquidation" simultaneously. This is a useful feature as it enables you to easily filter larger positions and their liquidations without having to manually alter the standard deviation multipliers, which will be discussed in further detail later in the article.
The default value is 1, which means that it does nothing.
Increasing it above 1 will increase all thresholds and therefore generate fewer liquidation levels but with larger relative sizes.
Decreasing it below 1 will lower all thresholds and therefore generate more liquidation levels but with both smaller and larger relative sizes.
BASE
This input gives you the possibility to choose between four different bases, from which the liquidation levels will be generated.
CLOSE ⇒ Levels are plotted above and below the close of the candle
HALF ⇒ Levels are plotted above and below the middle of the candle ((high+low)/2)
VWAP ⇒ Levels are plotted above and below the volume-weighted average price
VWMA ⇒ Levels are plotted above and below the volume-weighted moving average
I suggest that you backtest them and see what works best for you.
LIQUIDATION LEVEL BUBBLES
If enabled, "Liquidation Level Bubbles" mark the beginning of a new liquidation level and indicate the relative size of liquidations that would occur if the price were to reach that level.
Liquidation Bubbles or Liquidation Levels in general appear when there is a large influx of new positions and logically, (significant) new positions lead to (significant) new liquidation levels. Liquidation Bubbles can be used to estimate the size and therefore significance of a given liquidation level. It could be argued that the price is more likely to be attracted to larger Liquidation Level Bubbles. While this is often true, it is not always the case as the strong momentum created by large positions can sustain for a prolonged period before reversing and filling the remaining levels Similarly to other features in this indicator, significant new positions are identified and filtered using standard deviation thresholds and their multipliers. New positions are considered significant when newly opened positions exceed the threshold for "Smaller Size Liquidation," leading to the creation of new liquidation levels and bubbles.
1. If new positions exceed the first standard deviation multiplier ("Smaller Size Liquidation Level"), but do not exceed “Medium Size Liquidation Level”, a smaller-sized bubble appears.
2. If new positions exceed the second standard deviation multiplier (”Medium Size Liquidation Level”), but do not exceed “Large Size Liquidation Level”, a medium-sized bubble appears.
3. If new positions surpass the third standard deviation multiplier (”Large Size Liquidation Level”), a large-sized bubble appears.
Significant opened positions are identified and filtered by size using three "thresholds" in the form of standard deviations, which can be modified in the indicator settings, in the section called "Standard Deviation Multipliers".
**Increasing** the standard deviation multipliers of Liquidation Level Bubbles effectively increases the threshold for a given bubble to occur, making the conditions for its appearance stricter.
⇒ Fewer Liquidation Levels - just larger positions are included
**Decreasing** the standard deviation multipliers of Liquidation Level Bubbles effectively decreases the threshold for a given bubble to occur, making the conditions for its appearance looser.
⇒ More Liquidation Levels - smaller positions are included
Keep in mind that this should always be the case:
*Smaller Size Liquidation Level < Medium Size Liquidation Level < Large Size Liquidation Level*
MARKET ORDER BUBBLES
"Market Order Bubbles" is my experimental concept used as a way to analyze large volumes and visualize the market activity at significant levels under certain conditions. It is based on my imitation of CVD which is also used in other parts of the script. The aim of this concept is to give you an idea about the real-time heavy market buying and selling, which could indicate eg. large liquidations, large entries/exits. in order to add confluence to your analysis. Please note that this concept is still in its early stages and may be confusing as it might have been poorly implemented. I recommend taking the time to thoroughly read through this section in order to fully understand it. On the other hand, early backtesting results appear very promising, as the win rate of countertrading buy and sell bubbles under certain conditions was fairly high (70%). I will continue working on this tool, so stay tuned for future updates.
**Market Buy Order Bubbles** appear above the price and possibly signal the following:
- Short positions being liquidated (exit short = buy order)
- New traders entering late longs based on FOMO (enter long = buy order)
- New short positions (sells) of “smarter” traders absorbing liquidated/closed shorts (buys)
⇒ Possible reversal to the downside - look for the liquidation levels of longs to get filled
**Market Sell Order Bubbles** appear below the price and possibly signal the following:
- Long positions being liquidated (exit long = sell order)
- New traders entering late shorts based on FOMO (enter short = sell order)
- New long positions (buys) of “smarter” traders absorbing liquidated/closed longs (sells)
⇒ Possible reversal to the upside - look for the liquidation levels of shorts to get filled
significant volumes are identified and filtered using three “thresholds” in the form of standard deviations, which can be modified in indicator settings.
1. If buy/sell volume surpasses the first standard deviation (”**Smaller Size Market Orders**”), then the **smaller-sized bubble** appears.
2. If buy/sell volume surpasses the second standard deviation (”**Medium Size Market Orders**”), then the **medium-sized bubble** appears.
3. If buy/sell volume surpasses the third standard deviation (”**Large Size Market Orders**”), then the **large-sized bubble** appears.
**Increasing** the standard deviation multipliers effectively increases the threshold for a given bubble to appear, making the conditions for its occurrence more strict.
**Decreasing** the standard deviation multipliers effectively decreases the threshold for a given bubble to appear, making the conditions for its occurrence more strict.
Keep in mind that this should always be the case:
*Smaller Size Market Orders < Medium Size Market Orders < Large Size Market Orders*
COLOR CANDLES
The Color Candles function is a useful and interesting feature that will enhance your analysis with additional context. If enabled, the indicator will color the chart's candles based on different data. Currently, there are three options to choose from, with more to be added in future updates.
Color Candles: OI DELTA
This option will color the candles to reflect Open Interest Delta. If there is a net increase in open positions (positive Open Interest Delta), the candle will be colored green. If there is a net decrease in open positions (negative Open Interest Delta), the candle will be colored red. It is important to note that this option only functions on pairs for which Tradingview provides OI data
Color Candles: VOLUME
This option utilizes volume data to help you identify the trend and momentum, coloring the candles accordingly - upward impulses are colored green and downward impulses are colored red. This makes it easier to recognize trend reversals and adjust your directional bias accordingly.
Color Candles: STOCH
This option uses the Stochastic Oscillator and SMA to color the candles, helping you identify momentum as upward green moves transition to downward red moves and vice versa.
LEVERAGE RATIO
Leverage ratio is another experimental concept I have added to this script. If turned on, it provides a broad insight into whether the market is relatively over-leveraged or if the leverage is relatively low. The aim is to use it as a confluence in anticipating incoming volatility and possibly use it to understand other aspects of market activity. It is still in its early stages of development and needless to say, it only works on pairs where Open Interest data is provided by Tradingview.
Crosses above price = Leverage is relatively high
Crosses below price = Leverage is relatively low
MARKET INFO SCREENER, LEVEL LEGEND, HIDE FILLED LINES
The last three inputs of Basic Settings section:
”The Market Info Screener” feature will display a small panel on the right side of your chart that provides useful data about the market, including Open Interest, Volume, the aggressive side of traders, and the Leverage Ratio. More data coming in future updates.
"Level Legend" option will display a small legend on the right side of the chart, helping you or others viewing the chart to understand what the objects on the chart mean.
"Hide Filled Lines" option will hide liquidation levels that have already been filled, only displaying the active ones in order to reduce clutter on your chart.
APPEARANCE
The “Appearance” settings offer a variety of modifications for colors, styles, and visibility.
The "Line Style" input allows you to choose the style and width of the liquidation level lines. You can also select which levels to display, as well as the color of the liquidation level lines and bubbles. The "Max Number of Lines" input allows you to specify the number of level lines you want on a chart. If you feel that there is too much clutter, you can decrease this number, and old lines will be removed. Please note that Tradingview has a built-in limit of 500 lines on a given chart, so this value cannot be set above 500. The "Market Buy/Sell Bubble Style" input can be used to modify the color and style of the market order bubbles. Enabling the "Show Settings Screener" option will display a screener with a list of all your settings on the right side of the chart, making it easier to share your preferred settings with others."
STANDARD DEVIATION MULTIPLIERS
This is where you can set the standard deviation thresholds for Liquidation Levels and Market Order Bubbles. These values can be customized to your preference, as the default values may not be suitable for your needs or you may want to experiment with different values to see more or fewer liquidation levels or market order bubbles on your chart. Personally, I sometimes use this feature to increase the Large Size Market Orders or Large Size Liquidation Levels multipliers so that large-sized bubbles are only assigned to extremely large positions or volumes.
If you want to only analyze larger positions or volumes, you can increase the "Smaller Size" multipliers, which act as a minimum threshold.
If you also want to include even smaller positions or volumes in your analysis, you can decrease the values of the "Smaller Size" multipliers, which act as a minimum threshold
Please note that the "Reduce Sensitivity" option in Basic Settings affects the standard deviation multipliers of the liquidation levels. Changing the "Reduce Sensitivity" value will equally multiply all of them (the ratio between Smaller, Medium, and Large multiplier values will remain the same)
STANDARD DEVIATION LENGTH
"Standard Deviation Length" defines the length (number of bars) used in all calculations that utilize the standard deviation function in this script. Decreasing it will generate Liquidation Levels and Liquidation Bubbles based more on recent data. Increasing it will generate Liquidation Levels and Liquidation Bubbles based on more long-term data.
CVD LENGTH
"CVD Length" refers to the length used in calculating cumulative volumes. Decreasing it will generate Liquidation Levels, Market Order Bubbles, and apply Directional bias based more on recent data. Increasing it will generate those based on more long-term data."
LEVEL CALCULATION MODES
“Level Calculation Modes” enable you to switch between three modes of calculating the distance between the base and actual liquidation levels.
COPYRIGHT
"Copyright" option will add your username to the copyright section at the bottom of the chart, giving you credit for your analysis if you post it somewhere.
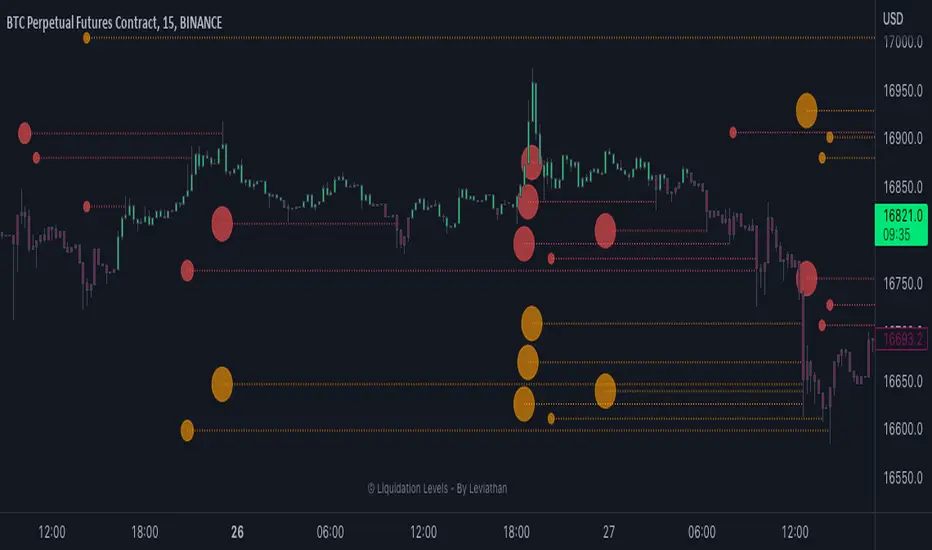
Open Interest Profile (OI)- By LeviathanThis script implements the concept of Open Interest Profile, which can help you analyze the activity of traders and identify the price levels where they are opening/closing their positions. This data can serve as a confluence for finding the areas of support and resistance , targets and placing stop losses. OI profiles can be viewed in the ranges of days, weeks, months, Tokyo sessions, London sessions and New York sessions.
A short introduction to Open Interest
Open Interest is a metric that measures the total amount of open derivatives contracts in a specific market at a given time. A valid contract is formed by both a buyer who opens a long position and a seller who opens a short position. This means that OI represents the total value of all open longs and all open shorts, divided by two. For example, if Open Interest is showing a value of $1B, it means that there is $1B worth of long and $1B worth of short contracts currently open/unsettled in a given market.
OI increasing = new long and short contracts are entering the market
OI decreasing = long and short contracts are exiting the market
OI unchanged = the net amount of positions remains the same (no new entries/exits or just a transfer of contracts occurring)
About this indicator
*This script is basically a modified version of my previous "Market Sessions and Volume Profile by @LeviathanCapital" indicator but this time, profiles are generated from Tradingview Open Interest data instead of volume (+ some other changes).
The usual representation of OI shows Open Interest value and its change based on time (for a particular day, time frame or each given candle). This indicator takes the data and plots it in a way where you can see the OI activity (change in OI) based on price levels. To put it simply, instead of observing WHEN (time) positions are entering/exiting the market, you can now see WHERE (price) positions are entering/exiting the market. This is the same concept as when it comes to Volume and Volume profile and therefore, similar strategies and ways of understanding the given data can be applied here. You can even combine the two to gain an edge (eg. high OI increase + Volume Profile showing dominant market selling = possible aggressive shorts taking place)
Green nodes = OI increase
Red nodes = OI decrease
A cluster of large green nodes can be used for support and resistance levels (*trapped traders theory) or targets (lots of liquidations and stop losses above/below), OI Profile gaps can present an objective for the price to fill them (liquidity gaps, imbalances, inefficiencies, etc), and more.
Indicator settings
1. Session/Lookback - Choose the range from where the OI Profile will be generated
2. OI Profile Mode - Mode 1 (shows only OI increase), Mode 2 (shows both OI increase and decrease), Mode 3 (shows OI decrease on left side and OI increase on the right side).
3. Show OI Value Area - Shows the area where most OI activity took place (useful as a range or S/R level )
4. Show Session Box - Shows the box around chosen sessions/lookback
5. Show Profile - Show/hide OI Profile
6. Show Current Session - Show/hide the ongoing session
7. Show Session Labels - Show/hide the text labels for each session
8. Resolution - The higher the value, the more refined a profile is, but fewer profiles are shown on the chart
9. OI Value Area % - Choose the percentage of VA (same as in Volume Profile's VA)
10. Smooth OI Data - Useful for assets that have very large spikes in OI over large bars, helps create better profiles
11. OI Increase - Pick the color of OI increase nodes in the profile
12. OI Decrease - Pick the color of OI decrease nodes in the profile
13. Value Area Box - Pick the color of the Value Area Box
14. Session Box Thickness - Pick the thickness of the lines surrounding the chosen sessions
Advice
The indicator calculates the profile based on candles - the more candles you can show, the better profile will be formed. This means that it's best to view most sessions on timeframes like 15min or lower. The only exception is the Monthly profile, where timeframes above 15min should be used. Just take a few minutes and switch between timeframes and sessions and you will figure out the optimal settings.
This is the first version of Open Interest Profile script so please understand that it will be improved in future updates.
Thank you for your support.
** Some profile generation elements are inspired by @LonesomeTheBlue's volume profile script
