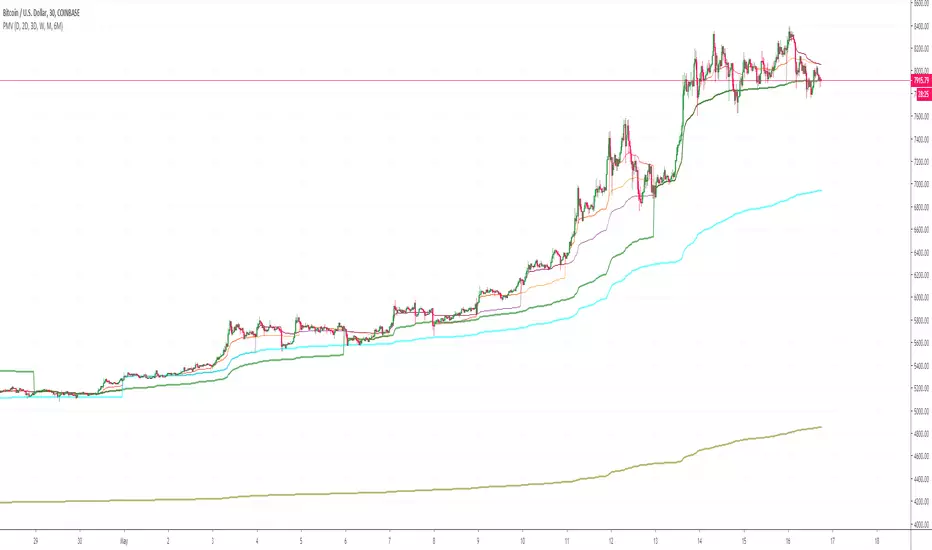
EM_RSI Gradient Candles
I've missed the beautiful trend visualization of Heiken Ashi candles ever since I first learned they don't play well with other indicators largely due to the method with which they're plotted.
I wanted to color code a gradient onto candles to help visualize trend strength, and the Relative Strength Index was the first thing to come to mind. For coloring, it's possible the new color.from_gradient function would have worked, but I couldn't guarantee a highly customizable indicator with a single gradient so I took a more classic approach.
First, RSI was calculated using Tradingview's built-in RSI code.
Then I broke down the RSI's range of 1-100 into 10 tiers and assigned each a color option with the ability to turn any particular tier off if desired.
I found it to be extremely modular and helpful in visualizing both trend strength and identifying potential trend reversals due to a reduction in strength.
You can use it on every candle to help inform decisions, or keep all but <10 and >90 turned off so that it only changes candle color during the most extreme trends.
Or anything in between!
This is my first self-coded indicator so I'm already proud.
Please let me know what you think, and feel free to suggest improvements for future versions in the comments!
Customizable

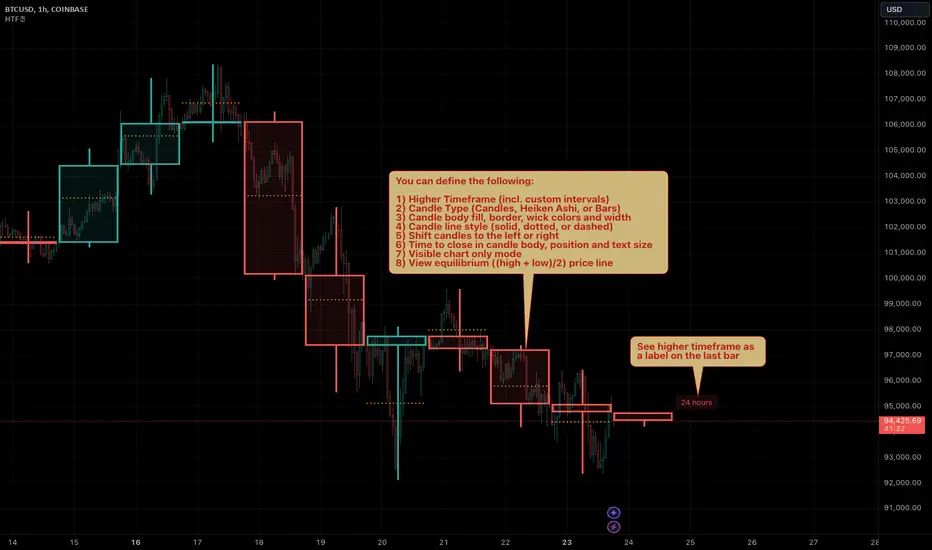
HTF Candles by Prosum SolutionsOverview of Features
This indicator was inspired by the work of "informanerd" in the script called "HTF Candles" as well as the built-in script called "Multi-Time Period Charts" by TradingView. The script will provide a highly customizable interface to specify the higher timeframe resolution for the candlesticks, the type of candle, as well as various styling options for the body, borders and wicks.
Usage Information
The indicator can be applied to any chart at any time frame, but resolutions less than 1 minute may demonstrate gaps between bars and the candles may not render properly.
When the "Same as chart" option is chosen for the "Resolution" field, the indicator will attempt to find a higher timeframe resolution to ensure the candlesticks are drawn.
Enjoy! 👍
Stochastic RSI - DurbtradeDurbtrade Stoch RSI -
1) Stoch RSI
A) The K line can be customized to change color based on vertical direction.
B) The space between K line and D line can be filled with a color depending on whether K line is above or below the D line.
C) There are color-coded, cross-over and cross-under background fills, to signal when the K line crosses the D line.
D) K line is drawn in front of D line (D line is drawn behind K line).
E) Default values : K = 3, D = 4, RSI Length = 14, Stoch Length = 14
2) Horizontal Lines
A) Horizontal lines can be drawn automatically, so you don't have to draw them, and they don't extend past the current bar.
B) There are 11 customizable horizontal lines,
and each line is set to non-customizable increments (zero, 10, 20, 30, 40, fifty, 60, 70, 80, 90, hundred).
C) The 11 lines are divided into 2 groups:
a) 4 PAIRS of lines WITH fill options (10/90, 20/80, 30/70, 40/60... 8 lines total), and
b) 3 INDIVIDUAL lines WITHOUT fill options (zero, fifty, hundred).
D) The 4 fills give you the option to fill the space between each pair with a customizable color and opacity,
regardless of whether the lines themselves are drawn or not.
(all default values are what I feel work best for this indicator...
and initially, only the zero, fifty, and hundred lines are drawn automatically .
You may add the other lines if you choose to, by adjusting the opacity to your liking).
3) Conclusion
A) As with my previous indicators, this one maximizes information, color, discernment, clarity, and customization.
B) It is optimized for your ability to be able to easily customize the indicator according to your preferences...
for use on your own personal television, laptop, or cellular phone screen setup... and on all chart zoom levels and layouts.
C) Please feel free to comment your thoughts, critiques, or suggestions. They are all helpful!
D) Check out my previous pine script indicators if you like this one. They work really well together.
E) I hope that you find this script useful.
F) Enjoy!
//Durbtrade

(IK) Base Break BuyThis strategy first calculates areas of support (bases), and then enters trades if that support is broken. The idea is to profit off of retracement. Dollar-cost-averaging safety orders are key here. This strategy takes into account a .1% commission, and tests are done with an initial capital of 100.00 USD. This only goes long.
The strategy is highly customizable. I've set the default values to suit ETH/USD 15m. If you're trading this on another ticker or timeframe, make sure to play around with the settings. There is an explanation of each input in the script comments. I found this to be profitable across most 'common sense' values for settings, but tweaking led to some pretty promising results. I leaned more towards high risk/high trade volume.
Always remember though: historical performance is no guarantee of future behavior . Keep settings within your personal risk tolerance, even if it promises better profit. Anyone can write a 100% profitable script if they assume price always eventually goes up.
Check the script comments for more details, but, briefly, you can customize:
-How many bases to keep track of at once
-How those bases are calculated
-What defines a 'base break'
-Order amounts
-Safety order count
-Stop loss
Here's the basic algorithm:
-Identify support.
--Have previous candles found bottoms in the same area of the current candle bottom?
--Is this support unique enough from other areas of support?
-Determine if support is broken.
--Has the price crossed under support quickly and with certainty?
-Enter trade with a percentage of initial capital.
-Execute safety orders if price continues to drop.
-Exit trade at profit target or stop loss.
Take profit is dynamic and calculated on order entry. The bigger the 'break', the higher your take profit percentage. This target percentage is based on average position size, so as safety orders are filled, and average position size comes down, the target profit becomes easier to reach.
Stop loss can be calculated one of two ways, either a static level based on initial entry, or a dynamic level based on average position size. If you use the latter (default), be aware, your real losses will be greater than your stated stop loss percentage . For example:
-stop loss = 15%, capital = 100.00, safety order threshold = 10%
-you buy $50 worth of shares at $1 - price average is $1
-you safety $25 worth of shares at $0.9 - price average is $0.966
-you safety $25 worth of shares at $0.8. - price average is $0.925
-you get stopped out at 0.925 * (1-.15) = $0.78625, and you're left with $78.62.
This is a realized loss of ~21.4% with a stop loss set to 15%. The larger your safety order threshold, the larger your real loss in comparison to your stop loss percentage, and vice versa.
Indicator plots show the calculated bases in white. The closest base below price is yellow. If that base is broken, it turns purple. Once a trade is entered, profit target is shown in silver and stop loss in red.

RSI Relative Strength Index 3X - DurbtradeDurbtrade Triple RSI - 3 individual RSI's on 1 indicator, each distinguishable by length, as well as line color, thickness, opacity, and type.
(note: usable line TYPES are limited... try experimenting)
1) RSI's
A) Each RSI can be customized to change color based on RSI vertical direction (default = only RSI #1 changes color).
B) All 3 RSI's use a single Source (default Close).
C) You may customize the length of each RSI individually (I LOVE my default 14, 7, and 3!).
D) RSI #1 is the primary RSI, and is plotted LAST, so that it is drawn ABOVE RSI #2, which is drawn above RSI #3.
2) Horizontal Lines
A) Horizontal lines are also drawn automatically, so you don't have to, and they don't extend past the current bar.
B) There are 11 customizable lines, and each one is set to non-customizable increments (zero, 10, 20, 30, 40, fifty, 60, 70, 80, 90, hundred).
C) The 11 lines are divided into 2 groups:
a) 4 PAIRS of lines WITH fill options (10/90, 20/80, 30/70, 40/60... 8 lines total), and
b) 3 INDIVIDUAL lines WITHOUT fill options (zero, fifty, hundred).
D) The 4 fills give you the option to fill the space between each pair with a customizable color and opacity (the default is what I personally feel is best for each).
3) Conclusion
A) As with my previous indicators, this one maximizes information, discernment, clarity, and customization.
B) It is optimized for your ability to be able to customize a relatively basic but important indicator with ease
for use on your own personal television, laptop, or cellular phone screen setup... and on all chart zoom levels and layouts.
B) And, this being my 3rd script, please feel free to comment, critique, or leave suggestions. I find them helpful!
C) Check out my previous pine scripts if you like this one. They work well together.
D) I hope that you find this useful.
E) Enjoy!
//Durbtrade

[SK] Fibonacci Auto Trend ScouterThe FATS - Fibonacci Auto Trend Scouter automatically draws active trends from 2 different timeframes along with Fibonacci Support and Resistance levels. It also has a Sights feature for each timeframe which points from it's middle towards the current price. The tool is also highly customizable for you to take this indicator over 9000. If you like the tool and it adds value to you - share the love on the like button and visit my profile to check out my other indicators and subscribe, so you're notified of my next scripts and ideas!
Automatic Trend Lines
The indicator takes in 2 timeframes to detect High and Low values from which to draw the trend lines of each timeframe.
As the values change with price movement, the lines are updated. They are color coded for uptrend and downtrend based on the direction of each individual line. Trend lines can be set up to color with only the default value on the configurations panel.
- Toggle on/off Color Coded
- Change Default, Uptrend, Downtrend color
- Change Line Width
- Change Line Style
- Toggle on/off Line Extensions
- Change Extended Line Width
- Change Extended Line Style
- Toggle On/Off labels for 7 data points of each timeframe
Automatic Trend Sights
This is a neat feature that may help you get a better feel for the direction the current movement is heading towards in correlation with the short or medium length timeframe trends. The sight draws a line from the middle vertical point of the trend coordinates towards the current price. They are toggled off by default but can be enabled in the configurations panel.
- Toggle on/off sight on each timeframe
- Change Width
- Change Line Style
Automatic Fibonacci Levels
The tool has a very useful feature to automatically detect the highest and lowest value from the short timeframe to calculate Fibonacci support and resistant levels. To keep the chart area clean, the lines are drawn short by default towards the right side of the price but provide inputs to increase the size of the level lines towards the left and right direction. A triangle label appears to the side of each line which holds the Fibonacci level and price data inside the tooltip, hover over them to activate.
- Toggle on/off color coded
- Change Default, Resistance, Support colors
- Change line size towards the left and right side
- Change line width
- Change Resistance line style
- Change Support line style
- Toggle on/off High and Low source line
- Toggle on/off High and Low source labels

[SK] Custom Klinger OscillatorThis Custom Klinger Oscillator allows you to change the time frames for the Force Volume and Signal calculations to use instead of it's default values. Although the default Fibonacci values ( 34, 55 and 13 ) provide exceptional signals, you can now explore using lower Fibonacci numbers and get faster signals for your own adventures in the market.
This indicator adds conditional coloring of the Klinger line when over / under the signal along with a transparent fill cloud between both lines colored by the same condition. You can change colors to your preference on the style configurations.
--
Below is more information on the KIinger Oscillator from investopedia:
Interpretations for Price Direction
The Klinger Oscillator is fairly complex to calculate, but it's based on the idea of force volume, which accounts for volume, trend (positive or negative), and temp (based on multiple inputs and if/then statements). Using this data, the oscillator is created by looking at the difference between two exponential moving averages of force volume involving different time frames (typically 34 and 55). The idea is to show how the volume flowing through the securities is impacting its long-term and short-term price direction.
The Signal Line
A signal line (13-period moving average) is used to trigger buy or sell signals. This technique is very similar to signals that are created with other indicators such as the moving average convergence divergence (MACD). While these are the basic signals generated by these indicators, it's important to note that these techniques may generate a lot of trading signals that may not be as effective in sideways markets.
The Uptrend
When an asset is in an overall uptrend—such as when it is above its 100-period moving average and the Klinger is above zero or moving above zero—traders could buy when the Klinger oscillator moves above the signal line from below.
Klinger noted that when a stock was in an uptrend, and then dropped to unusually low levels below zero, and then moved above its signal line, this was a favorable long position to take.
The Downtrend
When an asset is in an overall downtrend, traders could sell or short-sell when the Klinger oscillator moves below the signal line from above. Klinger noted this was especially noteworthy when the indicator had seen an uncharacteristic spike above zero.
The zero line is also used by some traders to mark the transition from an uptrend to downtrend, or vice versa. While such signals won't always agree with price movements, a move above zero helps confirm a rising price, while a drop below zero helps confirm a falling price.
Klinger Oscillator and Divergence
The Klinger oscillator also uses divergence to identify when the indicator's inputs are not confirming the direction of the price move. It's a bullish sign when the value of the indicator is heading upward while the price of the security continues to fall. It is a bearish signal when the price is rising but the indicator is falling. Divergence can be coupled with signal line crossovers to generate trades. For example, if a bearish divergence forms, a sell or short-sell could be initiated the next time the Klinger crosses below the signal line.

[SK] Double MACDThe Double MACD indicator is precisely two different MACD indicators plotted on the same axis for precise visual correlation between each other.
This correlation provides more information than a single regular MACD by allowing you to compare the signals of a shorter timeframe to the default or longer timeframe,
showing the strength of the change in momentum and the peak of the momentum between both configurations.
The indicator has cloud options by default if you toggle on the MACD / Signal lines for better readability.
The cloud will change color to the line on top of it's set. This is to help you not get lost in the 4 different lines.
Customize the indicator to your preference and make it your own
If you'd like a candle like visualization, change the short MACD plot style to a histogram.
For a beautiful double bars style, select bars on both configurations and set the transparency to 30 - 40
For a dynamic moving average style, go with the line plot style ( default )
All MACD/Signal lines are toggled off by default, toggle them on in the inputs section.
On the styles panel, you can turn off the cloud fills or the lines.
Change all the colors you'd like!

Customizable MA RibbonAll credits to @Violent (www.tradingview.com) for making the original code! I just updated it by adding new features and themes!
---------------------------------------------
Lemon's Customizable MA Ribbon:
---------------------------------------------
A series of moving averages of different lengths that create a ribbon-like indicator. Traders can determine trend strength by lookin at the distance between the moving averages and the overall balance of the colored lines. Price movements through the ribbon can also be used to identify trend changes.
------------
FEATURES
------------
MA TYPES: SMA , EMA , WMA, RMA, ALMA, VWMA, HMA
Editable length
Editable start
User defined number of plots to show (between 1 to 32 total plots)
Multiple color theme choices
A color smoothing option.
Thank you and happy trading!
with love,
-Lemon

Perigraph's Customizable Multi VWAP LinesCustomizable Multi VWAP Lines
input examples:
30, 60, 120, 180, 240,360,480, 720 = minutes
D = Days
W = Weeks
M = months
12M = 12 Months