Logic Flow Signals & Backtest [bercutiatia]To understand the advanced logic of the tool, it is essential that you carefully read each topic and check the visual examples in this presentation.
--
Who is the Logic Flow Signals & Backtest tool recommended for?
Ideal for traders looking to increase the reliability and level of their operations. Recommended for those who want to create rigorous confluences, validate strategies with backtesting, and transform emotional management into systematic and measurable processes.
How can the Logic Flow Signals & Backtest tool help me?
High-confidence signals! You combine TradingView indicators and create a single robust signal, eliminating the frustration of having to spend hours in front of the chart and still clicking at the wrong time. This ensures that your entry is validated by logic, not emotional impulse.
--
Logic Flow Signals & Backtest is a versatile and powerful tool designed to test and validate your trading ideas with indicators from the TradingView community.
Extreme flexibility: Allows you to combine indicators available on TradingView (EMAs, RSI, MACD, SMC, etc.) to create custom entry and exit logics.
Sequential Logic: Goes far beyond simple crossovers. You can define rules where signal A must occur before signal B — and, if desired, before signal C or D — to validate an entry. Add time, order, and context filters, creating truly intelligent sequential logic that generates a single final alert only when all conditions align.
With Stages (Stage 1, Stage 2, etc.), your entries follow the exact sequence you define. And the best part: you no longer need to spend hours in front of the chart waiting for confluences. Simply set up your stages once, create an alert in TradingView, and the system will automatically notify you when the ideal combination of signals occurs.
Sequence Invalidation: Offers the option to define conditions that, if they occur, immediately cancel an ongoing entry sequence, helping to avoid entries in unfavorable scenarios.
Explaining the first image example (chart below):
LONG INDICATOR 1 (Stage 1): The market confirms a change in character (CHoCH Bullish). The system enters an alert state awaiting the confluence of the next indicators.
LONG INDICATOR 2 and 3 (Stage 2): Entry is only released when the SMA17 crosses above the SMA72 (indicator 2), but with one condition: The SMA72 must be ABOVE the SMA305 (indicator 3); Without this alignment of indicator 3, the signal of indicator 2 does not occur.
LONG INDICATOR 4 (Invalidation Rule): If at any point in the sequence the SMA72 crosses below the SMA305, the setup is immediately canceled and no entry signal is generated. The sequence restarts with indicator 1.
EXIT LONG (Hybrid Exit TP + SIGNAL): The trade seeks a TP target of 1000 ticks, but has a technical "Trailing Stop": if the trend reverses (Exit Long Indicator 1 = SMA72 crosses below the SMA305) before the target, the position is closed to protect capital.
SHORT INDICATOR 1 (Stage 1): Identification of weakness in the market with a Bearish CHoCH.
SHORT INDICATOR 2 and 3 (Stage 2): Entry is only released when the SMA17 crosses below the SMA72 (indicator 2), but with a strict condition: The SMA72 must be BELOW the SMA305 (indicator 3); Without this STATE of indicator 3, the signal from indicator 2 does not occur.
SHORT INDICATOR 4 (Invalidation Rule): If at any point in the sequence the SMA72 crosses above the SMA305, the setup is immediately canceled and no entry signal is generated. The sequence starts again with indicator 1.
EXIT SHORT (Hybrid Exit TP + SIGNAL): The trade seeks a target of 1000 ticks, but has a technical "Trailing Stop": if the downtrend reverses (Exit Short Indicator 1 = SMA72 crosses above the SMA305) before the target, the position is closed to protect capital.
In this strategy, we use the external indicators: Multiple MTF MA and Smart Money Concepts (Advanced)
--
Stage Duration: In STAGE DURATION , you control the maximum time (in candles) allowed for each transition between stages to occur. If the time limit expires before the next stage is reached, the sequence is reset. Keep it at 0 to disable the time limit.
The "Stage Duration" function is available in four separate blocks on the settings panel:
- LONG - STAGE DURATION: Controls the time limit (in candles) between Long entry stages (for example from Stage 1 to Stage 2).
- LONG EXIT - STAGE DURATION: Controls the time limit between Long exit stages.
- SHORT - STAGE DURATION: Controls the time limit between Short entry stages.
- SHORT EXIT - STAGE DURATION: Controls the time limit between Short exit stages.
Explaining the second image example (chart below):
Stage 1 (INDICATOR 1): New Fair Value Gap (FVG) Bullish Confirmed.
- Meaning: The move starts with a bullish FVG (Fair Value Gap), indicating a confirmed imbalance where buyers were much more aggressive than sellers.
Stage 2 (INDICATOR 2): EMA10 crossing above the EMA50.
- Meaning: Immediately after the FVG trigger, the fast moving average (10 periods) crosses the intermediate moving average (50 periods). This confirms that the initial FVG impulse was not an isolated event but the beginning of a short-term trend.
Stage 3: In this final stage, we require two simultaneous confirmations to validate the entry:
- INDICATOR 3: The EMA10 crosses above the EMA100, indicating that the movement has enough strength to break through larger barriers.
- INDICATOR 4: The RSI must be above its own moving average (SMA14). This ensures the asset is gaining momentum at the exact moment the averages are broken, avoiding entries in "tired" markets.
Stage Duration: The most important feature of this setup is the restricted time window.
- Rule: From Stage 1 to 2, and from Stage 2 to 3, the maximum interval to accept confluences is only 3 candles.
- Why this is vital? If the market took 20 candles to align these conditions, it would indicate weakness or indecision. By demanding that everything happens within a maximum of 3 candles per step, the setup filters only the moves where buying pressure is urgent and aggressive, increasing the probability of an explosive move in favor of the trade.
Asymmetric Risk Management: To complement a high-probability and high-pressure setup, we use aggressive risk management:
- Stop Loss (Technical/Short): 200 Ticks. If the buying pressure fails quickly, we exit early with a small loss.
- Take Profit (Long Target): 1000 Ticks. We aim to ride the impulse "leg" that the setup identified.
- Risk/Reward: 5:1. This means a single winning trade covers five losing trades, making the strategy mathematically viable in the long term.
In this strategy, we use the external indicators: Multiple MTF MA , Smart Money Concepts (Advanced) and Relative Strength Index (RSI) .
--
Multiple Operating Modes
It is not limited to sequences. It can operate by confluence (where all signals must be valid at the same time), by single trigger (only one signal is required), or by "OR" logic (any one of the defined signals).
- If you use only Stage 1 in more than one indicator session, the entry will only occur if all enabled conditions are true simultaneously.
- Any condition defined as OR can trigger the entry by itself.
- If only one condition block is enabled, the single indicator will function as a simple signal.
Multiple and Simultaneous Exits
It allows for the configuration of exits by both indicators and TP/SL targets. The strategy will close the trade as soon as any of these conditions are met first (indicator signal, profit target, or loss limit
Integrated Risk Management
It includes Stop Loss and Take Profit exits by percentage and ticks, which are easy to configure and essential for risk management. The strategy calculates the exact TP and SL prices based on your entry price and monitors the market on every tick.
Explaining the Third Image Example (Chart Below)
The move was validated by a 4-step logical sequence (Stage 1) and managed by a hybrid exit system.
Short Indicator 1, 2, and 3: The price (Close) crossed below the SMA200, SMA72, and SMA17 averages simultaneously.
- What this means: When a single candle has the strength to break below the short-term (17), mid-term (72), and long-term (200) averages, it indicates a high probability for the price to seek lower levels.
To reinforce Indicators 1 through 3, we added an extra layer of confirmation.
Short Indicator 4: The Positive Volume Index (PVI) needed to be below its own long-term average (EMA300).
- Why this is important: PVI below the average confirms that selling volume is dominant, validating that the break of the averages was not just noise.
Triple Exit Management (Maximum Security)
The great advantage of this tool is the ability to manage risk dynamically. In this trade, we configured three simultaneous exit conditions, where the first one to be met closes the position:
1. Financial Target (TP): A fixed Take Profit of 15%.
2. Exit Short Indicator 1 (Technical Exit 1): If the average (SMA72) crosses above the average (SMA200), the trade is closed.
3. Exit Short Indicator 2 (Technical Exit 2): If the PVI crosses above the EMA300, indicating an entry of buying strength, the trade is closed.
"OR" Logic: The tool monitors these conditions in real-time. Whichever occurs first triggers the exit, ensuring you lock in profit (TP) or protect your capital at the first sign from the indicators.
In this strategy, we use the external indicators: Multiple MTF MA and Positive Volume Index .
--
Reversal Mode (Stop and Reverse)
The Reversal Mode (Stop and Reverse) allows a new signal in the opposite direction (e.g., a SELL signal) to automatically close an existing position (e.g., BUY) and open a new one (sell). This "stop and reverse" function can be enabled or disabled in the settings, giving you full control over whether the strategy should only exit (awaiting a new signal) or immediately reverse the position.
Explaining the Fourth Image Example (Chart Below)
In this example, we demonstrate a setup focused on capturing every market "flip," keeping the trader positioned 100% of the time ("Always-in"), a technique widely used in automation.
- Long Entry: Occurs immediately upon confirming a bullish change of character (New CHoCH Bullish).
- Short Entry: Occurs immediately upon confirming a bearish change of character (New CHoCH Bearish).
- Exit (The Differentiator): We are not using fixed TP or SL here. The exit is triggered by Automatic Reversal.
The Power of "Exit by Opposite Signal"
Notice the labels on the chart: "Close Short" followed immediately by a "Long." This happens because the Allow Reversal function is enabled in the tool's settings.
When the market generates a buy signal, the tool understands that the sell thesis has been invalidated. It simultaneously sends an order to close the Short position and open a new Long position.
When to use this exit rule?
- Capturing Long Trends / Directional Movements: Ideal for volatile assets where you want to ride the trend until the market structure effectively changes.
- Operational Simplification: Eliminates the need to guess profit targets and acts as a loss limiter when the price moves against your position. The market dictates when to enter and when to exit.
Hybrid Flexibility:
The strongest point of Logic Flow is that you don't have to choose just one method. Reversal can be used in two ways:
1. Individually (as in the image): Reversal is the only form of exit. You stay in the move until the opposite signal.
2. Combined (Hybrid): You can enable Reversal and configure a safety Stop Loss + technical Take Profit (Exit Long/Short Indicator).
- Example: If the price hits your TP/SL first, you exit. If the market turns before the TP, the Reversal takes you out of the trade and generates a new trend alert.
In this strategy, we use the external indicators: Smart Money Concepts .
--
Backtesting: Far beyond creating logic and generating signals, Logic Flow Signals stands out due to its Integrated Backtest.
Backtesting serves as a reality check for the trader. It takes the strategy out of the realm of "imagination" and puts it to the test against historical data.
Here are the 4 main practical uses:
1. Verifying Feasibility (Proof of Concept): The most obvious use is to answer: "Does this idea make money?". Many strategies look visually perfect on the chart, but when you run the backtest, you discover that brokerage fees or frequent "stops" consume all the profit.
2. Knowing the "Worst-Case Scenario" (Drawdown): Maximum Drawdown: It shows you what the largest accumulated drop the strategy has ever experienced was. By identifying a Drawdown that exceeds the desired risk tolerance, the backtest allows for parameter optimization in search of a more efficient balance between risk and return.
3. Fine-Tuning (Optimization): It allows you to make changes such as: Increasing the profit target, changing the stop, removing an indicator, changing the chart timeframe, among other actions. You can test various variations instantly to find the most efficient configuration.
4. Expectation Management and Discipline: Backtesting does not eliminate fear nor guarantee that the future will repeat the past, but it serves as a reference map.
The Real Role: Aligning expectation with reality.
In the image below, you can check out how a backtest result is generated:
To understand the backtest results shown above, check the chart and the detailed operational logic below:
This operational example seeks to identify altcoins that are demonstrating an explosive decorrelation relative to Bitcoin. The logic is: we want to buy only the assets that are outperforming the market leader, precisely at the moment when speculative money (Open Interest) heavily enters the market.
For the buy signal (Long) to be triggered, three conditions must be simultaneously true (Stage 1):
Long Indicator 1 (Altcoin Strength): The asset's RSI must be above the 70 level (Overbought), indicating extremely strong bullish momentum.
Long Indicator 2 (Bitcoin Weakness): Bitcoin's RSI must be below the 50 level. This confirms that the Altcoin's rally is genuine and independent.
Long Indicator 3 (Money Flow): The Open Interest (open contracts) must be above the Extreme level of the OI DELTA indicator. This validates that new money is aggressively entering the asset to sustain the rally.
Risk Management: In this example, we configured an aggressive target to capture the altcoin volatility:
- Take Profit: 100%
- Stop Loss: 20%
- Risk/Reward: 5:1
In this strategy, we use the external indicators: RSI Crypto Strength (Asset vs BTC) and Open Interest Delta .
--
Configuring an Indicator Block
Each block (BUY INDICATOR 1, BUY INDICATOR 2, ...) allows you to define a complete condition.
- Enable (Activate): Simply turns this indicator block on or off.
- Source A: The first value you want to analyze.
example: The Closing Price (Close), Opening Price (Open), or another TradingView indicator.
- Condition: How 'Source A' will be compared.
example: Crossover/Crossunder, Greater Than, Less Than, Cross Up.
- Comparison Type: The option that defines whether you will compare 'Source A' with a fixed number or with another indicator.
- Fixed Value: Used if you selected "Fixed Value".
example: For an RSI greater than 70 condition, Source A would be the RSI, the Condition would be Greater Than, and the Fixed Value would be 70.
- Source B: Used if you selected "Source B".
example: For a condition where the EMA10 crosses above the EMA200, Source A would be the EMA10, the Condition would be 'Cross Up', and Source B would be the EMA200.
--
Configurable Alert Signals
Configurable Alert Signals: The tool allows for the creation of fully customized alerts for different types of events, such as entries, signal-based exits, take profit, and stop loss. These alerts can be used for both strategy automation and manual, real-time notifications.
The message field is highly flexible: it accepts dynamic placeholders, JSON structure, UUID identifiers, or any custom text, allowing integration with other external tools and systems via webhook.
Configuring Your Messages:
- LONG/SHORT - ALERTS: Defines the message for new entries.
- LONG/SHORT INDICATOR EXIT - ALERTS: Defines the message for signal-based exits (e.g., moving average cross).
- REVERSAL - ALERTS: Defines the message for when a position is closed by an opposite signal (stop-and-reverse).
- LONG/SHORT TP/SL EXIT - ALERTS: Defines the message for exits triggered by take profit (TP) or stop loss (SL), via percentage or ticks.
A Single Alert to Control Everything
You don't need to create separate alerts for "Buy," "Sell," or "Exits." On a single screen, you can create strategies by defining entries, signal-based exits, profit targets, or stop limits.
Alert Times (Operating Window)
In the Alert Times section, you can define a specific time (and time zone) for the strategy to generate entry or exit signals.
--
To create your alert, simply follow these steps:
- Condition: Select the script name: "Logic Flow Signals & Backtest".
- Message: Insert only the placeholder: {{strategy.order.alert_message}}
Once this single alert is active, it will "listen" to all orders executed by the strategy.
This means you can have your Long-Term, Short-Term, Signal-Based Exits, and TP/SL strategies active simultaneously. When any of these events are plotted on the chart, the script will send the customized message (which you wrote in the fields) to your single alert.
--
Advanced period filters: Allow you to test the strategy in specific date ranges, over the last X days, or over the last X bars, facilitating performance analysis in different market environments.
--
Status Panel: Displays a clear summary of all active rules and settings directly on the chart, facilitating the visualization and confirmation of the running logic.
Additionally, it has a settings box where you can activate or deactivate the panel, choose its position (such as at the bottom or side), and adjust its size.
--
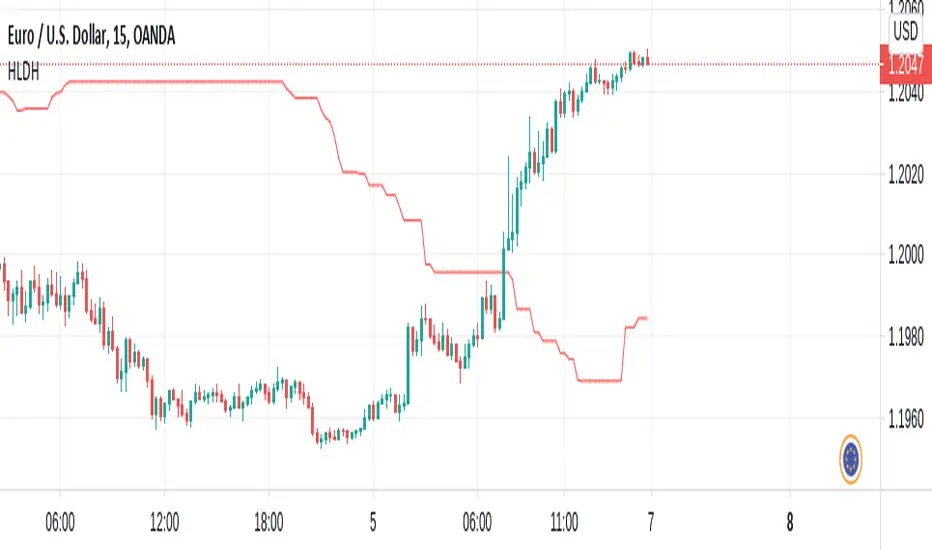
The Thumbnail strategy uses the following external indicators: Multiple MTF MA and Breakout Finder .
--
Final Considerations:
The Logic Flow Signals & Backtest tool is a versatile and powerful system, designed to test and apply trading ideas based on multiple indicators from TradingView.
Its differential is being a customization environment: the script does not have integrated graphical indicators, as the objective is precisely to allow the user to combine and integrate multiple existing indicators in the TradingView community to build unique entry and exit logics.
It offers flexibility and precision, but the true value emerges when the trader integrates the tool into a consistent trading plan, with efficient risk management (Stop Loss and Take Profit), leverage control, and a professional mindset.
Important: Risk of Repainting (Unstable Data): Avoid indicators that 'repaint' (those that change their values in past bars after the closing of new candles). The backtest will be invalidated, and the actual performance of the strategy will fail.
Legal Warning and Didactic Purpose:
It is fundamental to understand that all visual examples, charts, and texts contained in this description do not constitute financial advice, buy or sell recommendations, nor a promise of easy or guaranteed gains.
This is an advanced support tool, not an automatic profit system. Use the integrated backtesting to evaluate the historical behavior of strategies before real execution and understand how different market conditions impact your results. The sole purpose of this material is to demonstrate the logical and execution capacity of the script, serving as a didactic guide for you to test and validate your own ideas.
Conclusion and Risk Warning:
Success in financial markets comes not only from a set of charting indicators, but from the trader's understanding, practice, and discipline. Our objective is to provide a robust, customizable, and intuitive solution, created to enhance your technical analysis and broaden your strategic vision, without replacing critical thinking and conscious decision-making.
Finally, remember: past results do not guarantee future performance. The real differentiator lies in continuous learning, testing, and evolution.
Customindicator

Mutanabby_AI | ATR+ | Trend-Following StrategyThis document presents the Mutanabby_AI | ATR+ Pine Script strategy, a systematic approach designed for trend identification and risk-managed position entry in financial markets. The strategy is engineered for long-only positions and integrates volatility-adjusted components to enhance signal robustness and trade management.
Strategic Design and Methodological Basis
The Mutanabby_AI | ATR+ strategy is constructed upon a foundation of established technical analysis principles, with a focus on objective signal generation and realistic trade execution.
Heikin Ashi for Trend Filtering: The core price data is processed via Heikin Ashi (HA) methodology to mitigate transient market noise and accentuate underlying trend direction. The script offers three distinct HA calculation modes, allowing for comparative analysis and validation:
Manual Calculation: Provides a transparent and deterministic computation of HA values.
ticker.heikinashi(): Utilizes TradingView's built-in function, employing confirmed historical bars to prevent repainting artifacts.
Regular Candles: Allows for direct comparison with standard OHLC price action.
This multi-methodological approach to trend smoothing is critical for robust signal generation.
Adaptive ATR Trailing Stop: A key component is the Average True Range (ATR)-based trailing stop. ATR serves as a dynamic measure of market volatility. The strategy incorporates user-defined parameters (
Key Value and ATR Period) to calibrate the sensitivity of this trailing stop, enabling adaptation to varying market volatility regimes. This mechanism is designed to provide a dynamic exit point, preserving capital and locking in gains as a trend progresses.
EMA Crossover for Signal Generation: Entry and exit signals are derived from the interaction between the Heikin Ashi derived price source and an Exponential Moving Average (EMA). A crossover event between these two components is utilized to objectively identify shifts in momentum, signaling potential long entry or exit points.
Rigorous Stop Loss Implementation: A critical feature for risk mitigation, the strategy includes an optional stop loss. This stop loss can be configured as a percentage or fixed point deviation from the entry price. Importantly, stop loss execution is based on real market prices, not the synthetic Heikin Ashi values. This design choice ensures that risk management is grounded in actual market liquidity and price levels, providing a more accurate representation of potential drawdowns during backtesting and live operation.
Backtesting Protocol: The strategy is configured for realistic backtesting, employing fill_orders_on_standard_ohlc=true to simulate order execution at standard OHLC prices. A configurable Date Filter is included to define specific historical periods for performance evaluation.
Data Visualization and Metrics: The script provides on-chart visual overlays for buy/sell signals, the ATR trailing stop, and the stop loss level. An integrated information table displays real-time strategy parameters, current position status, trend direction, and key price levels, facilitating immediate quantitative assessment.
Applicability
The Mutanabby_AI | ATR+ strategy is particularly suited for:
Cryptocurrency Markets: The inherent volatility of assets such as #Bitcoin and #Ethereum makes the ATR-based trailing stop a relevant tool for dynamic risk management.
Systematic Trend Following: Individuals employing systematic methodologies for trend capture will find the objective signal generation and rule-based execution aligned with their approach.
Pine Script Developers and Quants: The transparent code structure and emphasis on realistic backtesting provide a valuable framework for further analysis, modification, and integration into broader quantitative models.
Automated Trading Systems: The clear, deterministic entry and exit conditions facilitate integration into automated trading environments.
Implementation and Evaluation
To evaluate the Mutanabby_AI | ATR+ strategy, apply the script to your chosen chart on TradingView. Adjust the input parameters (Key Value, ATR Period, Heikin Ashi Method, Stop Loss Settings) to observe performance across various asset classes and timeframes. Comprehensive backtesting is recommended to assess the strategy's historical performance characteristics, including profitability, drawdown, and risk-adjusted returns.
I'd love to hear your thoughts, feedback, and any optimizations you discover! Drop a comment below, give it a like if you find it useful, and share your results.

Triple Doji SequenceThe Triple Doji Sequence indicator helps traders identify consecutive Doji candlestick patterns, allowing them to choose between spotting single, double, or triple Dojis. A Doji is detected when the candle's body is small relative to its wicks, with either the upper or lower wick being significantly larger. Users can customize their own Doji criteria by adjusting the body size and wick dominance settings. The indicator ensures that consecutive Dojis align in the same direction before confirming a valid pattern, making it easier to identify market indecision or potential trend reversals.
When the chosen Doji sequence is detected, the indicator plots a star (*) above bearish Dojis (upper wick dominant) and below bullish Dojis (lower wick dominant). It also sends alerts when a valid sequence is confirmed at the close of the bar. This tool helps traders refine their strategy by spotting repeated Doji formations, which may indicate key turning points or continuation patterns in price action.
How to Use the Triple Doji Sequence Indicator?
Apply the Indicator:
Add the Triple Doji Sequence indicator to your TradingView chart.
It will automatically scan for Doji patterns based on your settings.
Customize Your Doji Criteria:
Adjust the body size and wick dominance settings to define what qualifies as a Doji.
Choose whether to detect single, double, or triple Doji sequences.
Interpret the Signals:
A star (*) above a candle signals a bearish Doji (upper wick dominant).
A star (*) below a candle signals a bullish Doji (lower wick dominant).
Set Up Alerts:
Enable alerts to receive notifications when a Doji sequence is confirmed at bar close.
Choose alert frequency based on your trading strategy (e.g., once per bar, once per bar close).
Use in Trading Strategy:
Doji sequences can indicate trend reversals or market indecision.
Combine this indicator with support/resistance levels, volume, or other indicators to confirm signals.
PS: Good luck in finding a Triple Doji :)

Dynamic EMA CrossoverThe Dynamic EMA Crossover indicator is designed to help traders identify trend transitions, visually understand market direction, and detect sideways consolidation zones. It simplifies decision-making by dynamically changing colors and highlighting areas of interest.
Key Features:
1. Dynamic EMA Crossovers:
• Uses two EMAs (default: 9 and 26 ) to identify bullish and bearish trends.
• EMAs and the area between them turn green during bullish trends and red during bearish trends for easy visualization.
2. Sideways Market Detection:
• Automatically detects periods of market consolidation when EMAs overlap for 10 consecutive candles and the price movement remains narrow.
• Sideways zones are highlighted with grey background, helping traders avoid false breakouts and trendless markets.
3. Customizable Inputs:
• Adjust the lengths of the two EMAs and the sensitivity of the overlap detection to match your trading style and market conditions.
How It Works:
• Trend Identification:
• When the shorter EMA crosses above the longer EMA, a bullish trend is indicated.
• When the shorter EMA crosses below the longer EMA, a bearish trend is indicated.
• The indicator dynamically adjusts the colors of the EMAs and fills the area between them for clear trend visibility.
• Sideways Market Detection:
• When the shorter EMA and longer EMA stay close (within a customizable sensitivity) for a fixed period (hardcoded to 10 candles), the indicator identifies a sideways market.
• This feature helps traders avoid entering trades during choppy or indecisive market conditions.
Who Is This For?
This indicator is ideal for:
• Trend traders looking for clear signals of trend direction.
• Swing traders who want to avoid trading in sideways markets.
• Scalpers who need quick and reliable visual cues for short-term market behavior.
Use Cases:
1. Bullish/Bearish Trends:
• Enter trades in the direction of the trend as the crossover occurs and colors change.
2. Sideways Zones:
• Avoid trades during periods of consolidation and wait for a clear breakout.
Mashup Logic:
This indicator combines:
1. EMA Crossovers:
• A tried-and-tested method for trend detection using two moving averages.
• Dynamic visual cues for bullish and bearish market phases.
2. Sideways Market Detection:
• Innovative logic to highlight sideways zones based on EMA overlap and price range analysis.
• Helps reduce noise and avoid trading during trendless periods.
3. Customization and Flexibility:
• Fully adjustable EMA lengths and overlap sensitivity to adapt to different markets and trading styles.
Trendilo ARTrendilo AR is a custom trading indicator designed to identify market trends using advanced techniques such as the Arnaud Legoux Moving Average (ALMA), volume confirmations, and dynamic volatility bands. This indicator provides a clear visualization of trends, including significant changes and custom alerts.
Review of Indicators Used
1. ALMA
Description:
ALMA is a moving average that applies an advanced filter to smooth price data, reducing noise and focusing on actual trends.
Usage in the Indicator:
Used to calculate the smoothed percentage price change and determine trend direction. Customizable parameters include:
- Length: Defines the number of bars to consider.
- Offset: Adjusts sensitivity toward recent prices.
- Sigma: Controls the degree of smoothing.
Advantages:
- Reduced lag in trend detection.
- Resistance to market noise.
2. ATR
Description:
ATR measures the market’s average volatility by considering the range between high and low prices over a given period.
Usage in the Indicator:
ATR is used to calculate "dynamic smoothing", adjusting the indicator’s sensitivity based on current market volatility.
Advantages:
- Adapts to high or low volatility conditions.
- Helps define dynamic support and resistance levels.
3. SMA
Description:
SMA calculates the average of prices or volume over a specific time period.
Usage in the Indicator:
Used to calculate the volume moving average (Volume SMA) to confirm whether the current volume supports the detected trend.
Advantages:
- Easy to understand and calculate.
- Provides volume-based trend confirmation.
4. RMS Bands
Description:
RMS Bands calculate the standard deviation of percentage price changes, creating upper and lower levels that act as overbought and oversold indicators.
Usage in the Indicator:
- Define the range within which the market is considered neutral.
- Crosses above or below the bands indicate trend changes.
Advantages:
- Visual identification of strong trends.
- Helps filter false signals.
Colors and Visuals Used in the Indicator
1. ALMA Line
Colors:
- Green: Indicates a confirmed uptrend (with sufficient volume).
- Red: Indicates a confirmed downtrend (with sufficient volume).
- Gray: Indicates a neutral phase or insufficient volume to confirm a trend.
2. RMS Bands
- Upper and Lower Lines:
- Purple (with transparency): These lines represent the RMS bands (upper and lower) and
adjust opacity based on trend strength.
- Stronger trends result in less transparency (more solid colors).
3. Highlighted Background (Strong Trends)
- Color:
- Light Green (transparent): Highlights a strong trend when the smoothed percentage change (ALMA) exceeds 1.5 times the RMS.
4. Horizontal Lines
- Baseline (0):
- Dark Gray: Serves as a central reference to identify the directionality of percentage changes.
- Additional Line (0.1):
- Blue: A customizable line to mark user-defined key levels.
5. Bar Colors
- Bar Colors:
- Green: When the price is in a confirmed uptrend.
- Red: When the price is in a confirmed downtrend.
- No color: When there is insufficient volume or no clear trend.
How to Use the Indicator
1. Initial Setup
1. Add the Indicator to Your Chart: Copy the code into the Pine Editor on TradingView and apply it to your chart.
2. Customize Parameters: Adjust values based on your trading strategy:
- Smoothing: Controls the level of smoothing for percentage changes.
- Lookback Length: Defines the observation period for calculations.
- Band Multiplier: Adjusts the width of RMS bands.
2. Signal Interpretation
1. Indicator Colors:
- Green: Confirmed uptrend.
- Red: Confirmed downtrend.
- Gray: No clear trend or insufficient volume.
2. RMS Bands:
- If the ALMA line (smoothed percentage change) crosses above the upper RMS band, it signals a potential uptrend.
- If it crosses below the lower RMS band, it signals a potential downtrend.
3. Volume Confirmation:
- The indicator's color activates only if the current volume exceeds the Volume SMA.
3. Alerts and Decisions
1. Trend Change Alerts:
- The indicator automatically triggers alerts when an uptrend or downtrend is detected.
- Configure these alerts to receive real-time notifications.
2. Strong Trend Signals:
- When the magnitude of the percentage change exceeds 1.5 times the RMS, the chart background highlights the strong trend.
4. Trading Strategies
1. Buy:
- Enter long positions when:
- The indicator turns green.
- Volume confirms the trend.
- Consider placing a stop-loss just below the lower RMS band.
2. Sell:
- Enter short positions when:
- The indicator turns red.
- Volume confirms the trend.
- Consider placing a stop-loss just above the upper RMS band.
3. Neutral:
- Avoid trading when the indicator is gray, as no clear trend or insufficient volume is present.
Disclaimer: As this is my first published indicator, please use it with caution. Feedback is highly appreciated to improve its performance.
Happy Trading!

Momentum Cloud.V33🌟 Introducing MomentumCloud.V33 🌟
MomentumCloud.V33 is a cutting-edge indicator designed to help traders capture market momentum with clarity and precision. This versatile tool combines moving averages, directional movement indexes (DMI), and volume analysis to provide real-time insights into trend direction and strength. Whether you’re a scalper, day trader, or swing trader, MomentumCloud.V33 adapts to your trading style and timeframe, making it an essential addition to your trading toolkit. 📈💡
🔧 Customizable Parameters:
• Moving Averages: Adjust the periods of the fast (MA1) and slow (MA2) moving averages to fine-tune your trend analysis.
• DMI & ADX: Customize the DMI length and ADX smoothing to focus on strong, actionable trends.
• Volume Multiplier: Modify the cloud thickness based on trading volume, emphasizing trends with significant market participation.
📊 Trend Detection:
• Color-Coded Clouds:
• Green Cloud: Indicates a strong uptrend, suggesting buying opportunities.
• Red Cloud: Indicates a strong downtrend, signaling potential short trades.
• Gray Cloud: Reflects a range-bound market, helping you avoid low-momentum periods.
• Dynamic Volume Integration: The cloud thickness adjusts dynamically with trading volume, highlighting strong trends supported by high market activity.
📈 Strength & Momentum Analysis:
• Strength Filtering: The ADX component ensures that only strong trends are highlighted, filtering out market noise and reducing false signals.
• Visual Momentum Gauge: The cloud color and thickness provide a quick visual representation of market momentum, enabling faster decision-making.
🔔 Alerts:
• Custom Alerts: Set up alerts for when the trend shifts or reaches critical levels, keeping you informed without needing to constantly monitor the chart.
🎨 Visual Enhancements:
• Gradient Cloud & Shadows: The indicator features a gradient-filled cloud with shadowed moving averages, enhancing both aesthetics and clarity on your charts.
• Adaptive Visual Cues: MomentumCloud.V33’s color transitions and dynamic thickness provide an intuitive feel for the market’s rhythm.
🚀 Quick Guide to Using MomentumCloud.V33
1. Add the Indicator: Start by adding MomentumCloud.V33 to your chart. Customize the settings such as MA periods, DMI length, and volume multiplier to match your trading style.
2. Analyze the Market: Observe the color-coded cloud and its thickness to gauge market momentum and trend direction. The thicker the cloud, the stronger the trend.
3. Set Alerts: Activate alerts for trend changes or key levels to capture trading opportunities without needing to watch the screen continuously.
⚙️ How It Works:
MomentumCloud.V33 calculates market momentum by combining moving averages, DMI, and volume. The cloud color changes based on the trend direction, while its thickness reflects the strength of the trend as influenced by trading volume. This integrated approach ensures you can quickly identify robust market movements, making it easier to enter and exit trades at optimal points.
Settings Overview:
• Moving Averages: Define the lengths for the fast and slow moving averages.
• DMI & ADX: Adjust the DMI length and ADX smoothing to focus on significant trends.
• Volume Multiplier: Customize the multiplier to control cloud thickness, highlighting volume-driven trends.
📚 How to Use MomentumCloud.V33:
• Trend Identification: The direction and color of the cloud indicate the prevailing trend, while the cloud’s thickness suggests the trend’s strength.
• Trade Execution: Use the green cloud to look for long entries and the red cloud for short positions. The gray cloud advises caution, as it represents a range-bound market.
• Alerts: Leverage the custom alerts to stay on top of market movements and avoid missing critical trading opportunities.
Unleash the power of trend and momentum analysis with MomentumCloud.V33! Happy trading! 📈🚀✨

TrapZone ProThis script combines the concepts of Price Action, Trend and Momentum to identify Price Zones (Red and Green filled areas) and Price Bars (Red, Green and Gray) where traders can get trapped in the Market.
It will clearly mark the bars which favor the prevailing Trend and those bars which just don't have the momentum anymore. TrapZone moves with the market trend and will often provide it support. As the TrapZone changes direction & its color, traders can change their trade bias.
Features:
Identify strong & weak price action - By leveraging a regression calculation of price movement on Y axis against the x axis, we identify the strength of current bars. Increasing relative strength of bars indicate Bullish (Green Bars) & Bearish (Red Bars) price movement, respectively. As the relative strength starts to decrease in Bullish or Bearish price action, the indicator immediately changes the color of these bars to Gray (by default). We call these TrapBars .
Current price trend - By using the highs and lows of price in multiple periods, we are calculating the trend of the price. The Bullish trend is shown by the Green zone and Bearish trend is shown by the Red zone. These zones are the shaded areas which are plotted on the chart. If the price is in these Zones, Longs or Short trades are not advised as that price action is weak. We call these TrapZones .
Strength of the Momentum - the thickness of the TrapZone shows the strength of the current Bullish or Bearish trend. That means the wider the shaded area grows the stronger is the current market momentum. A Flat TrapZone indicates sideways price action.
Knowing when NOT to Trade is as important as when to Trade. While this indicator is designed to avoid taking bad trades such as FOMO, Catching a Falling Knife or Fighting The Trend , it successfully reveals the good trade setups!
How these features of this indicator helps Traders avoids common mistakes:
FOMO or Fear of Missing Out - If a Trader Sees TrapBars in a Bullish or Bearish Trend, they will avoid entry as the price action is weak at that time. This will avoid late entries.
Catching a Falling Knife (a.k.a. Picking a Bottom) - When Red TrapZone is being plotted, Traders can avoid taking Long Entries hoping for a price reversal.
Fighting The Trend (a.k.a Picking a Top) - When Green TrapZone is being plotted, Traders can avoid taking Short entries hoping for a price reversal.
TrapZone Pro does all this in a single panel of the chart irrespective of the market or timeframe.
How to use TrapZone Pro indicator for trading [
A. Market Analysis
Green TrapZone is Bullish and traders should not take Shorts. If Green TrapZone is moving higher, Market is Strong
Red TrapZone is Bearish and traders should not take Longs. If Red TrapZone is moving Lower, Market is Strong
No trades when TrapBars are forming
No trades inside the TrapZone
B. Trade Guidance System
Establish Market Bias - Bullish or Bearish using the TrapZone Color
Only Enter Long in Long Color Bars i.e. Green by default
Only Enter Short in Short Color Bars i.e. Red by default
3 Classes of Trades are Possible Class A, B & C. A being the best Reward : Risk ratio and C being the least rewarding. So use trade size accordingly.
Class A - Best bars are always the first & Second, close to the TrapZone
Class B - Long Bar or Short Bar Forming after TrapBar away from the TrapZone in a Strong Market
Class C - Long Bar or Short Bar Forming after TrapBar close to the TrapZone in a Flat Market (identified by Flat TrapZone )
Take profits when Price moves away from the TrapZone & TrapBars start forming OR Your Target is hit !
See a few examples of Trade Classes & Entries/ Exits for a better understanding
Recommendations
Select Session to “Electronic Trading Hours” in chart settings so you can see the Post & Pre Market trading as well. You can change the color of these sessions to the same color as chart background, so it is not distracting.
Start by Trading in the Hourly or Daily time frame to get used to the new indicator and its Trade Guidance System .
Position Size is the best form of Risk Management. Have a fixed dollar loss per trade pre-determined and adjust the size based on market volatility.
Even though this indicator is designed to work on any market or timeframe, trade the markets that you are familiar with and timeframe that matches your lifestyle. Your understanding of the instrument's behavior and knowledge of what makes it move is valuable.
Basic Set-Up
Add the Indicator to the chart
Open Chart Settings and in Symbol Section
Switch off “ Borders ”
Switch off “ Wick ” or Change the colors to a same non-distracting color like Black or Gray
Open TrapZone Pro Settings
Set the colors for the “ Long Bars ”, “ Short Bars ” & “ No Entry Bars ” if you wish to change the default colors
Change “ TrapZone ” colors to your Taste or leave the defaults
Green for “Color 0” that represents Bullish Price Action
Red for “Color 1” that represents Bearish Price Action
Important Advice & Disclaimer: This indicator does not guarantee that you will make money. It is a tool that performs market analysis for you and presents it in a easy to consume fashion. Markets are truly random and can change direction on a dime. You must use prudent risk and money management strategy based on your investor profile, investment objectives and risk appetite.
To Get Access - See Author’s instructions below

Oscillating Length Moving Averages***CREDIT TO TradingView's TA Library*** (), Attempted to use "import TradingView/ta/4" to import the library, but for whatever reason
some of the functions failed to work, while others had no issue, so I opted to just copy paste what I wanted to use.
This moving average uses an oscillator to influence the length used during calculation. Extremely customizable/tunable with ability to change Max and Min length values, length multiplier, length multiple,4 different settings ,( Decline , <>Peak, >Decline , <>Peak, >
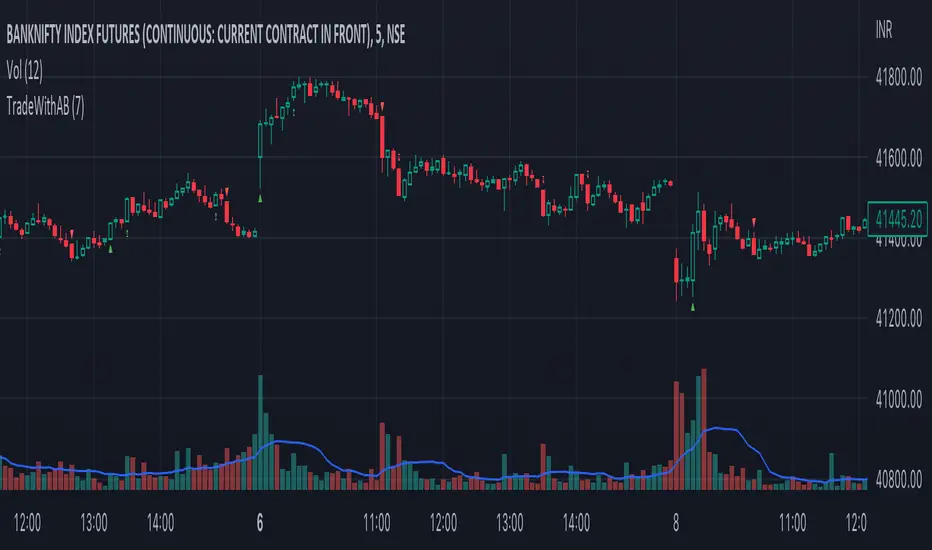
TradeWithAB SignalsThis indicator specifically designed for Momentum trading by an Intraday trader on index( Nifty , BankNifty ) and Equity stocks. This indicator works with DMI and PRICE ACTIONS which gives automated Buy and Sell signals along with Stop loss and Trailing Stop loss when certain criteria are met. It is not a Holy Grail system that gives you continuous profits and it has some limited downfalls also which can be controlled by proper risk Management and position sizing. This is a premium invite only indicator which can be use after given access to you by us. There are some guidelines on how to use this indicator which are given below and you have to follow these guidelines very strictly to get the maximum results.
Guidelines :-
1. Default Timeframe - 5 min
2. You have to take almost all the trade generated by this indicator on a particular stock/index for better results.
3. Signal confirmation is required for enter the trade as it will give you maximum profits.
4. GREEN TRIANGLE is represented as BUY Signal whereas RED TRIANGLE is represented as SELL Signal.
5. GREEN ARROW is considered as BUY TRAILING STOP LOSS as well as BUY RE-ENTRY for some scenarios.
6. RED ARROW is considered as SELL TRAILING STOP LOSS and SELL RE-ENTRY for some scenarios.
7. Ignore the signals(if any) of 1st candle(9:15)and last candle(3:25)of the day for better results.
BUY Trade Management :-
1. Trade should be initiated if and only if there is a buy signal(Green Triangle) is generated.
2. You should only enter the trade at the CLOSE of the signal generated candle.
3. Your Stop loss should be placed at the LOW of the signal generated candle.
4. There is a trailing Stop loss signal (Green Arrow) after the buying signal is generated.
5. You should trail your Stop loss at the LOW of the trailing Stop loss signal generated candle.
6. You should trail your Stop loss repeatedly until your trailing Stop loss got hit and hence Exit your buy trade.
7. After Exiting the trade you always have option to re-enter at the next trailing Stop loss signal(green arrow) generated candle CLOSE and put your Stop loss at LOW of that candle and repeat the same trailing stop loss procedures.
SELL Trade Management :-
1. Trade should be initiated if and only if there is a sell signal(Red Triangle) is generated.
2. You should only enter the trade at the CLOSE of the signal generated candle.
3. Your Stop loss should be placed at the HIGH of the signal generated candle.
4. There is a trailing Stop loss signal (Red Arrow) after the selling signal is generated.
5. You should trail your Stop loss at the HIGH of the trailing Stop loss signal generated candle.
6. You should trail your Stop loss repeatedly until your trailing Stop loss got hit and hence Exit your sell trade.
7. After Exiting the trade you have always option to re-enter at the next trailing Stop loss signal(red arrow) generated candle CLOSE and put your Stop loss at HIGH of that candle and repeat the same trailing stop loss procedures.
Disclaimer :-
*I am not a SEBI Registered Analyst and shall not be liable for any profit, loss or liability resulting, directly or indirectly from the use and results of the indicator. This is not a Holy Grail setup, sometimes the traders hit Stop loss and sometimes it gives amazing results as well.
Instructions to access to this invite-only script:-
*Send us a message if you wish to gain access to this indicator. The subscribers will get benefits of any future development or updates in the current script without any extra charges. Other trading style like swing and positional trading will also available in future updates.
RSI Influenced AverageUsing a couple of different ways of calculating (User selectable) the standard rsi oscillator is merged with a moving average for a slight variation. Plenty of options in the settings to play with like changing rsi length, MA length, lookback lengths, MA type, and much more. For Use with other moving averages ideally, or as a standalone indicator.

Rollin' pseudo-Bollinger Bands 5 linear regression curves and new highs/lows mixed together from the basis for this indicator. Using slightly different logic an upper boundary and lower boundary are formed. Then the boundary's are built upon to show price channels within the band using variations of fib levels and the distance between the initial boundary's. Dots plotted show the inverse of the close price relative to either the upper or lower boundary depending on where the close is relative to the center of the band. This shows the market's tendency for symmetry which is useful when looking for reversals etc. If it's too cluttered feel free to turn off some things in the options and keep what you feel is helpful.

TradeWithAB Signal IndicatorThis indicator specifically designed for Momentum trading by an Intraday trader on index( Nifty , BankNifty ) and Equity stocks. This indicator works with DMI and PRICE ACTIONS which gives automated Buy and Sell signals along with Stop loss and Trailing Stop loss when certain criteria are met. It is not a Holy Grail system that gives you continuous profits and it has some limited downfalls also which can be controlled by proper risk Management and position sizing. This is a premium invite only indicator which can be use after given access to you by us. There are some guidelines on how to use this indicator which are given below and you have to follow these guidelines very strictly to get the maximum results.
Guidelines :-
1. Timeframe - 5 min
2. Period should be changed on daily basis(if required) for index trading.
3. Period value would be basically derived from IND VIX value (closest integer) divided by 2.
Ex 1. If the VIX value is 23.56, then it will be consider as 24. So the period value will be 24/2= 12.
Ex 2. If the VIX value is 23.10, then it will be considered as 24. So the period value will be 24/2= 12.
Ex 3. If the VIX value is 22.88, then it will be considered as 22. So the period value will be 22/2= 11.
4. Period value should be fixed at 20 for equity stocks.
5. DO NOT take any SWING or POSITIONAL trade with this indicator.
6. You have to take almost all the trade generated by this indicator on a particular stock/index for better results.
7. Signal confirmation is required for enter the trade as it will give you maximum profits.
8. GREEN TRIANGLE is represented as BUY Signal whereas RED TRIANGLE is represented as SELL Signal.
9. GREEN ARROW is considered as BUY TRAILING STOP LOSS as well as BUY RE-ENTRY for some scenarios.
10. RED ARROW is considered as SELL TRAILING STOP LOSS and SELL RE-ENTRY for some scenarios.
11. You have to avoid entering a trade on a round level zone. Eg- Banknifty 37000,35500,40000 etc etc.
BUY Trade Management :-
1. Trade should be initiated if and only if there is a buy signal(Green Triangle) is generated with confirmation of its respective indices (Recent candle of respective index should be similar to the signal candle).
*in case of BankNifty , Nifty will be its respective index and vice-versa.
2. You should only enter the trade at the CLOSE of the signal generated candle.
3. Your Stop loss should be placed at the LOW of the signal generated candle.
4. There is a trailing Stop loss signal (Green Arrow) after the buying signal is generated.
5. You should trail your Stop loss at the LOW of the trailing Stop loss signal generated candle.
6. You should trail your Stop loss repeatedly until your trailing Stop loss got hit and hence Exit your buy trade.
7. After Exiting the trade you have always option to re-enter at the next trailing Stop loss signal(green arrow) generated candle CLOSE and put your Stop loss at LOW of that candle and repeat the same trailing stop loss procedures.
SELL Trade Management :-
1. Trade should be initiated if and only if there is a sell signal(Red Triangle) is generated with confirmation of its respective indices (Recent candle of respective index should be similar to the signal candle).
*in case of BankNifty , Nifty will be its respective index and vice-versa.
2. You should only enter the trade at the CLOSE of the signal generated candle.
3. Your Stop loss should be placed at the HIGH of the signal generated candle.
4. There is a trailing Stop loss signal (Red Arrow) after the selling signal is generated.
5. You should trail your Stop loss at the HIGH of the trailing Stop loss signal generated candle.
6. You should trail your Stop loss repeatedly until your trailing Stop loss got hit and hence Exit your sell trade.
7. After Exiting the trade you have always option to re-enter at the next trailing Stop loss signal(red arrow) generated candle CLOSE and put your Stop loss at HIGH of that candle and repeat the same trailing stop loss procedures.
Disclaimer :-
*I am not a SEBI Registered Analyst and shall not be liable for any profit, loss or liability resulting, directly or indirectly from the use and results of the indicator. This is not a Holy Grail setup, sometimes the traders hit Stop loss and sometimes it gives amazing results as well.
Instructions to access to this invite-only script:-
*Send us a message if you wish to gain access to this indicator. The subscribers will get benefits of any future development or updates in the current script without any extra charges. Other trading style like swing and positional trading will also available in future updates.

Stochastic DotsThese Stochastic Dots can help show potential turning points and cycles in the market.
- The smaller dots are based off of a faster moving stochastic
- The bigger dots are based off of a longer moving stochastic
- Dots below the candle/bar are bullish
- Dots above the candle/bar are bearish
This indicator is not meant to be traded by itself. Use other forms of confluency and confirmation with it.
If you're interested in more customized indicators to suit your needs, feel free to message me.
MTF DPO-RSI IndicatorThis indicator uses the principle of taking the RSI of DPO readings across multiple time frames in order to provide trade signals and an overarching view of market conditions to the trader. My hope with creating this indicator was to present more divergence based signals than your typical indicator, while still keeping those signals at a high quality.
In the settings menu, you may specify:
Indicator Timeframe - the chart resolution that is used to calculate values.
Source DPO Length - the number of bars used to calculate the Detrended Price Oscillator value. The DPO value is the source for the RSI calculations.
DPO Hull Smoothing - how much smoothing is applied to the DPO . Smoothing is accomplished by taking a Hull Moving Average of the closing price, and using this to calculate the DPO value.
RSI Length - the number of bars used to calculate the RSI of the DPO value.
Time Multipliers 1 through 6 - use this to define what resolution each plot will represent. A value of 1 will represent the current Indicator Timeframe. A value of 3 will represent 3 times the current Indicator Timeframe, etc.
Show Plot 1 through 6 - toggles the display of plots.
How I trade with this indicator:
A value of under 30 represents an over sold state for that particular plot. A value of over 70 represents an overbought state for that plot.
Identify divergences on a lower timeframe plot which are apparent in overbought or oversold conditions, and confirm the signal with an overbought or oversold condition, or a divergence on a higher timeframe plot. Divergences which begin in oversold or overbought territory and end inside the 30-70 range tend to be more reliable signals, in my experience. Like all indicators, this is best when used in conjunction with other indicators. Trend indicators, such as double EMA's and Supertrend are my favorite pairing, and a stochastic RSI is a good tool to have as well.
This is my first published indicator! If you find unique ways to use it, drop me a message. I'd love to know what you find. :)

enhanced_taLibrary "enhanced_ta"
Collection of all custom and enhanced TA indicators
ma(source, maType, length) returns custom moving averages
Parameters:
source : Moving Average Source
maType : Moving Average Type : Can be sma, ema, hma, rma, wma, vwma, swma, highlow
length : Moving Average Length
Returns: moving average for the given type and length
bb(source, maType, length, multiplier) returns Bollinger band for custom moving average
Parameters:
source : Moving Average Source
maType : Moving Average Type : Can be sma, ema, hma, rma, wma, vwma, swma, highlow
length : Moving Average Length
multiplier : Standard Deviation multiplier
Returns: Bollinger band with custom moving average for given source, length and multiplier
bbw(source, maType, length, multiplier) returns Bollinger bandwidth for custom moving average
Parameters:
source : Moving Average Source
maType : Moving Average Type : Can be sma, ema, hma, rma, wma, vwma, swma, highlow
length : Moving Average Length
multiplier : Standard Deviation multiplier
Returns: Bollinger Bandwidth for custom moving average for given source, length and multiplier
bpercentb(source, maType, length, multiplier) returns Bollinger Percent B for custom moving average
Parameters:
source : Moving Average Source
maType : Moving Average Type : Can be sma, ema, hma, rma, wma, vwma, swma, highlow
length : Moving Average Length
multiplier : Standard Deviation multiplier
Returns: Bollinger Percent B for custom moving average for given source, length and multiplier
kc(source, maType, length, multiplier) returns Keltner Channel for custom moving average
Parameters:
source : Moving Average Source
maType : Moving Average Type : Can be sma, ema, hma, rma, wma, vwma, swma, highlow
length : Moving Average Length
multiplier : Standard Deviation multiplier
Returns: Keltner Channel for custom moving average for given souce, length and multiplier
kcw(source, maType, length, multiplier) returns Keltner Channel Width with custom moving average
Parameters:
source : Moving Average Source
maType : Moving Average Type : Can be sma, ema, hma, rma, wma, vwma, swma, highlow
length : Moving Average Length
multiplier : Standard Deviation multiplier
Returns: Keltner Channel Width for custom moving average
kpercentk(source, maType, length, multiplier) returns Keltner Channel Percent K Width with custom moving average
Parameters:
source : Moving Average Source
maType : Moving Average Type : Can be sma, ema, hma, rma, wma, vwma, swma, highlow
length : Moving Average Length
multiplier : Standard Deviation multiplier
Returns: Keltner Percent K for given moving average, source, length and multiplier
dc(source, useCustomSource, length) returns Custom Donchian Channel
Parameters:
source : - Custom source
useCustomSource : - Custom source is used only if useCustomSource is set to true
length : - donchian channel length
Returns: Donchian channel
oscillatorRange(source, method, highlowLength, rangeLength) returns Custom overbought/oversold areas for an oscillator input
Parameters:
source : - Osillator source such as RSI, COG etc.
method : - Valid values for method are : sma, ema, hma, rma, wma, vwma, swma, highlow
highlowLength : - length on which highlow of the oscillator is calculated
rangeLength : - length used for calculating oversold/overbought range - usually same as oscillator length
Returns: Dynamic overbought and oversold range for oscillator input

CM MACD Custom Indicator - Multiple Time Frame - V2***For a Detailed Video Overview Showing all of the Settings...
Click HERE to View Video
New _CM_MacD_Ult_MTF _V2 Update 07-28-2021
Thanks to @SKTennis for help in Updating code to V2
Added Groups to Settings Pane.
Added Color Plots to Settings Pane
Switched MTF Logic to turn ON/OFF automatically w/ TradingView's Built in Feature
Updated Color Transparency plots to work in future update
Added Ability to Turn ON/OFF Show MacD & Signal Line
Added Ability to Turn ON/OFF Show Histogram
Added Ability to Change MACD Line Colors Based on Trend
Added Ability to Highlight Price Bars Based on Trend
Added Alerts to Settings Pane.
Customized how Alerts work. Must keep Checked in Settings Pane, and When you go to Alerts Panel, Change Symbol to Indicator (CM_Ult_MacD_MTF_V2)
Customized Alerts to Show Symbol, TimeFrame, Closing Price, MACD Crosses Up & MACD Crosses Down Signals in Alert
Alerts are Pre-Set to only Alert on Bar Close
See Video for Detailed Overview
New Updates Coming Soon!!!
***Please Post Feedback and Any Feature Requests in the Comments Section Below***
ZigZag ChannelThis is recreation of Donchian Channel - Pivot High Low indicator present here:
But, instead of traditional pivot high lows, this is based on pivots created from zigzag indicator.
This indicator is created on top of existing Zigzag indicator using lines array:
Parameter HighLowLength refers to number of zigzag lines back which can be used to calculate top and bottom of donchian channel.
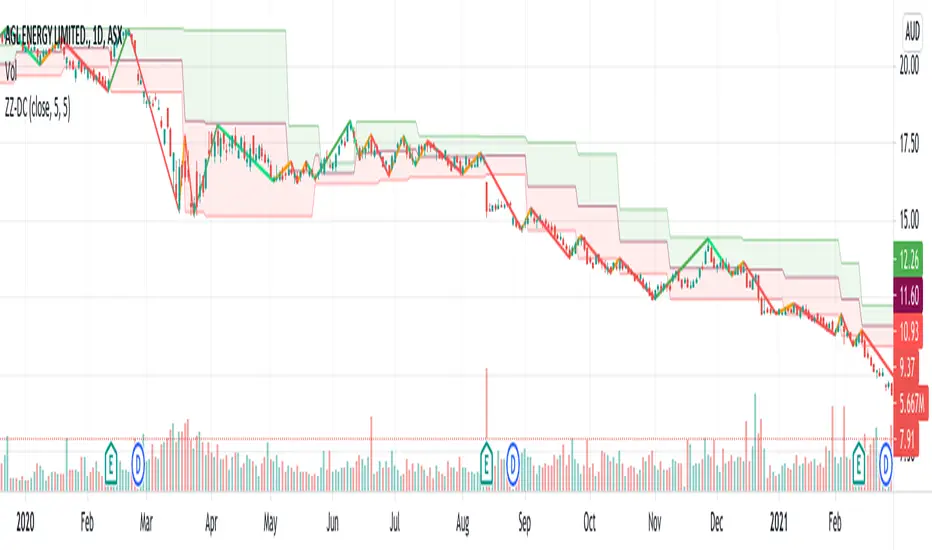
AZ Capital S & ROverview
The algorithm endeavours to robotize the identification of support and resistance levels by recognizing enormous swings/turns in authentic value activity.
These tops and bottoms in value activity shows where the bunches of buyers or sellers came into the market and may go about as future degrees of support or resistance.
The code identifies the last 3 huge swing highs and the last 3 swing lows. It at that point places lines on the outline to feature those levels.
In support and resistance hypothesis, frequently the support becomes resistance and the other way around. Along these lines, the algorithm doesn't just sort swings lows as "support" and swing highs as "resistance". All things considered, the algorithm takes a gander at the swing position comparative with the current close cost.
In the event that the price is over the level, the algorithm thinks of it as support. On the off chance that the price is beneath the level, the algorithm believes it to be resistance.
In light of this, the lines are naturally shaded by whether the prices are above or beneath the current close cost. At the point when any of the levels are beneath the nearby value, the lines are shaded green. Then again, at whatever point they are over the nearby, they are shaded red.
Donchian Channel - CustomThis is an extension to Donchian Channel - Pivot High Low indicator. Creating new version as the new type added isn't related to pivot high/low.
New type added is based on moving average. Instead of using highest and lowest of n bars, here, we are using lowest and highest of moving average of highs and lows for n bars.
Previous version of Donchian channel pivot points can be found here:

AZ Capital Lite 2.0
AZ Capital Lite 2.0 is the Updated Version of our Previous Lite Version of our trading algorithm/indicator. This algorithm is once again based on different indicators such as RSI and a combination of MA's along with ATR. Custom values that provide assistance to our PRO trading algorithm helping concluding analysis and finalising a trade even better.
AZ Capital Lite 2.0 combines various default indicators with custom values into One simple algorithm that helps the user to assess if an asset is moving upward or downwards.
AZ Capital Lite 2.0 works perfectly along with our AZ Capital PRO algorithm/indicator and helps the user to finalise the movement of an asset.
For Past Performances of this Algorithm/Indicator, Contact me Privately!
If you have any doubts on how to use the Algorithm/Indicator, Contact me Privately!
Commenting is RESTRICTED to only Comments about the Algorithm/Indicator and NOT asking for HOW-TO's and ACCESS!
Always DYOR and Trade Safely!
Regards,
Azyad (Founder of AZ Capital)

High/Low X Bars AgoThis indicator will plot a line on your chart that shows the highest high point between two previous points on the chart. It does this by reporting the highest point of X number of candles, and begins the look-back X number of candles ago.
Default candle group size is 50, and default look-back begins 50 candles back.
With these settings, the script will essentially plot the highest high point between the candle that printed 100 candles ago, and the candle that printed 50 candles ago.
Options are available for looking for the highest point, or lowest point, with configurable distances in the look-back and candle group ranges.
This script was custom built by Pine-Labs for a user who requested it.
MACD With Trend Filter: Visual Backtest Module TemplateSample Strategy: MACD Crossover with trend filter options
MA Filter : Price Close Above MA, Search for Buy, Price Close Below MA, Search for Sell
ADX Filter : Take trade only when ADX is above certain treshold
MACD Signal : MACD Cross above signal line while under 0 line indicate Buy Signal
MACD Cross below signal line while above 0 line indicate Sell Signal
-----------------------------
Using Alert Module:
Enable Alert --> Enable TV's alert and plot signal to chart
Alert Type --> Set to take Buy only, Sell only or Both alert
----------------------------
Using Backtest Module:
Enable Backtest --> Enable Backtest simulation
Backtest Type --> Set to take Buy only, Sell only or Both
SL Type -->
ATR : Set SL in ATR times Multiplier below/above entry price
Fixed : Set SL in fixed point below entry point (in 'Dollar'). e.g. for Stocks -> 0.5 equals to 50cent while for EURUSD currency -> 0.005 equal to 50 pips
HiLo Bar : Set SL at highest/lowest wick of previous bar plus/minus Fixed point. e.g. EURUSD HiLo=3 and Fixed Point = 0.0005, buy trade will place SL 5 Pips below lowest of previous 3 bar
SL ATR Period --> Set Lookback Period used for SL's ATR calculation
SL ATR Multi --> Set ATR Multiplier for SL
SL Fixed --> Set Fixed Level for SL (Use when SL Type is either Fixed or HiLo Bar)
SL Bar --> Set Number of previous bar to check for SL placement
TP RR Ratio --> Set TP based on RR multiplier. e.g. 2 means TP level will be twice further from entry point compared to Entry-SL distance.
Notes: The point is for preliminary testing, so it only supports 1 trade at a time and no Trailing Stop
----------------------------
Disclaimer:
This script main objective is to create my personal indicator template so that i just have to modify the indicator module for preliminary testing in future.
Testing Alert Module so i can re-use it as template in future study/indicator
Testing Visual Backtest Module so i can re-use it as template in future study/indicator
i believe using Strategy function is a better approach for this but the entry/exit level seems to be hit n miss (at least for me, still trying to figure what i did wrong)
also, i rather code the strategy in other platform where i can use the more accurate tick data if i want to validate backtest statistics.
My study scripts was built only to test/visualize an idea to see its viability and if it can be used to optimize existing strategy.
credit: ADX code are originally from "ADX and DI" by @BeikabuOyaji although i re-wrote so i can have cleaner read and use RMA instead of SMA

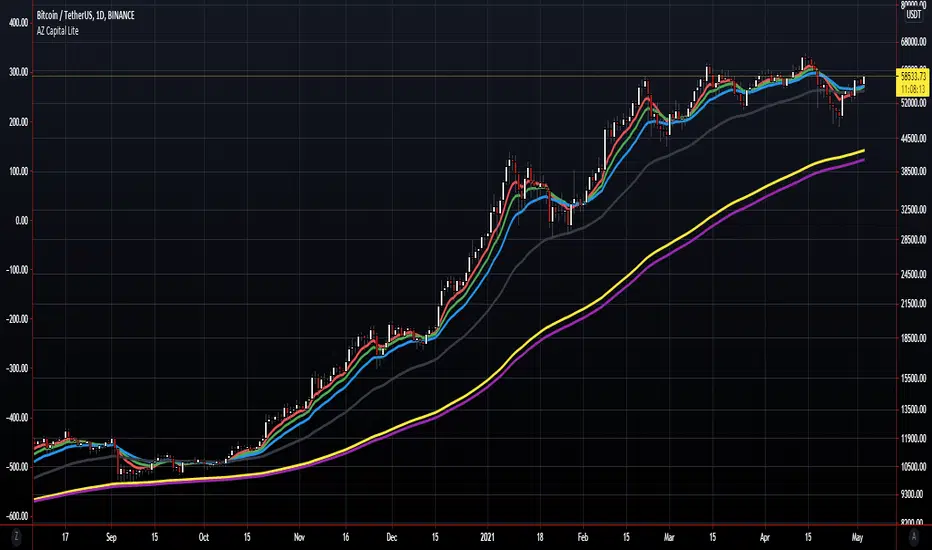
AZ Capital Lite
AZ Capital Lite is an additional feature of our AZ Capital PRO trading algorithm/indicator which is again based on different indicators such as RSI and EMA with custom values to provide assistance to our PRO trading algorithm helping in concluding analysis and finalising a trade.
RSI and EMA are two great indicators to access the movement of the asset and AZ Capital Lite makes those 2 different indicators into One simple indicator which helps the user to assess if an asset is moving upwards or downwards.
AZ Capital Lite also works along with our AZ Capital PRO algorithm/indicator helping to finalise the movement of an asset.
AZ Capital Lite is just using a customised and combined version of the regular EMA and RSI indicator available on TradingView.
For Past Performances of this Algorithm/Indicator, Contact me Privately!
If you have any doubts on how to use the Algorithm/Indicator, Contact me Privately!
Commenting is RESTRICTED to only Comments about the Algorithm/Indicator and NOT asking for HOW-TO's and ACCESS!
Always DYOR and Trade Safely!
Regards,
Azyad (Founder of AZ Capital)