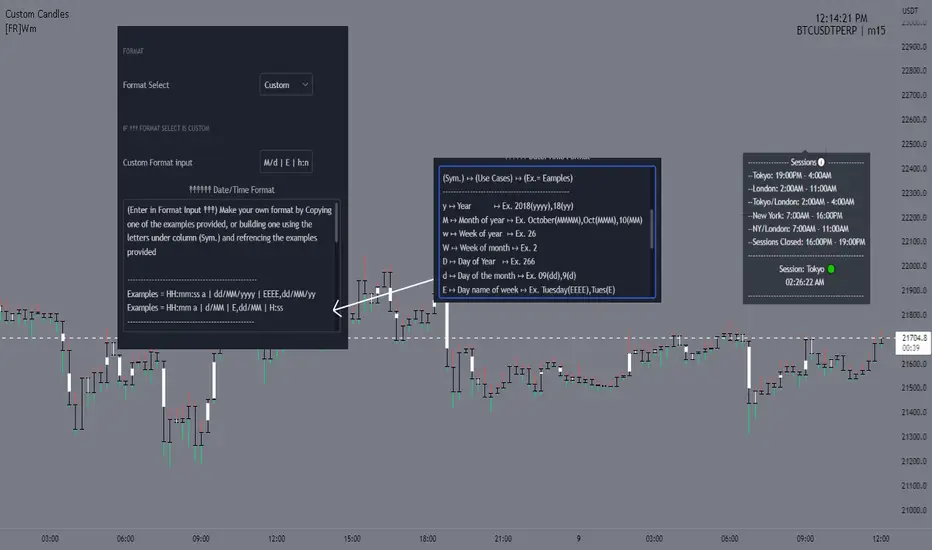
Simple OHLC Custom Range Interactive█ OVERVIEW
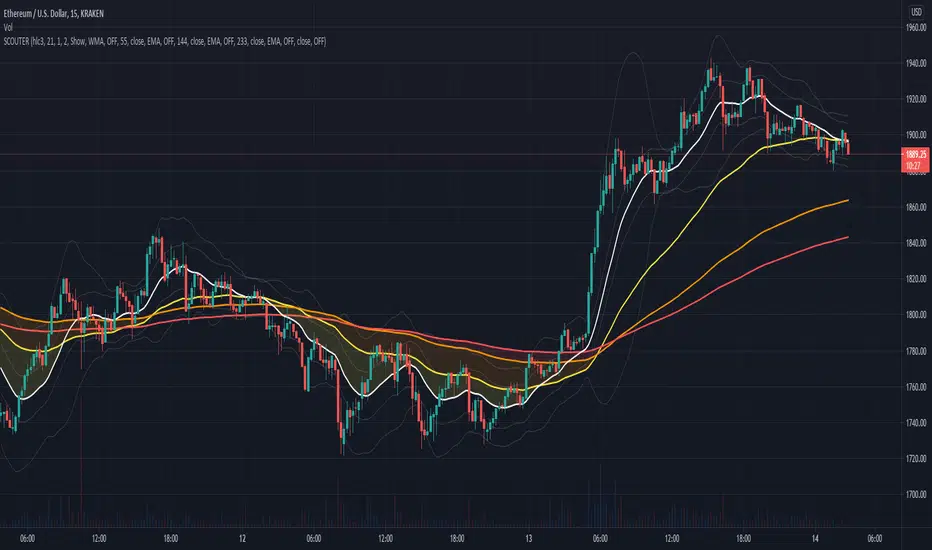
This indicator show lines of OHLC which can be commonly used as support and resistance zones.
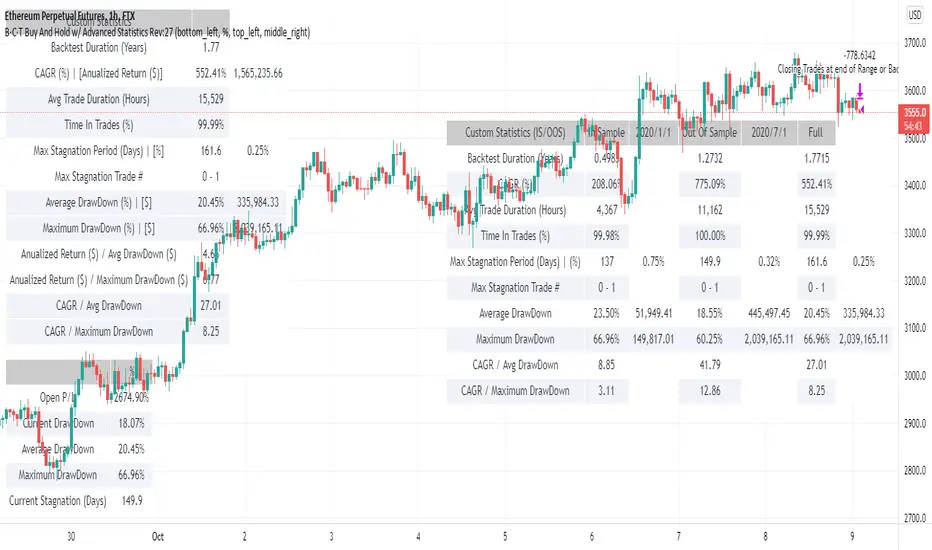
OHLC can be shown table with candlestick visual.
Color of candlestick depends on direction of bullish / bearish of the chosen candlestick.
█ INSPIRATION
Inspired by design, code and usage of CAGR . Basic usage of custom range / interactive, pretty much explained here . Credits to TradingView .
█ FEATURES
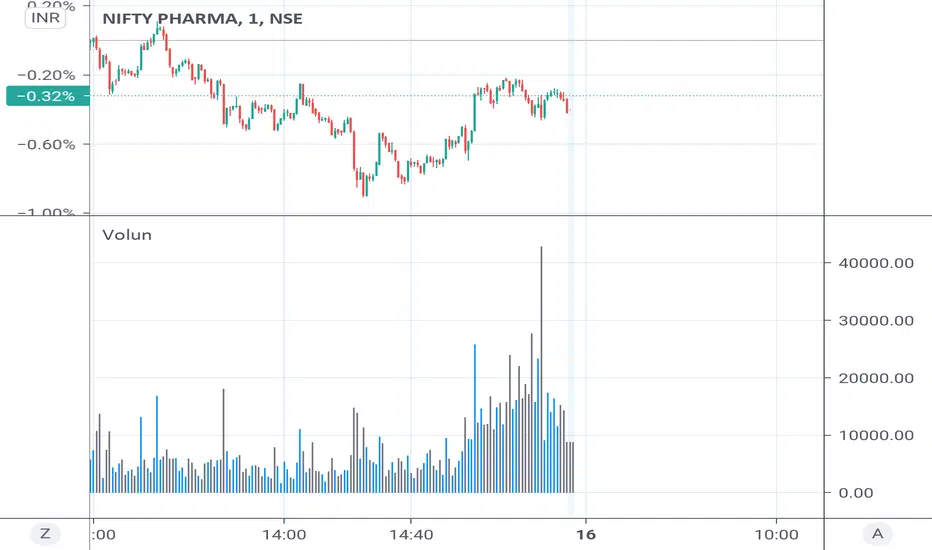
Table can positioned by any position and font size can be resized.
OHLC can be in full or simple name.
Lines can be extend either right, left, both or none.
█ HOW TO USE
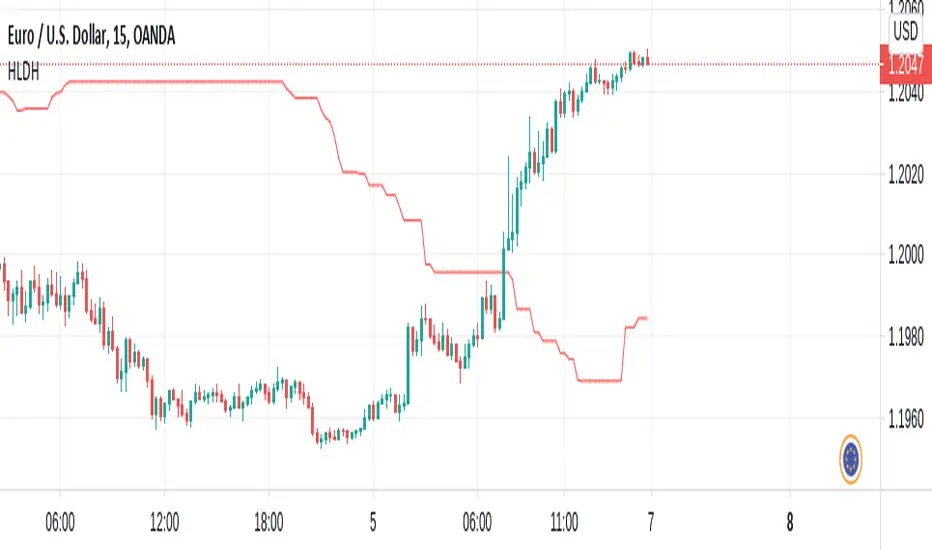
Only 1 point is required.
Dont worry about magnet, point will attached depends on High or Low of the candle.
█ USAGE / TIPS EXAMPLES (Description explained in each image)
Pine Script® göstergesi