TernTable: Crypto SectorsTernTables:CryptoSecs
This was hung on my Sector ETFs script to see if I could filter some noise from crypto by applying a GICS (Global Industry Classification Standard) style sector model to the crypto markets.
Crypto classification is certainly a little more nuanced so not completely straightforward.
It was designed to filter a researched and organised view of generally recognised cryptocurrency sectors and their confirmed constituent components.
The main purpose was a shot at displaying live crypto market data on my chart with instantaneous visual analysis, using leader laggard colour logic for performance indication, plus bullish bearish colour logic using the header for instant visual sector strength analysis.
This was never going to be an exhaustive tool of course and amazingly only or two of the sector lists wont fit on your laptop screen without zooming but it’s UI versatility both in custom display and custom threshold functionality is very effective. Viewing a coin on your watchlist with its sector overlayed in the chart brings the optional visual alert function into consideration. All basic but all effective and all customisable
Can't ignore the educational value either it’s teaching by osmosis what the sectors do and which coins go where clues to why.
As an after thought - I added a live stock market filter for 20 sector-specific ETFs like SPY, QQQ, XLV, XLF, allowing the comparison of the live performance of traditional financial sectors to live crypto sector data without leaving your chart.
Not certain how often it will need to be updated and any feedback re the legitimacy and accuracy of its components is kindly welcomed it is up to date at date of publishing.
It’s pretty easy to use, here is a list what you're getting with sector classifications with brief descriptions
CMC 20
CoinMarketCap Top 20: the largest cryptos by market cap. Great starting point to see what the overall market is doing
ETFs
All major U.S.-listed Bitcoin & Ethereum ETFs. Lets you compare crypto performance directly with traditional finance
Layer 0
Foundational interoperability protocols (Polkadot, Cosmos, ICP, etc.). These are the “bridges” that allow different blockchains to communicate
Layer 1
Independent base-layer blockchains that run their own consensus and security (Bitcoin, Ethereum, Solana, Cardano, TON, etc.).
Layer 2
Scaling networks built on top of Layer 1s to increase speed and lower fees (Arbitrum, Optimism, Base, Polygon, zk-rollups, etc.)
Layer 3
Application-specific chains or rollups designed for one purpose (gaming chains, DeFi-specific, social, etc.)
Web3
The “ownership internet”: gaming tokens, NFTs, metaverse land, music/streaming platforms, social tokens, and creator-economy projects
DeFi
Decentralised Finance: lending platforms, decentralized exchanges, derivatives, yield aggregators, and insurance protocols
Decentralised Storage
Blockchain-based alternatives to AWS/Google Cloud (Filecoin, Arweave, Storj, etc.)
Oracles
Data providers that feed off-chain information (prices, weather, sports results) into smart contracts
Privacy
Privacy coins and protocols that obfuscate transaction details (Monero, Zcash, Beam, etc.)
Yield & Lending
Protocols focused purely on lending, borrowing, and yield generation
DEX
Pure decentralized exchanges (Uniswap, SushiSwap, Jupiter, GMX, etc.)
DAO
Governance tokens of major decentralized autonomous organizations (Maker, Lido, Aave, ENS, etc.)
Infrastructure / Middleware
The picks-and-shovels layer: node services, RPC providers, indexing, cross-chain bridges, etc
Real World Assets (RWA)
Tokenised traditional assets: treasuries, real estate, private credit, stablecoins backed by real-world collateral
Restaking & Liquid Restaking
EigenLayer ecosystem and liquid-restaking tokens (eigen, ether.fi, Pendle, etc.). Currently the fastest-growing narrative
Traditional Sector ETFs
Classic U.S. sector ETFs (SPY, QQQ, XLF, XLE, XLV, XLY, etc.). Extra layer of analysis by comparing live stock market conditions with livecrypto market conditions
A list of the UI Toggles
* Sector Dropdown
• Select Sector: Choose the sector to display (e.g., CMC 20, Layer 1, DeFi, etc.)
* Custom Tickers
• Enter Tickers: Input custom coin tickers (e.g., BTCUSD, ETHUSD) to track specific assets
* Show % Change Row
• Toggle On/Off: Display the % change row for each sector/coin
* Show Current Price Row
• Toggle On/Off: Display the current price for each sector/coin
* Show Price-Diff Row
• Toggle On/Off: Display the price difference (current price - previous day's price)
* Show Spacer Row
• Toggle On/Off: Add a spacer row between data rows for clarity
* Table Position
• Select Position: Choose the position of the data table on your chart (Top Left, Top Right, etc.)
Visual Options:
* Show Sector Name
• Toggle On/Off: Display the sector name pane label on chart
* Custom Bull/Bear Threshold
• Toggle On/Off: Set a custom threshold for bullish/bearish sector performance
• Threshold (%): Set the percentage threshold (e.g., 50%) for bullish/bearish classification
* Show Live % in Header
• Toggle On/Off: Display the live percentage change in the table header
* Dynamic Decimal Formatting
• Toggle On/Off: Enable dynamic formatting for numbers display.
* Sort by % Change
• Toggle On/Off: Sort sectors by % change in performance
* Enable Alerts
• Toggle On/Off: Enable alerts based on performance thresholds
* Alert Threshold (%)
• Set Threshold: Define the percentage threshold (e.g.,70%) for triggering alerts
* Cooldown (bars)
• Toggle On/Off: Enable cooldown to prevent alerts from triggering too quickly
• Cooldown Duration: Set the cooldown period in bars (e.g., 10 bars)
* % Threshold Mode
• Toggle On/Off: Enable % Threshold Mode to filter sectors based on a percentage change threshold
• Threshold %: Set the percentage for filtering sectors (e.g., only show sectors with > 5% change)
A lot of toggles probably left once favourites are set but this UI interface does allow experimentation with the utility of channelling raw live data through custom designed filters. Just saying !
I need to include this of course
This indicator provides sector-based organisation and real-time performance visualisation for cryptocurrencies. It is not intended to predict price movements or guarantee outcomes. Crypto assets carry significant risk, including loss of capital. Past performance does not guarantee future results. All data and sector classifications are best-effort and may be incomplete, inaccurate, or outdated. Nothing in this script should be interpreted as financial advice. You are solely responsible for your own trading decisions.
That’s it really, I am currently pleased with how this indicator turned out, if you have a crypto trading toolkit put this in it.
Cryptosignals

Crypto/DXY ScoringHi!
This indicator "Crypto/DXY Scoring", a multi-purpose script, consists of various comparison statistics (including an alternative RS/RSMOM model) to show the strength of a currency against the DXY.
Features
"Contrived" RS/RSMOM alternative model
Compare the strength of the crypto currency on your chart to any asset (DXY default)
Glass's ∆
Z-comparison
Hedges' g
Cliff's Delta
Z-score for log returns
RRG graph (with adjusted dimensions) Traditional RRG graph coming soon (:
Let's go over some simplified interpretations of what's shown on the chart!
The image above provides generalized interpretations for the three of the data series plotted by the indicator.
The image above further explains the other plots for the indicator!
The image above shows the final result!
Underlying Theory
"When the dollar is strong as indicated by the DXY, it usually means that investors are seeking safety in traditional assets. Bitcoin (crypto) is often considered a "risk-on" asset, meaning investors might sell BTC in favor of holding dollars, thus driving BTC prices down."
Given the complexities associated with this relationship, including its contentious implications and a variable correlation between crypto and the DXY, this theory is one within a plethora.
That said, regardless of accuracy, this indicator adheres to the theory outlined above (:
The image above shows the purpose of the red/lime columns and the corresponding red/green lines.
Should the crypto on your chart and the DXY (or comparison symbol) exhibit negative correlation, and should the performance of DXY (or comparison symbol) hold any predictive utility for the subsequent performance of the crypto on your chart, the red columns violating the red line might indicate an upcoming "dump" for the crypto on your chart.
Lime green columns violating the green line may indicator an inverse response.
Alternative Relative Rotation Graph
In its current state, the alternated dimensions for the Relative Rotation Graph cause it to function more as a "Relative Performance Graph".
Fear not; a traditional RRG graph is coming soon!
The image above shows our alternative RRG!
Interpretation
With this model, you can quickly/intuitively assess the relative performance of the display cryptos against an index of their performance.
The image above shows generalized interpretations of the model!
That's it for this indicator! Thank you for checking it out; more to come (:

Cryptosmart Trading Tool (by heswaikcrypt)Introducing the Cryptosmart Trading Tool (CSTP) - An optimized into Market Sentiment and direction tool
The Cryptosmart Trading Tool (CSTP) is an advanced indicator developed to provide valuable insights into market sentiment and direction. This tool combines existing TA tools and intelligently develops smart algorithms to empower traders with a deeper understanding of market dynamics. Some classic elements are included in the scripting, such as the exponential moving average (EMA), volume, and Relative Strength Index (RSI), to provide a comprehensive analysis of market conditions. By combining these indicators, the script aims to capture different aspects of market sentiment and enhance the accuracy of the analysis.
The Cryptosmart Trading Tool (CSTP) incorporates a unique algorithm that combines trend following analysis, momentum analysis, and volume analysis to provide insights into market sentiment and price action.
Trend Following Analysis:
The algorithm utilizes two exponential moving averages (EMAs): EMA1 and EMA2.
When EMA1 crosses above EMA2, it indicates an uptrend (isUptrend).
When EMA1 crosses below EMA2, it indicates a downtrend.
You adjust the input value to suit your trading strategy, however, 7, 8, 21, 34, and 200 have been tested to produce a fine tuned output.
The bar color indicates blue for bullish sentiment (is uptrend) and white for bearish sentiment (is downtrend).
Momentum Analysis:
The relative strength index (RSI) is calculated based on the closing prices and the specified RSI length.
RSI values above 70 indicate overbought conditions (isOverbought).
RSI values below 30 indicate oversold conditions (isOversold).
Using the isOversoldExtreme and isOverboughtExtreme, the CSTP algorithm detect extreme over bought and oversold conditions and alert with label color green and red.
Volume Analysis:
The algorithm calculates the average volume over a specified length (averageVolume).
The volume ratio is obtained by dividing the current volume by the average volume.
High volume activity is identified when the volume ratio is greater than 1 (isHighVolume).
Major Flip and Arrow Plots:
Major bullish or bearish flips are identified when EMA1 crosses above EMA2 with RSI values above 50 and high volume activity (isBullishFlip) or when EMA1 crosses below EMA2 with RSI values below 50 and high volume activity (isBearishFlip).
Arrow plots are used to display trend direction, upward arrows for major bullish flips and downward arrows for major bearish flips.
The algorithm calculates the bullBearRatio and RSIValueAtFlip to capture the volume ratio and RSI values at major flips.
The bullishRatio and bearishRatio variables store the volume ratio values for the corresponding trend conditions.
Labels are also displayed on the chart to provide information about EMA values and RSI values. This can be independently disabled by the user
The uniqueness of the CSTP algorithm lies in its combination of trend following analysis, momentum analysis, and volume analysis. By considering these factors, the algorithm provides insights into market sentiment and price action. The use of EMAs, RSIs, and volume ratios allows traders to identify potential trends, overbought/oversold conditions, and high volume activity. The visual representation of bar colors and arrows enhances the ease of understanding the sentiment and major flips. CSTP is uniquely presented by using dots, arrows, candlestick colors, and shape labels to indicate the market scenario. This is explained below.
By leveraging multiple indicators and analysis techniques, CSTP aims to provide traders with a holistic understanding of market dynamics and enhance their decision-making process.
It's important to note that while the individual components used in CSTP are not new or unique on their own, the specific algorithm, parameters, and calculations used within the script are what make it distinctive and valuable. By carefully integrating these components, CSTP generates results that are greater than the sum of its parts, providing traders with a comprehensive analysis of market conditions.
Through extensive research, analysis, and testing, we have created a useful tool, fine-tuned to optimize the accuracy and reliability of the script's output, which can assist traders in making more informed trading decisions.
How to Use:
1. Apply the CSTP Script:
- Apply the CSTP script to your TradingView chart to start analyzing market conditions. (Access instructions can be found in the author's details section.)
- Ensure you have the latest version of TradingView to access all the features and functionalities.
2. Customize Parameters:
- Customize the input variables to match your trading preferences and adapt the tool to different markets.
- Experiment with different settings, such as RSI Length and EMA Lengths, to find the optimal configuration for your trading strategy.
3. Interpret the Color-Coded Bars and Wave Labels:
- Green bars indicate bullish sentiment, suggesting potential buying opportunities.
- Red bars indicate bearish sentiment, indicating potential selling opportunities.
- Blue and white bars represent sentiment backed by smart money liquidity, adding an extra layer of analysis.
- The wave labels provide insights into market structure and potential wave patterns.
4. Combine with Candlestick philosophy strategy and parameters used:
- Wait for candlestick closure before making trading decisions based on CSTP's analysis.
- Consider the EMA (yellow) line as an additional tool to confirm entry or exit points.
- Combining CSTP's analysis with candlestick patterns can enhance your decision-making process and improve trade timing.
- Volume Analysis: Compares the current volume to the Simple Moving Average (SMA) of volume using the RSI Length parameter to determine high-volume periods.
- Color-Coded Bars: The color of the bars represents different market sentiments based on all the parameters used including Relative strength index, bullish and bearish
divergence and volume conditions.
- Open Close Cross (OCC) Alerts: Generates dot alert with color code (red=Bearish, green=Bullish) when there is a crossover or crossunder between the close and open
prices
Important Notes:
- Candlestick color matter a lot as then show the sentiment of the market at a given time. and it is an added advantage for a trader to understand candlestick Psychology.
Candlestick conditions
I will use this BINANCE:MTLUSDT chart to explain how it works
Long green Arrow: Bullish call, with green isBullish arrow
Long red Arrow: Bearish call, with isBearish arrow
Blue with red wick and tape: this indicate a bearish sentiment but with some bullish volume, this position is dice which requires a proper understanding of entry and exit. when if this said candle stick closes below the EMA line, wait for the the next candle after it t determining your move. If the next one closes above it, then the direction is still bullish, else the direction has flipped bearish. (special scenario: in the range or consolidative market phase, you may need to wait 3-7 day candle close before you decide. use the coloration as guide to help with your decision making).
Blue with green wick and tape: this indicated strong bullish sentiment backed by liquidity to push. it is important to not the candle close, if the candle closes above the EMA (7 and/or 21) that validates the move, else, you may need to wait for the next candle close to determine the move and momentum of the market. Example is the $COOMPUST chart
White with green wick and tape: this works just like the "Blue candlestick with red wick and tape". follow same procedure
White with red wick and tape: White candle with red wick, indicates bearish sentiment backed by available market liquidity at the time.
If you see the market moving upward and the candlestick keep closing with white color, it is an indication of inorganic move (Check BITFINEX:SUIUST ) the best thing to do is to wait at resistance. a similar scenario can be seen here
Market test:
below are picture of the indicator tested on different assets
CRYPTOCAP:BNB
AUD
Tesla
it is best to book an entry after an arrow indicate (especially for a bullish market) and the candle closes above the EMA (Yellow line).
Risk management.
- ALWAYS PROTECT YOUR PROFIT WHEN YOU SEE ON. THE MARKET IS DYNAMIC
- Trading involves risks, and no tool can guarantee absolute accuracy in predicting market direction. Conduct thorough research and exercise caution when making trading decisions.
- Apply proper risk management strategies and adjust position sizes according to your risk tolerance.
- Stay updated with market news and events that may impact your trading decisions.
Conclusion:
The Cryptosmart Trading Tool (CSTP) provides traders with a powerful advantage by offering valuable insights into market sentiment and direction. To gain access or trial, refer to the author's details section. This indicator combines various analysis techniques to provide a comprehensive view of the market. Remember to apply your own analysis and expertise in conjunction with CSTP for optimal results.
This indicator combines my 8years of trading experience. Enjoy
Disclaimer:
Trading involves risks, and the CSTP script is designed to assist traders by providing valuable insights. It should be used as a supplement to your own analysis and expertise. Exercise caution and make informed trading decisions based on your own research.

CRYPTO DIVERGENCE FINDERThis indicator allows you to easily compare any ticker you're looking at with the ones I've found to work best over many years of studying the crypto market. For these reasons, the code of the script is hidden because that is exactly what makes it unique.
You can choose any cryptocurrency, but I recommend using only perpetuals on 'BINANCE' exchange.
If the comparison mode is enabled, the current ticker you are viewing is divided by the ticker selected in the indicator.
For example, if you are watching "SOLUSDT.P" you should open the settings of the indicator and write "SOLUSDT.P" in the ticker field. Then you will get the SOLUSDT.P correlation index with other crypto and currency pairs that are correlated (like I already said this is something that is product of many years of studying this market and this is exactly what is unique about the code so the source of the script have to stay protected).
If you are a beginer, you can just apply simple trend-breakout strategy after you spot the divergence.
For advanced traders, you can use this together with ICT's and SMC concepts as a confirmation upon your entry.

Futures SignalThis is a Futures Signal Indictor works using support & resistance and market trend, it is designed for all type of markets (crypto, forex, stock etc.) and works on all commonly used timeframes (preferably on 5 Min, 15 Min Candles).
How it works Futures Signal Indictor :
Core logic behind this indicator is to finding the Support and Resistance , we find the Lower High (LH) and Higher Low (HL) to find the from where the price reversed (bounced back) and also we use a custom logic for figuring out the peak price in the last few candles. Based on the multiple previous Support and Resistance (HH, HL, LL LH) we calculate a price level, this price level is used a major a factor for entering the trade. Once we have the price level we check if the current price crosses that price level, if it crossed then we consider that as a long/short entry (based on whether it crosses resistance or support line that we calculated). Once we have pre long/short signals we further filter it based on the market trend to prevent too early/late signals. Along with this if we don't see a clear trend we do the filtering by checking how many support or resistance level the price has bounced off:
Stop Loss and Take Profit: We have also added printing SL and TP levels on the chart to make the it easier for everyone to find the SL/TP values. Script calculates the SL value by checking the previous support level for LONG trade and previous resistance level for SHORT trades. Take profit are calculated in 0.5 ratio as of now.
Long: To open a trade in the direction of market rise
Short: To open a trade in the direction of market decline
Entry Price: Signal entry price
TP: Points where you can place a target
Stop: The point at which the deal is closed.

Crypto Tipster v2 - Trend Oscillator---------------------
Crypto Tipster v2 - Trend Oscillator
Following on from the release of Crypto Tipster v2 toward the end of 2022, we've been working on a way to visually represent how our indicator works, so our members can utilize more tools and therefore make better informed trading decisions by setting up Crypto Tipster v2 more accurately to suit their individual trading needs.
Trend Oscillator is designed to work alongside Crypto Tipster v2 by providing an oscillating line graph between 0-100. This plot indicates the overall trend strength when all our Crypto Tipster algorithms combine and will help you understand the inherent movement behind the scenes within Crypto Tipster v2.
We have included options that have been previously unavailable within Crypto Tipster v2 - including:
- A variable threshold of trend strength before placing orders
- The ability to place orders when trend strength crosses the mid point of the oscillator (50)
- Placing orders when the trend oscillator detects a change in direction
As well as these options as listed above we've included a function to overlay a Moving Average onto the trend oscillator to help smooth out any potential whipsaw's and false moves. This is particularly helpful when combined with "placing orders on direction change" as listed. Numerous moving average options have been included which include (but are not limited to) SMA, EMA, WMA, VWMA, DEMA, TEMA, SMMA, Hull, ZEMA.. the list goes on!
We've been wanting to include several features like these and more within Crypto Tipster v2 for some time now, but have found it difficult to include these features without causing a certain amount of confusion over what they are, what they do, how they work and therefore what their benefits actually are - a few words and an input box just don't portray the message we need to get across when used solely within Crypto Tipster!
With "Trend Oscillator" we can now release all of these updates without concern of being mis-understood. The visual representation that this oscillator offers helpfully describes what we couldn't describe within Crypto Tipster v2 before.
This script is free to use for all, you don't even need to be a member of Crypto Tipster - however, those of you who are signed up with theCrypster will definately receive the biggest benefit from this script. Alerts are not available with our Trend Oscillator, as are "Buy", "Sell" or "Close" labels on the main chart.
We've got many more updates and add-ons planned for the coming weeks and months, stay tuned!
---------------------
We've tried to make Trend Oscillator as comprehensive and easy to understand as possible, we are however always in search of progression; we do really love to hear your feedback :)
For more information or for a 7-day free trial of Crypto Tipster v2 please visit the link in our signature!
Happy Trading Guys

Futures SignalThis is a Futures Signal Indictor works using support & resistance and market trend, it is designed for all type of markets (crypto, forex, stock etc.) and works on all commonly used timeframes (preferably on 5 Min, 15 Min Candles).
How it works Futures Signal Indictor :
Core logic behind this indicator is to finding the Support and Resistance , we find the Lower High (LH) and Higher Low (HL) to find the from where the price reversed (bounced back) and also we use a custom logic for figuring out the peak price in the last few candles. Based on the multiple previous Support and Resistance (HH, HL, LL LH) we calculate a price level, this price level is used a major a factor for entering the trade. Once we have the price level we check if the current price crosses that price level, if it crossed then we consider that as a long/short entry (based on whether it crosses resistance or support line that we calculated). Once we have pre long/short signals we further filter it based on the market trend to prevent too early/late signals. Along with this if we don't see a clear trend we do the filtering by checking how many support or resistance level the price has bounced off.
Stop Loss and Take Profit: We have also added printing SL and TP levels on the chart to make the it easier for everyone to find the SL/TP values. Script calculates the SL value by checking the previous support level for LONG trade and previous resistance level for SHORT trades. Take profit are calculated in 0.5 ratio as of now.

Crypto Terminal [Kioseff Trading]Hello!
Introducing Crypto Terminal (:
The indicator makes use of cryptocurrency data provided by vendor INTOTHEBLOCK.
NOTE: The cryptocurrency on your chart must be paired with USD or USDT. Data won't load otherwise - possibly transient. For instance, BTCUSD or BTCUSDT, ETHUSD or ETHUSDT.
Provided datasets:
Twitter Sentiment Data
Telegram Sentiment Data
Whale Data (i.e. % of Asset Belonging to Whales)
$100,000+ Transactions
Bulls/Bears (Bulls Buying | Bears Selling)
Current Position PnL (Currently Open Positions for the Coin are Retrieved and Plotted. Data is Split into Currently Profitable Positions, Losing Positions, and B/E Positions)
Average Balance
Holders/Traders Percentage (Addresses are Retrieved and Classified as Holding Accounts or Trader Accounts)
Correlation
Futures OI
Perpetual OI
Zero Balance Addresses
Flow (Money Inflow & Outflow)
Active Addresses
Average Transaction Time
Realized PnL (Addresses with Realized Profits, Realized Losses, and B/E)
Cruisers
A few more data points are provided.
Additionally, you can plot the values of any dataset in a pane below price.
Below are images of plottable data; different cryptocurrencies will be shown for each example (:
Twitter sentiment data.
Assess this data lightly; difficult to confirm accuracy.
Telegram sentiment data.
Assess this data lightly; difficult to confirm accuracy.
Percentage of asset belonging to whales.
$100,000+ transactions (volume oriented)
Bulls buying; bears selling.
Current positions at profit; current positions at loss; current positions at breakeven.
Average balance.
Percentage of asset belonging to traders; percentage of asset belonging to holders.
Asset's 30-interval correlation to BTC.
Perpetual open interest.
Zero-balance addresses.
Flows.
Active addresses.
Average transaction time.
Addresses at realized profit; addresses at realized loss; addresses at breakeven.
Cruiser data.
Futures open interest.
Naturally, this data isn't provided for every cryptocurrency; NaN values are returned in some instances.
Table 1
I provided three data tables, which load independently, so you don't have to change plotted data to access values.
Table 2
Lastly, you can create a 10-asset crypto index and run calculations against it.
The image shows an example.
I'll update this script with additional calculations/data in the near future. If you've any suggestions - please let me know!
Enjoy (:

Trend Friend - Swing Trade & Scalp Signals - Stocks Crypto ForexTREND FRIEND is a custom built, data driven algorithm that gives buy and sell signals when many different factors line up together on a single candle. It is designed to catch every move so you can expect early entries and exits across all of your favorite markets. Use scalp mode for early entries with lots of signals or swing mode for longer swings with fewer signals and long swing mode for really long swing trades with even less signals.
The best markets to use this indicator on are high volume tickers with a lot of price action as these markets have enough data to use to give the signals the algo needs to be able to detect highly probable moves in price. That being said, it works across all markets such as stocks, crypto, forex and futures and across all timeframes(on really long timeframes it may not give signals due to not having enough data to work with).
***MAJOR POINTS TO REMEMBER BEFORE USING THIS INDICATOR***
The algo is designed to catch major moves, so if a signal seems to come in late, it is highly likely the market is about to reverse so use caution when taking signals that seem late. This typically happens because the market is indecisive so always be careful in these situations and just wait for a better signal when markets are really decisive.
Always trade in the direction of the trend meaning the volume weighted moving average clouds. There is also a trend detection label and risk level label that you should follow to keep your trades as safe as possible. The safest way to do this is only trade short when the VWMA 100 is below the VWMA 500 and a Bear signal comes in very close to a VWMA line. Only trade long when the VWMA 100 is above the VWMA 500 and a Bull signal comes in very close to a VWMA line.
If price is between the moving averages, play the VWMA 100 and VWMA 500 as support and resistance and only take signals near one of the VWMAs with the plan of price returning to the other VWMA. If you are taking trades against the trend, like trying to buy the dips or sell the tops, wait for price to cross the VWMA 100 before following a signal.
If the VWMA 100 and VWMA 500 are close to each other and/or moving sideways, you can expect choppy price action and consolidation so use caution when taking trades during this time. It is better to wait for the price to hold above or below both VWMAs and stay supportive there before taking trades. Waiting for volume to increase is also a good way to avoid chop after the trend decides a direction.
This indicator will repaint sometimes before the candle has closed, so either wait for the candle to close with a signal before entering trades or only take signals before it closes on candles with good volume and technical analysis backing it.
***ALL THE FEATURES YOU NEED***
Trend Friend has multiple features designed to help you trade better and make decisions faster.
Buy & Sell Signals - When the algo detects all of our required parameters lining up on a single candle, Trend Friend will give Bull or Bear signals on the chart. Bull means upward price action is expected. Bear means downward price action is expected.
Take Profit Signals - When the price action makes a move that typically signals a reversal, a take profit signal will show up on the chart to help you get out of a trade before the next signal comes in.
Risk Levels For Signals
There is a risk detection system that tells you how risky each signal is as it comes in to help you stay out of dangerous trades. Wait for signals with low risk and you’ll be much safer than trying to take trades against the trend.
Alerts - There are options for alerts on buy signals, sell signals, take profit signals, price crossing the VWMA 100 and price crossing the VWMA 500. All of these can be controlled using tradingview alerts so you don't have to watch the charts and wait for things to happen. These alerts can also be used to send orders to trading bots if you choose.
Candles Painted Green Or Red According To Buy & Sell Pressure - By default, this indicator paints the candle sticks green, red or blue according to buy & sell pressure(DMI). You will need to turn off candle colors in your chart settings for this to appear correctly.
Percentage Updates - The table on the right has live percentage updates so you don’t have to measure out every move you are expecting. It will tell you the percentage from closest fibonacci levels, percentage away from the VWAP, percent gain or loss from the last signal entry and percentages from your own trades that can be configured in the settings. These help you always know how much more you can squeeze out of a trade and where your position stands without having to switch screens between Tradingview and your broker constantly.
Moving Average & VWAP Clouds - We included two color coded volume weighted moving averages(VWMA 100 and VWMA 500) and a color coded RMA 10 moving average. We also have a VWAP dotted line and cloud so you can easily see the trend direction on the chart at all times. The cloud and moving averages will turn green or red in real time depending on whether price is above or below each moving average or the VWAP respectively.
Trend Detection Label - The top label on the percentage update table tells you if the trend for this timeframe is Bullish or Bearish as well as when the trend is undecisive with choppy price action expected.
Chop & Low Volume Warning Labels - When price action is choppy or there is very low volume compared to historic candles, a warning label will appear at the top of the screen so you know to use caution and stay out of trades during these times.
Auto Fibonacci Levels - The chart will automatically populate fibonacci retracement and extension levels. The percentage update table will also give you real time updates on how far away the next fibonacci levels are from the current price.
Bounce Zone - We also included a very long term moving average cloud(EMA 1000 and EMA 2000) that shows as purple on the chart. When price enters that cloud, you can expect a reversal in that area. If price was trending above the cloud, expect that cloud to act as support. If price was trending below the cloud, expect that cloud to act as resistance. When price is trying to break through that cloud in either direction you can expect price action to be choppy and big moves to happen once price gets supportive in that zone and breaks out.
Margin Multiplier - If you are using margin to trade, our margin multiplier will multiply all of the percentage updates by the margin level you input in the settings tab so your percentages will reflect the percentages in your account.
***HOW TO USE***
Scalp, Swing And Long Swing Mode
You can choose from scalp mode, swing mode or long swing mode in the indicator settings. It is set to scalp mode by default. Scalpers will want to use the scalp mode as it provides early entries and exits and is designed to catch every move quickly. Swing mode is designed to catch almost every move and filter out some of the noise so it will have less signals than scalp mode. Long swing mode is designed to catch those lengthy moves and will hold positions the longest but give entries later than the other modes.
Try all three on a few charts and timeframes to see which setting matches your trading style the best. If you want more signals with any of the 3 modes, go to a lower timeframe. If you want less signals on any mode, go to a higher timeframe.
Bull & Bear Signals - When all of our algo parameters line up, a BULL or BEAR label will print on the chart. Bull labels will be colored green and bear labels will be colored red. Bull indicates a good place to enter a long trade because the algo is detecting patterns that indicate price should move upwards. Bear indicates a good place to enter a short trade because the algo is detecting patterns that indicate price should move downwards.
For best results using these signals, take trade signals that line up very closely with fibonacci levels or volume weighted moving averages or the vwap or any combination of them. It is also recommended to only take trades in the direction of the trend to avoid trading false reversals. Wait for low risk signals using our risk identifier and then enter the market. Waiting for good volume to come in will also help you avoid chop and catch those quick moves.
Also, make sure to check the percentage updates table to see if the expected move to the next fibonacci level is far enough away to make the risk to reward ratio worth taking the trade. Watch for signals when the VWMAs squeeze together after a wide gap and price breaks out with a corresponding signal as these can bring large, quick moves in price. Use caution when the VWMAs are close to each other and trending sideways as this usually brings choppy price action.
(The bull and bear signals can be turned on or off in the indicator settings input tab. Useful if you want to clean up the chart or only show bear or bull signals according to the trend.)
Take profit Signals - Take profit labels will show up on the chart when a reversal candle pattern or reversal indicator pattern is detected while a trade is still open. Use these signals as times that it may be a good point to exit the trade to avoid losses or reduced profits.
(The take profit signals can be turned on or off in the indicator settings input tab.)
Risk Level Label
Taking trades against the trend is dangerous because there are more false bottoms than there are actual bottoms. Our risk detection label is there to keep you from taking dangerous trades against the trend. The label will say Low Risk when the trend is in the same direction as the last signal given. The label will say Medium Risk when the trend is neutral because price likes to chop around during these times. The label will say High Risk when the trend is in the opposite direction as the last signal given.
Make sure you wait for the risk level detector to show Low Risk before taking trades or you may be buying a false bottom.
Candles Colored According To Buy & Sell Pressure - By default this indicator will paint the candlesticks green, red or blue depending on the buy & sell pressure for those candles using the Directional Movement Index or DMI. If buy pressure is higher than sell pressure, it will paint green. If Sell pressure is higher than buy pressure, it will paint red. If buy pressure is equal to sell pressure, it will paint blue. Use this to confirm which direction buying and selling is favoring and use a change in color trend to determine reversal points early. For this to work correctly you will need to go into chart settings(gear icon top right) and in the symbol tab turn off body, wicks and border.
(The buy & sell pressure candle coloring can be turned on or off in the indicator settings input tab.)
Auto Fibonacci - This indicator will automatically populate fibonacci retracement and extension levels for you. These levels are calculated using the previous high and low. You can switch the source between the previous day, week, month, quarter and year(the weekly setting is the default as it is great for day trading). The previous high and low levels will show as white(These are very important levels so watch for price to bounce off of the white lines). The percentage update table will also show the percentage gap from the current price and the next closest fibonacci level above and below, with labels telling you which fib levels they are.
(The fibonacci levels can be turned on or off in the indicator settings input tab.)
Volume Weighted Moving Averages With Clouds - The red or green moving averages should be treated as dynamic support and resistance as well as a visual way of telling current price trends. You can expect price to bounce off of these moving averages very often and quick moves usually happen when price breaks out of these moving averages.
The safest long trades you can take will be when the VWMA 100 is above the VWMA 500 and you get a BULL signal that is very close to the VWMA 100 or VWMA 500. The safest short trades you can take will be when the VWMA 100 is below the VWMA 500 and you get a BEAR signal that is very close to the VWMA 100 or VWMA 500.
When the moving averages squeeze together and price bounces between them, you can expect big moves in price when it breaks out. If price has been trending up and the moving averages squeeze together, expect the price to fall quickly once it breaks down from there. If price has been trending down and the moving averages squeeze together, expect the price to jump quickly once it breaks out from there.
These moving averages and the clouds associated with them will paint green when price is above them, indicating a bullish trend and they will change to red when price is below the moving averages, indicating a bearish trend.
You can also use the moving averages as support and resistance levels when markets are moving sideways. Since these are volume weighted moving averages, price tends to stick to them very well and paints a much clearer picture of what is going to happen than regular moving averages that don't take volume into account. Try it on a bunch of different timeframes and charts to see for yourself.
(The moving averages and clouds can be turned on or off in the indicator settings input tab.)
Bounce Zone - The bounce zone is a purple cloud that is made up of two very long term moving averages. When price is trending above this cloud and comes back down to it, you can expect the price to bounce back upwards in this zone. If the price is trending below this cloud and comes up to it, you can expect the price to bounce back downwards when it reaches this zone.
Sometimes price will break through this cloud and you will usually notice a lot of choppy price action and accumulation in this zone. When price does break out of it, you can expect fast, large moves. I also like to call this zone the safe zone because taking trades in this zone is typically a very safe place to enter trades depending on how the price is trending before it entered this zone. If you look at the cloud on any of your favorite charts, you will see that the cloud usually represents support and resistance areas quite well.
(The bounce zone can be turned on or off in the indicator settings input tab.)
Chop & Low Volume Warnings - When price is choppy, it can be a portfolio killer. When volume is low, it can give false signals or the market can reverse easily, so stay out of trades when these warning labels appear on your chart. If you were already in a trade when these warnings appear, keep a close eye on your trades and be ready to exit if things start to go the wrong way.
Long & Short Entry Calculator - Here you can enter your own entry price for short or long positions so that your actual P&L will be shown live on your chart. This eliminates the need to calculate percentages in your head or switch screens to your broker often or use the measuring tool to calculate your P&L. These will show as zero until a trade price is entered.
Margin Multiplier - If you use margin to trade, enter your margin multiplier in this input and all of the percentages in the percentage update table will reflect how far each level is based on your margin. So a 5x margin will multiply all percentages in the chart by 5 and so on. This way you don’t have to calculate everything in your head or switch between your chart and your broker constantly.
Customization - Go into the indicator settings and you can customize just about everything to suit your style. In the Input tab you can: turn the Bull or Bear labels off or on so you only get the signals that are going in the direction of the trend, turn on or off the moving average lines & clouds, turn on or off the vwap & clouds, set your fibonacci timeframe or turn them off completely and set your long or short entry price as well as your margin level for percentage updates according to your portfolio.
You can also easily customize: the moving average lines & clouds, the bounce zone lines and cloud, the vwap color and line style, the support and resistance line colors and thickness, the bull and bear label styles, the take profit label styles and more.
***MARKETS***
This indicator can be used as a signal on all markets, including stocks, crypto, futures and forex as long as Tradingview has enough data to support the calculations needed by the algo.
***TIMEFRAMES***
Trend Friend can be used on all timeframes.
***IMPORTANT NOTES***
For the buy & sell pressure colored candles to show up properly you will need to go to the chart settings(gear icon in top right corner) and in the symbol tab turn off body, wicks and border.
No indicator can be right 100% of the time and remember that past results do not guarantee future performance. You still need to make smart decisions when using this indicator to be successful. It is also important to note that markets with little volume and price action may not give very good signals due to many different parameters needing to line up on one candle for a signal to be given so use it on high volume tickers with lots of price action for best results.
***TIPS***
Try using numerous indicators of ours on your chart so you can instantly see the bullish or bearish trend of multiple indicators in real time without having to analyze the data. Some of our favorites are our Volume Spikes, Directional Movement Index + Fisher, Volume Profile with DMI, and MOM + MFI + RSI with Trend Friend. They all have real time Bullish and Bearish labels as well so you can immediately understand each indicator's trend.

AI Crypto Signals BTCUSD 15m Ultimate ScriptBYBIT:BTCUSD
Hello everyone! Sky First Capital in partnership with AI Crypto Signals is proud to introduce the AI Crypto Signals 15M BTCUSD Ultimate Script . This script works well on the 15M, 30M, 45M and 1HR chart using traditional candles. This means no false data or inaccurate entry/exit points such as with the ones using HA candles.
The script is based upon an initial strategy developed by user Bunghole here on TradingView, but we have optimized it, back-tested it with ideal settings, and added alerts that you can use to connect with your trading bot such as Alertatron, Cornix, etc. This script uses BB (Bollinger Bands) and RSI (Relative Strength Index) as indicators for signals.
Back-testing data for the 15M chart from 7/1/2021 to 10/15/2021 showed a 51.19% profit.
Back-testing data for the 1HR chart from 7/1/2021 to 10/15/2021 showed a 191% profit.
This script does not repaint.
Ideal use is to enter and exit at the close of the candle and take-profit/stop-loss once per candle.
This script has Entry/Exit/Take-Profit/Stop-Loss alerts.
We offer consulting and training services if you need help on using this script or getting it configured with an automated trading system.
We offer a 24 hour free trial of the script, send us a message to request access.

Mid to High daily % - MA & ThresholdPurpose of this script is to provide a metric for comparing crypto volatility in terms of the % gain that can be garnished if you buy the midpoint price of the day and sell the high***. I'm specifically using bots that buy non-stop. This metric makes it easy to compare crypto coins while also providing insight on what a take profit % should be if I want to be sure it closes often instead of getting stuck in a position.
Added a few moving averages of (Mid-range to High Daily %). When these lines starts to trend down, it's time to lower the take profit % or move on to the next coin.
Decided to add a threshold so I could easily mark where I think the (Mid-range to High Daily %) is for most days.
Ex. I can mark 10% threshold and can eyeball roughly ~75% of the days in the past month or so were at or above that level. Then I know I have plenty volatility for a bot taking 5% profit. Also if you have plenty of periodic poke-through that month (let's say once a week) you might argue that you can set it to 7% if you're willing to wait about that long. Either way this metric is conservative because it is only the middle of the range to the high, a less conservative version might provide the % gain if you bought the day low and sold the day high.
***Since this calculation only takes the middle of the range and the high of the day into account, red days are volatile against a buyer but to your advantage if you are a seller. BUT if you have plenty of safety buy orders this volatility in price only means your total purchase volume increases and when/if you reach a take profit level you sell more there.
Would like to upgrade and add a separate MA line for green days and a separate MA line for red days to discern if that particular coin has a bias. Also would like to include some statistics on how many candles are above or below threshold for a certain period instead of eyeballing.

Ichimoku Cloud Strategy Long Only [Bitduke]Slightly modificated and optimized for Pine Script 4.0, Ichimoku Cloud Strategy which, suddenly, good suitable for the several crypto assets.
Details:
Enter position when conversion line crosses base line up, and close it when the opposite happens.
Additional condition for open / close the trade is lagging span, it should be higher than cloud to open position and below - to close it.
Backtesting:
Backtested on SOLUSDT ( FTX, Binance )
+150% for 2021 year, 8% dd
+191% for all time, 32% dd
Disadvantages:
- Small number of trades
- Need to vary parameters for different coins (not very robust)
Should be tested carefully for other coins / stock market. Different parameters could be needed or even algo modifications.
Strategy doesn't repaint.

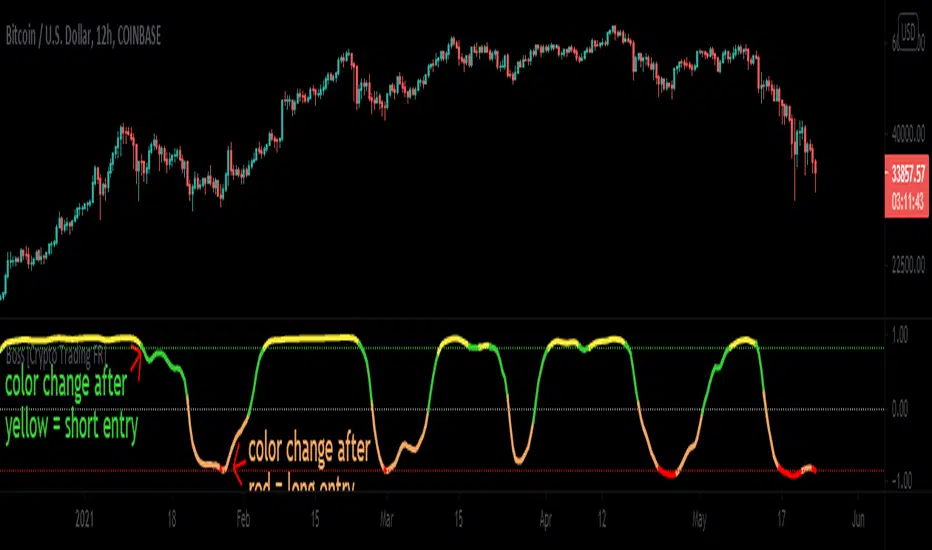
Boss Oscillator [Crypto Trading FR]The Boss Oscillator is a momentum indicator using support and resistance levels and refers to the position of the closing price in relationship to the price range over a period of time. It is calculated as the difference between the close and the low, divided by the price range (the difference between the high and low over a certain period of time). Thus, the indicator takes a value between 0,1 and -0,1 and is expressed in percentage points.
A Boss Oscillator value over 0,92% (yellow) indicates that the security is OVERBOUGHT and a crossover below that threshold represents a potential sell signal while a value below -0,92% (red) indicates that the security is OVERSOLD and a crossover above that threshold indicates a potential buy signal.
Optimal conditions for considering a short Entry
During an uptrend, sell when you get a short signal: the "Boss Oscillator" (yellow overbought line) drops below 0,92% (higher band) and is turning green.
Optimal conditions for considering a long Entry
During a downtrend, buy when you get a long signal: the "Boss Oscillator" (red oversold line) rises above -0,92% (lower band) and is turning orange.
Triggers for scaling/adding into your position = Keeping in mind that this oscillator on its own is not meant to be the sole reason for taking a trade, here are some triggers you will see for getting into position (preferably with the optimal conditions being met) The Oscillator flips from yellow color into a red slide and vise versa. The Oscillator crosses the midline up or down. The Oscillaor begins going up/down and is crossing the midline levels at 0. The Oscillator shift from one color to the next in the favored direction of the trade you wish to make.
Signs for taking profit and protecting your trade = the Boss Oscillator changes colors at the top or bottom.
Zeta CryptoAre you excited about Crypto Trading?
Crypto Trading is gaining immense popularity due to the excitement and returns it gives.
However, traditional indicators based upon lagging factors which generate Buy/Sell signals very late can not be used with crypto-trading.
The need of the hour is to create an indicator from ground up which reacts instantly when the price action starts and gives you much earlier entry or exit as compared to traditional lagging indicators.
Zeta Crypto is one such indicator which is based upon price cum volume action. It is said that "volume precedes price" or 'volume must validate the price move" and it is true in most of the situations.
Zeta Crypto tracks price and volume for you and keeps comparing it with historical data and as soon as it detects spikes, it gets into action and generates Buy/Sell signals right on your chart.
How to take Entry and When to Exit?
As soon as you see a Buy/Sell Signal on a candle, mark its closing price and if next or any subsequent candle opens and starts going in the same direction and clears the closing price of signal candle (where Buy/Sell signal is printed), Enter the trade and trail it till either (1) Opposite signal does not come or (2) Your Trailing Stop Loss is hit or (3) Till price again comes back to your Entry Level and starts hurting your position.
What Time Frame to use?
Do not use less than 5 min. Time Frame for this indicator. The best results are seen at 5 min., 10 min. 15 min. & 30 min. time frames. Higher time frames will give you delayed entry and lower than 5 min. will be too volatile.
What is the purpose of Support/Resistance Lines appearing on your chart?
These lines might offer you early entry or exit when the price approaches a Resistance or Support line.

Extreme Money [Crypto Trading FR]Extreme Money aims to smooth out market fluctuations and predict trend changes.
The algorithm shows the turning points in the market and uses multiple filters to present the best potential turning points. Although this is its core functionality, Extreme Money also incorporates a series of popular other indicators (see below) allowing full identification of trends on the chart.
The tool aims to calculate market strength and then show potential turning points in the market signalled with small circles. Once the trend confirmation has changed, the algorithm signals a circle, giving the trader the potentially desired entry with an audible or pop-up alert if needed. The more circles there are when setting up the entry, the greater the chances of a trend reversal.
This algorithm can be used on all time intervals, as well 5, 15 or 30 minutes but it is particularly recommended on the 1H, 2h and 4H intervals for maximum efficiency. The indicator works as well for swing-trading as for intra-day trading: whatever the time interval selected, it filters potential entries with great precision.
The algorithm can also be used with any cryptocurrency or currency pairs from traditional markets, the parameters of the algorithm can be customized and adapted without difficulty.
Extreme Money also includes 8 indicators assembled in a single script, which can be activated or deactivated manually:
1) Algo (main indicator)
2) EMA
3) Hull
4) Trend
5) Pivots
6) Trend line
7) VWAP Line
8) RSI Swing
Benefits :
- Notifies the trader of potential entries
- Color coded entries for buying and selling
- Creates cluster signals at potential turn points
- Aims to avoid market noise
- Used on all types of timefames
- Analyze the current market trend
- Assists in Predicting Market Turn Points
- Cryptocurrency, FX, stock indices and gold trades
- Maximize profits
- Analyzed market strength and weakness

Intraday Trading Tool [VK]This Indicator is all you need to day trade.
Overview: This is a intraday/scalp trading Indictor works using MTF- MA,MACD,RSI for trend ,SRSI For Entries , Murrey Lines for Targets and ATR For Stop Loss , it is designed for all type of markets (crypto, forex, stocks, commodity etc.) and works on all commonly used timeframes .
About The Indicator :
This indicator uses the most commonly used indicators in The markets, MA channel + MACD (Background Trend) + RSI (Trend On Top) . This Three Indicators Are Used For Trend In Higher Time Frame. We Have to take trades based on Trend In Higher Time Frames. We are using SRSI For entries which Has the function to show entries from Higher Time Frames .
Stop Loss And Take Profit : we have used ATR for Stop Loss which will show up with Buy/Sell Signals. and for Taking Profit We Have used Murrey Lines Which Can be used to see Support/Resistance as Targets And also has the function to show Support/Resistance from Higher Time Frame.
Extra Function :
The Cross And Triangles On the Bottom of the Chart Indicates MACD Cross on Higher Time Frames .
How to get access:
Send a Private Massage for getting access to the script.

ETH/USD 15m [iTradebot]1. General
2. Additional information
3. Access
1. This is a script for crypto trading strategies, based on following trends with moving averages.
A fast moving average and a slower getting crosschecked with MACD for buying/selling signals, those signals get crosschecked by 5 different factors, like the MACD or controlling average.
Only if all requirements will be met, the script expects the trend to change and sends an according signal.
This strategy is not made for multiple entries and keeps a position open until an opposite signal gets triggered.
It was built with ETH/USD 15min chart in mind, but can be used on any other chart, though you will have to find a different combination in inputs, to make it work with other pairs or timeframes.
Fast average: The faster of the two signal moving averages.
Slow average: The slower of the two signal moving averages.
Trend strength: Determines the crosscheck with the MACD.
Control length: Sets the period length for the control average (1=1bar, 300=300bars)
Inputs used here are:
Fast average: 5
Slow average: 19
Trend strength: 4
Control length: 306
Start capital: 1000
Trade equity: 100%
Commission: 0.036% (Binance)
Result 2020-06-11 until 2021-01-07
Net Profit: 717.56%
Percent Profitable: 54.17%
Max Drawdown: 8.79%
Profit Factor: 6.523
2. There are many combinations with good net profit outcomes, but make sure to also keep a low "Max Drawdown", to lower the risk substantially.
The combination we used, gives slightly less profit than other combinations, but also lowers the max drawdown from 20% to 9%.
In general in trading with crypto we advice to only use this strategy with Bitcoin or Ethereum , due to their high value and "stable" movements, compared to other cryptocurrencies.
The strategy is using 100% equity each trade, so make sure to have your capital management in place on the account.
To be specific, DONT put all your capital into this one strategy, but only part of it, according to your capital management.
Control lengths around 150 or 300 tend to give good combinations with the other 3 inputs. (on the 15min chart)
3. You can test this strategy 14 days for free and get access for up to 1 year on our website.
14 day free trial only requires Tradingview user name and e-mail.
Click on the link in our signature below.

GreenCrypto Strategy
This strategy majorly uses MA, Tilson and S&R. MA is used for predicting the trend, Instead of normal cross-over of the MA, we are calculating the trend of the MA itself (whether MA is moving upward or downward by comparing the previous and current value of MA), along with MA we also use Tilson to calculate the MA.
Once we have MA and Tilson we take average and merge both MA and Tilson MA to get a double confirmation on the trend of the market. for entry and exit we use S&R with the merged MA, if the trend change is at the support or resistance level we go for LONG/SHORT respectively. Here we are doing continuous LONG+SHORT position, this provides more opportunity to capture unexpected market trend.
Enter a Long Trade when the script shows "Long" and exit either when you get "Short" signal or when it meets your target.
Parameters:
"Use 1:EST, 2:SST, 3:HST ?" : Select EMA , SMA or HullMA (works best on HullMA)
Length: Length of the EMA / SMA /HullmA
Factor: Used for calculation of Tilson and the Support and resistance .
Date/month/day : for selecting the right backtesting the period (currently it set to Jan 2018 to current day )
for this backtesting i have used 1000$ capital and 0.02% commission for each trade.
This strategy works best on 4H time fram but you can also use it on 1 day or higher timeframe charts
The default config present in this script is designed for ETH but it will also work with other coins)
Config for Specific Crypto coins (Please feel free to try out other configs also) :
ADA, BNB, EOS : "Use 1:EST, 2:SST, 3:HST ?" = 3
"Length" = 8
"Factor" = 0.9
ETC, XLM : "Use 1:EST, 2:SST, 3:HST ?" = 3
"Length" = 8
"Factor" = 0.85
Please DM me if you would like to tryout 7 Days free trail.

[Study] GreenCrypto Signal You can find the backtesting result of this indicator in here:
This indicator majorly uses MA, Tilson and S&R. MA is used for predicting the trend, Instead of normal cross-over of the MA, we are calculating the trend of the MA itself (whether MA is moving upward or downward by comparing the previous and current value of MA), along with MA we also use Tilson to calculate the MA.
Once we have MA and Tilson we take average and merge both MA and Tilson MA to get a double confirmation on the trend of the market. for entry and exit we use S&R with the merged MA, if the trend change is at the support or resistance level we go for LONG/SHORT respectively. Here we are doing continuous LONG+SHORT position, this provides more opportunity to capture unexpected market trend.
Enter a Long Trade when the script shows "Long" and exit either when you get "Short" signal or when it meets your target.
Parameters:
"Use 1:EST, 2:SST, 3:HST ?" : Select EMA , SMA or HullMA (works best on HullMA)
Length: Length of the EMA / SMA /HullmA
Factor: Used for calculation of Tilson and the Support and resistance .
This indicator works best on 4H time frame but you can also use it on 1 day or higher timeframe charts
The default config present in this script is designed for ETH but it will also work with other coins)
Config for Specific Crypto coins (Please feel free to try out other configs also) :
ADA, BNB, EOS : "Use 1:EST, 2:SST, 3:HST ?" = 3
"Length" = 8
"Factor" = 0.9
ETC, XLM : "Use 1:EST, 2:SST, 3:HST ?" = 3
"Length" = 8
"Factor" = 0.85
Please DM me if you would like to tryout 7 Days free trail.
Thanks

ETS Trending ArrowsThis indicator is the end result of years of trial and error to create an indicator that aims to mimic market entry points that a professional trader would take.
It has arrows that clearly show potential market entry points, and suggested stop-loss levels. What I like about it is that it generally responds as fast to market changes as a good trader would, leaving you enough time to still validate the move before taking it.
This basically levels the playing field, because even if you're a rookie trader, or maybe an experienced trader in a slump, this indicator can help you to identify possible trading entry points that is responsive to market moves, and that can be used on different timeframes based on how you want to trade. And if you're an experienced trader, this indicator will help you like a good trading buddy to make good trading decisions.
What Makes It So Powerful?
- Give you a signal as early as possible and does not "repaint" once the bar completes
- Reacts to fast market direction changes like a master trader
- Is super easy to understand and implement in your trading
- Can be used for Forex, Stocks and Crypto
- Works on all timeframes
How To Use The ETS Trending Arrows Indicator
1. Add the indicator to any chart you wish to trade, Crypto, Forex or Stocks and set it to the timeframe you prefer. For instance, I use it on 1 minute and 5 minute charts for daytrading Stocks. For Forex I generally use a 15 minute chart, and longer timeframes for Crypto.
2. Open the Settings and change values to suit your requirements:
2.1. "Early Trigger Live Signals / Stable Signals" - When you select "Stable Signals", the arrows will appear once the bar closes, on the new bar. Selecting "Early Trigger" will signal instantly and can give you an early entry, but may update in some cases as conditions change.
2.2 "Show More Signals" - This pretty much does what it says. If you don't want all possible signals, this will scale things back a bit and give you fewer signals.
2.3. "Show 20, 50, 200 Moving Averages" - This is just a convenience, and is provided to help you exit trades, which I typically do when price crosses back over the 9 EMA or 20 EMA.
2.4. "Show 9 Expo Moving Average" - Also provided for convenience, and separate in case you don't want this level of detail.
2.5. "Show Immediate Reversals" - Personally I don't use this setting, but someone requested that I add it. What it will do is if there is a signal, which then immediately passes the "stoploss" dotted line, this will immediately give a signal in the opposite direction.
2.6. "Show Bollinger Bands" - This is also only provided for convenience, I use Bollinger Bands to determine where the market move is in relation to the average deviation.
2.7. "Bollinger Bands Length" - Simply the regular BB length setting.
2.8. "Bollinger Bands Deviation" - I use a 2.5 setting by default in order to better identify areas where the price action is really far beyond where it should be.
3. Now that you've set things up, all you need to do is to wait for a signal. As mentioned earlier, the signals will react differently based on whether you chose "Early Trigger Live Signals" or "Stable Signals". If you opt for "Early Trigger Live Signals", like I do, you should pay attention to where the market currently is in relation to the closest moving average, like the 9 EMA or 20 EMA. Keep in mind that price will often signal a new move, but then first move back to the average, before continuing in the new direction identified by the trading arrow.
4. These signals are intended to identify new trending moves, and for that reason, if the market moves against the signal, you should not hold on to your position hoping that it will turn in your favor.
5. When the market is moving in your favor, resist the urge to exit quickly, and use either (or both) the 9 EMA and 20 EMA to exit your trades. A good approach is to use the 9 EMA to exit a portion (maybe 50%) of your trade, and exit out of the rest once price closes above or below the 20 EMA depending on the direction of your trade.
This is an "invite only" script, which means that you will need to let me know that you're interested in it before you can get access to it. This is a paid script, please follow the link in my profile to get the details or ask me directly. It may take up to 48 hours for me to respond, but I do my best to respond as quickly as possible. You will get 7 days to test it for yourself on all your charts with no restrictions.

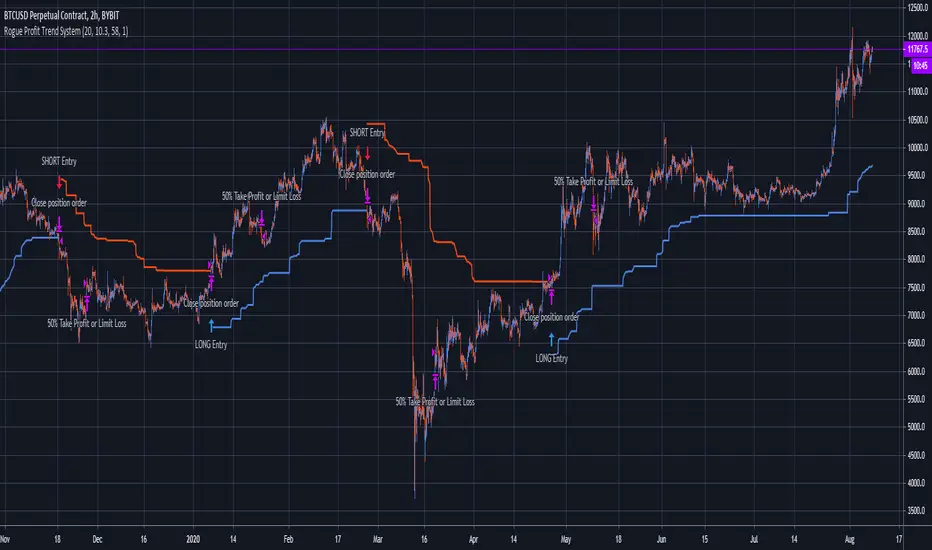
Rogue Profit Trend SystemThis system can be used for all assets. This script identifies trends and when to enter and exit. There is also built in risk management in the form of a take profit target or a reduction of risk to limit a losing trade. Inputs are variable and can be changed to better suit the asset and time frame you are trading. Since the risk management (take profit or limit loss) is calculated by 50% of your position, this system is designed to trade in multiples of two's. For example, you enter into a position with $100 at risk, when your risk management signal fires, it will reduce your position by 50% to either snag some profit or limit a loser leaving you with $50 in the position. Close the trade completely when the trend reverses for either a profit or loss.
Nothing about trading is easy. You will have losing trades. Managing your risk is the key to success which is why this system is so powerful. Markets are fluid and random so you will have to put some time and effort into adjusting the system inputs for each asset and the respective time frame you are trading and continue to adjust as time passes. This system will make you money if you manage it correctly and systematically.
Message me for two day trial access. Happy trading!
MA Pull [VK] - alert version of vkscalperThis is the alert version of vkscalper
you will need to change the settings for different TF also try changing MA types
Ability to choose MA types
Ability to plot stop loss / take profit lines
simply select buy alert or sell alert for alerts

Squeeze Momentum Strategy Signals [Bitduke]Description :
Signals based on transformed Momentum Indicator (leading indicator measuring a security's rate-of-change) with risk management system and ability and custom backtesting.
Usage:
Strategy flips long / short depending of indicator signals. There can be multiple signals of the same type, for example, 2 longs in a row, only the first of them must be taken into account.
Features :
Possible to change source: ohlc4, hl2 , hlc3, close
Enter your stop loss and take profit in %, NOT ticks
Working and robust even without take profit / stop loss
Yearly drawdown lower than 20%
Backtesting:
Backtested on BTCPERP ( FTX ).
It shows much better results on 1h timeframe (about 200% yearly, 55% in 2020) and relatively low drawdown to date.
Strategy doesn't repaint.
