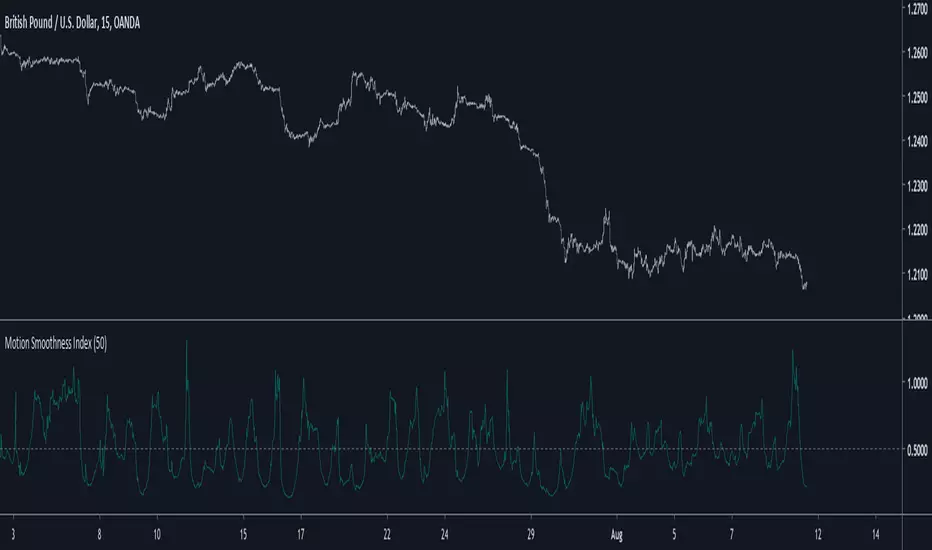
Motion Smoothness Index Introduction
Its holiday time for me, i have been working here a lot. But no leaving before publishing. Telling when market price is smooth or rough is not the easiest task, so today i present a trend metric indicator that allow you to give you this kind of information.
The Indicator
The indicator is in an approximate range of (0,1) with mean x̄ decaying for higher length's, when the indicator is below 0.5 the market is smooth, else rough, this is the simple interpretation. The indicator is simply the ratio of the price residual standard deviation and the price standard deviation.
Higher value of length will make the indicator less accurate when it comes to detect rough market price, you can still use the indicator direction or its running mean to give you insights but 0.5 is still the recommended detection threshold.
In More Depth
Even tho market is random by nature there can still be structures in the price (cycles and trends), the fractional BM model will tell you that market price is sometimes auto-correlated (trending) or non auto-correlated (ranging), knowing what is the current market state is therefore important, when price is rough it can means an excess in noise thus exhibiting an uncorrelated market at the contrary of a smoother price that can allow for auto-correlation.
Now, market is infected by noise, and thats really unfortunate but the noise posses various properties that can allow for all the structures we see in market price. So thinking about the market allowing for possible profits during auto-correlated states is encouraging.
Conclusion
Although the indicator measure smoothness/roughness it can still be interpreted as a trend/range state detector. I hope it provide to be useful.
I wish you all good holidays and see you next time ! Thanks for reading !
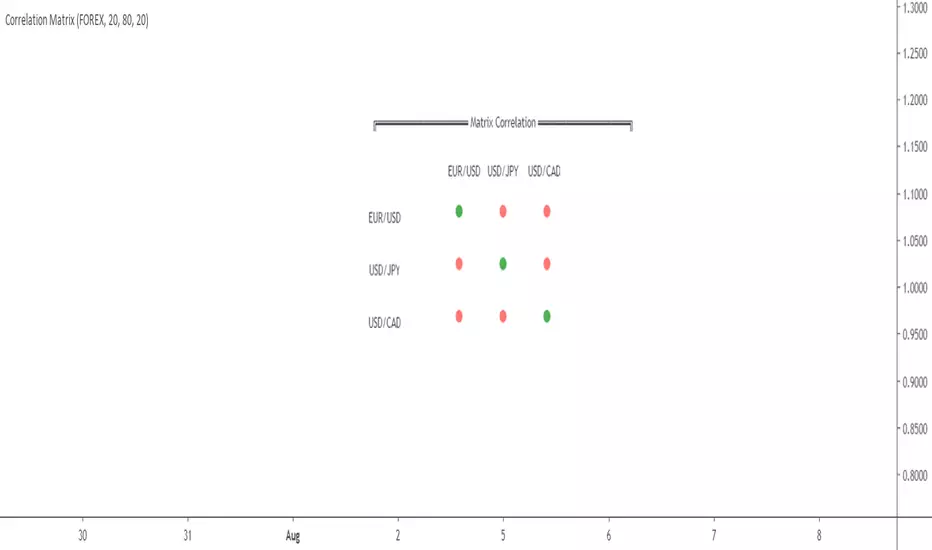
Correlation
Correlation Matrix by DaveattHi everyone
A co-pinescripter friend told me this was impossible to do and we bet a free dinner tomorrow. Guess who's going to be invited to a very fancy restaurant tomorrow :) :) :) (hint: not him)
What's the today script is about?
This script is based on this MT4 correlation matrix
Asset correlation is a measure of how investments move in relation to one another and when. ... Under what is known as modern portfolio theory, you can reduce the overall risk in an investment portfolio and even boost your overall returns by investing in asset combinations that are not correlated.
I did it because it wasn't existing before with this format. What I discovered was only correlations shown as plot lines... #this #is #not #pretty
How does it work?
The correlation matrix will not be based on the current asset of the chart BUT will be based on the current timeframe (confusing? if yes, read it again until you'll get it)
- Numbers of bars back: numbers of bars used for the correlation calculation
- High correlation level: Correlation upper threshold. If above, then the correlation will be green
- Low correlation level: Correlation lower threshold. If below, then the correlation will be red
If the correlation is between the high and low levels, then it will be displayed in orange
- FOREX/INDEX: You can choose between displaying the correlation matrix between 3 FOREX or 3 INDEX assets
Also...
So far the scale doesn't respond too well to the matrix so you'll have to adapt the scale manually. I'll publish a V2 if I'll find a way to solve this issue from the code directly #new #challenge
A quick final note on why I'm sharing so much?
It challenges me to think out of the norm, get out of my bubble and explore areas of Pinescript that I still don't know. This "a script a day" challenge allows me to speed up my learning curve on Pinescript by a billion factor (and I get a few interesting gigs as well)
Let's bring this indicator to 100 LIKES guys !!!!! I think it deserves it, don't you think? :)
PS
Before all copy/pasters will add a version with crypto tomorrow, don't bother, I already did it and will post it in a few minutes for FREE :p
____________________________________________________________
Be sure to hit the thumbs up as it shows me that I'm not doing this for nothing and will motivate to deliver more quality content in the future.
- I'm an officially approved PineEditor/LUA/MT4 approved mentor on codementor. You can request a coaching with me if you want and I'll teach you how to build kick-ass indicators and strategies
Jump on a 1 to 1 coaching with me
- You can also hire for a custom dev of your indicator/strategy/bot/chrome extension/python
ck - Crypto Correlation IndicatorA simple Correlation Indicator initially configured for Crypto Trader use (but other markets can use this too).
It plots the correlation between the current chart (say BTCUSD ) versus 4 user-definable indices, currency pairs, stocks etc.
By default, the indicator is preconfigured for:
GOLD (Oz/$),
Dow Jones Index (DJI),
Standard & Poor 500 Index (SPX) ,
Dollar Index ( DXY )
You can set the period (currently 1D resolution) in the "Period" box in the settings, valid inputs are:
minutes (number), days (1D, 2D, 3D etc), weeks (1W, 2W etc), months (1M, 2M etc)
Length is the lagging period/smoothing applied - default is 14
When changing comparison instruments/tickers, you may find it useful to prefix the exchange with the instrument's ticker, for example:
Binance:BTCUSDT, NYSE:GOOG etc
*** Idea originally from the brilliant Backtest Rookies - backtest-rookies.com ***
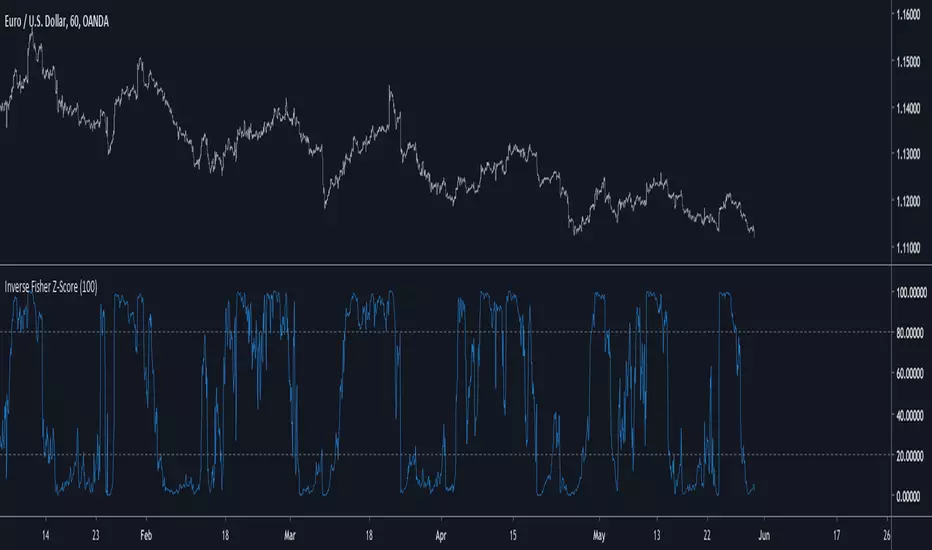
Inverse Fisher Z-Score Introduction
The inverse fisher transform or hyperbolic tangent function is a type os sigmoid function (sometime called squashing function) , those types of functions can rescale a result in a certain range and are widely used in artificial intelligence. More in depth the fisher transform can make the correlation coefficient of a time series normally distributed, in practice if you apply the fisher transform to the correlation coefficient between a time series and a linear function you will end up with an estimate of the z-score of the time series. The inverse transform however can do the contrary, it can take the z-score and transform it into a rough estimate of the correlation coefficient, if your z-score is not smooth then you will have a non-smooth estimate of the correlation coefficient, that's quite nice no ?
The Indicator
The inverse fisher transform of the z-score will produce results in a range of 1/-1, here however i will rescale in a range of 100/0 because its a standard range for oscillators in technical analysis. Values over 80 indicate an overbought market, under 20 an oversold market. The smooth option in the indicator settings will make the indicator use a linearly weighted moving average as input thus resulting in a smoother result.
The indicator with smooth option.
Conclusion
I presented a new oscillator indicator who use the inverse fisher transform of a z-score. Using the fisher transform and its inverse can give a new shape to your indicator, make sure to control the scale of your indicator before applying the fisher transform, the inverse transform should be applied to values in range of 1/-1 but you can use higher limits (2/-2,3/-3...) , however remember that higher limits will approximate an heavy side step function (square shape) . I hope you will find an use to this indicator.
Thanks for reading !
Function To Candles - Another way to see indicatorsIntroduction
There are different and better way's to see price data, a candlestick chart is one of the best way to see the price since you have access to the open/high/low/close information, this is really efficient and can allow for naked non parametric trading strategies (candlesticks patterns) . But what about making candles out of indicators ? There are tons of studies about candlesticks patterns in price data but none (?) about candlestick patterns using indicator data, therefore i made this script in order to show candles from various indicators, i also made an heikin-ashi mode.
Rsi To Candles
All the indicators are use the open/high/low/close price as input in order to return candles. length control the indicator period.
Stochastic To Candles
The stochastic oscillator is restrained in a range of 0/100, therefore when equal to 0 or 100 the candles can be flat.
Rate Of Change To Candles
The rate of change don't distort price as heavily as other indicators since its based on differencing.
Center Of Gravity To Candles
The center of gravity (cog) is defined from tradingview as "an indicator based on statistics and the Fibonacci golden ratio", its not an indicator i'am familiar with and i don't know if its the same proposed by Elhers. The candles are smooth, high length can flatten the candles heavily making them hard to see.
Correlation Oscillator
In a range of -1/1 this indicator is quite smooth and can also flatten candles.
Patterns And Heikin-Ashi
There are tons of patterns that can be generated from candlesticks, they can be applied to this indicator as well.
The indicator can show an heikin-ashi mode, heikin-ashi candlestick use averaging to plot candles, this is why they appear smoother, some signals generated from heikin-ashi candles are :
Bullish body with no lower shadows = Strong Uptrend
Bearish body with no higher shadows = Strong Downtrend
High range and small body = Indecision/Risk of reversal
Conclusion
I made an indicator able to draw candles from other indicators, those candles contain various information that can generate decision from patterns. I hope you find a use to it, if its the case share your findings with me, maybe that you will even be able find a new candlestick pattern :)
Thanks for reading !

ROC 21 coins by BiO-618Hey!
I will share with u the Rate Of Change indicator for 21 coins, it's special to use with my last published script, the Correlation formula.
You can find volatility, with a directional sense if it's a positive change, or negative change.
Hope you enjoy it!

Correlate 21 coinsHey!
I remade some dude's script to add more coins.
Its a pearson correlation indicator, which would give us an idea of the main trend and behaviour of the pairs you choose.

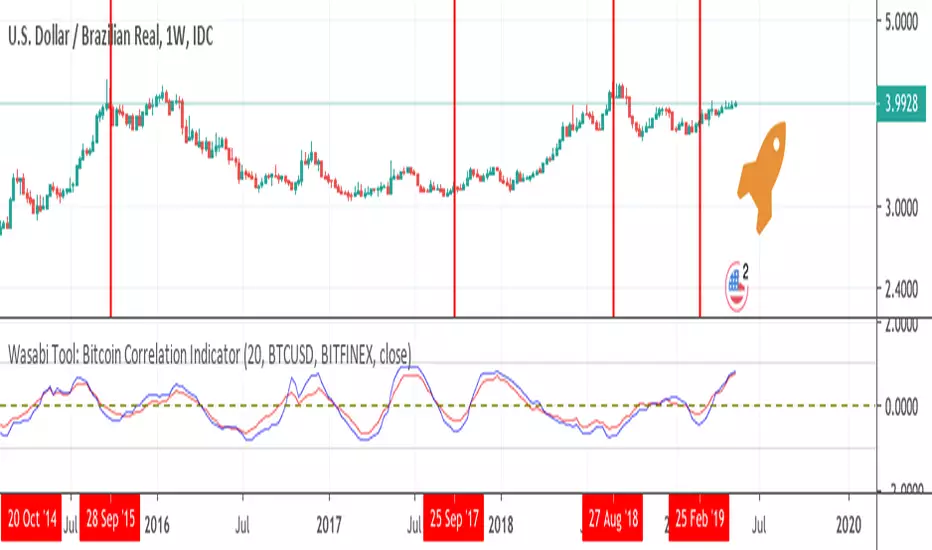
Wasabi Tool: Bitcoin Correlation IndicatorWasabi Tool: Bitcoin Correlation Indicator
This indicator shows Kendall's correlation in red and Pearson's correlation in blue.
* How to use:
As the value is getting near +1, a positive correlation gets stronger.
On the other hand, as the value is getting near -1, a negative correlation gets stronger.
---
Wasabi Tool: Bitcoin Correlation Indicator(Wasabi 전.나.구. 분석툴: 비트코인 상관관계(correlation) 지표) 는
켄달(Kendall) 와 피어선(Pearson) 상관관계 분석을 사용한 비트코인과의 상관관계(correlation)를 지표로 표시합니다.
* 선 의미:
빨간선: 켄달 계수
파산선: 피어선 계수
* 해석:
계수가 1에 가까울수록 양의 상관관계가 강하고
계수가 -1에 가까울수록 음의 상관관계가 강하다.
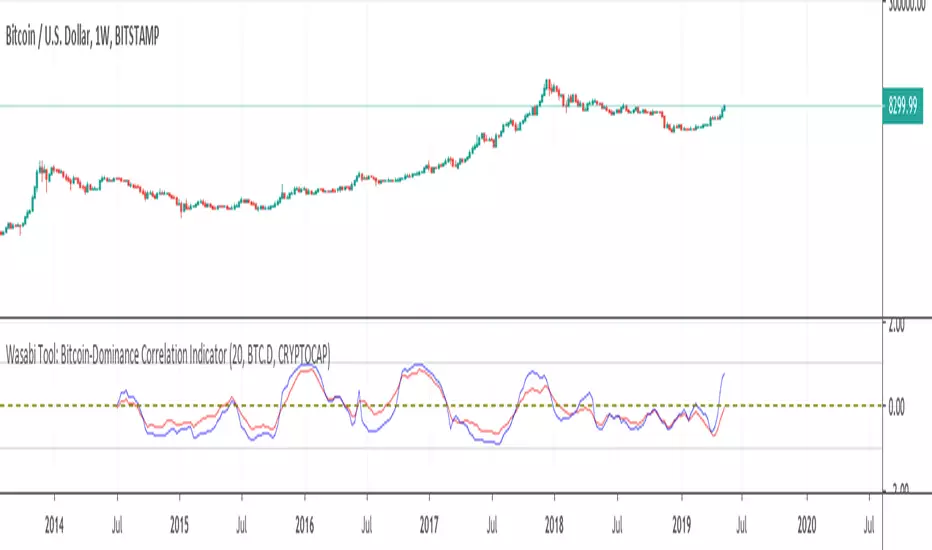
Wasabi Tool: Bitcoin-Dominance Correlation IndicatorWasabi Tool: Bitcoin-Dominance Correlation Indicator
This indicator shows Kendall's correlation in red and Pearson correlation in blue.
* How to use:
As the line is getting near +1, a positive correlation gets stronger.
On the other hand, as the line is getting near -1, a negative correlation gets stronger.
---
Wasabi Tool: Bitcoin-Dominance Correlation Indicator(Wasabi 전.나.구. 분석툴: 비트코인 도미넌스-상관관계(correlation) 지표) 는
켄달(Kendall) 와 피어선(Pearson) 상관관계 분석을 사용한 비트코인과의 상관관계(correlation)를 지표로 표시합니다.
* 선 의미:
빨간선: 켄달 계수
파산선: 피어선 계수
* 해석:
계수가 1에 가까울수록 양의 상관관계가 강하고
계수가 -1에 가까울수록 음의 상관관계가 강하다.
Japanese Correlation CoefficientIntroduction
This indicator was asked and named by a trading meetup participant in Sevilla. The original question was "How to estimate the correlation between the price and a line as easy as possible", a question who got little attention. I previously proposed a correlation estimate using a modification of the standard score (see at the end of the post) for the estimation of a Savitzky-Golay moving average (LSMA) of order 1, however something faster could maybe be done and this is why i accepted the challenge.
Japanese Correlation
Correlation is defined as the linear relationship between two variables x and y , if x and y follow the same direction then the correlation increase else decrease. The correlation coefficient is always equal or below 1 and equal or above -1, it also have to be taken into account that this coefficient is quite smooth. Smoothing is not a problem, scaling however require more attention, high price > closing price > low price, therefore scaling can be done. First we smooth the closing/high/low price with a simple moving average of period p/2 , then we take the difference of the smoothed close with the smoothed close p/2 bars back, this result is then divided by the difference between the highest smoothed high's with the lowest smoothed low's over period p/2 .
Since we use information provided by candlesticks (close/high/low) i have been asked to publish this estimator with the name Japanese correlation coefficient , this name don't imply the use of data from Japanese markets, "Japanese" is used because of the candlestick method coming from Japan.
Comparison
I compare this estimation with the correlation coefficient provided in pinescript by the correlation function.
The estimation in orange with the original correlation coefficient using n as independent variable in blue with both length = 50.
comparison with length = 200.
Conclusion
I have shown that it is possible to roughly estimate the correlation coefficient between price and a linear function by using different price information. Correlation can be further estimated by using homogeneous bridge OHLC volatility estimators thus making able the use of different independent variables. I really hope you like this indicator and thanks to the meetup participant asking the question, i had a lot of fun making the indicator.
An alternative method

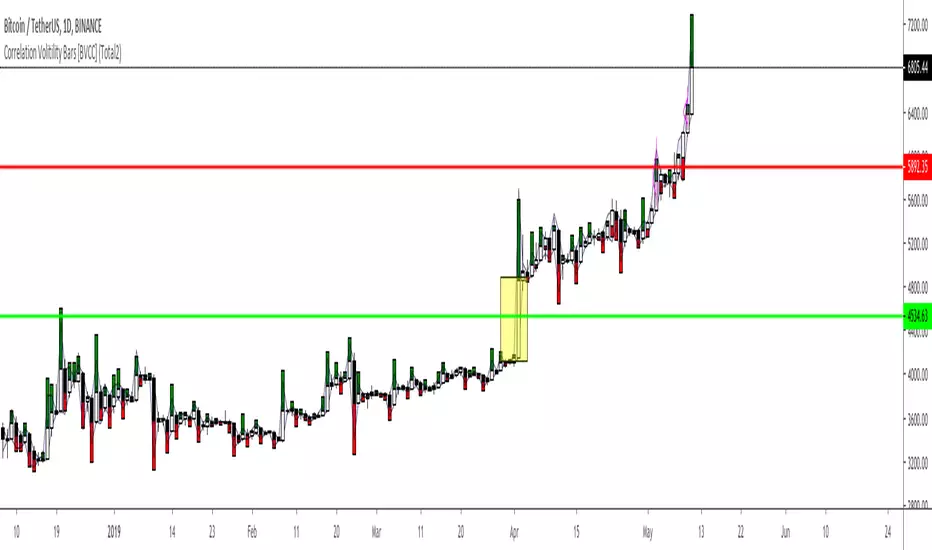
Correlation Volitility Bars [BVCC]This chart will allow you to compare the volatility of correlation of any other instrument to your current chart. When the comparison coin is selected, it will overlay your current bars with additional information that shows up/down correlation to your master chart as well the volatility of that correlation.
This can be used to compare other coins to BTC for a quick visual reference of if a coin moves with or against BTC movements. If the comparison coin moves up on the given bar, it is represented by a green histogram ABOVE of your current candle. If the comparison coin moves down, it is represented as a red histogram BELOW your current candle.
The height of the correlation candle represents the percentage that the comparison coin moved up or down. The longer the candle, the farther that coin moved.
The blue band represents a 'volatility reference'
-If your comparison coin stays within this band, then it is moving at an absolute rate which is less than the absolute rate of the master coin.
-If your comparison coin moves outside of this band, then it is moving at an absolute rate which is more than the absolute rate of the master coin.
A couple of example of how to read this;
*******Master Candle = Up | Comparison Candle = Up | Equal to Volatility Band********
This means that when the master went up, so did the comparison coin and they both moved equal amounts
******Master Candle = Up | Comparison Candle = Down | Outside Volatility Band*******
This means that when the master went up, the comparison coin went down in response and it's downward response was greater than the corresponding master up movement
******Master Candle = Up | Comparison Candle = Up | Outside Volatility Band*******
This means that when the master went up, the comparison candle responded by going up as well but made more % gains than the corresponding master candle.
Uses for this indicator would be research into the historical performance of how a specific coin reacts to BTC and whether it is a more or less profitable vehicle than BTC during that time period. If the price is consistently outside of the Volatility band then you can infer that this coin is hypersensitive to BTC movements. If the price is consistently within the bands, then you could infer that your comparison coin is relatively correlated or unfazed by BTC.
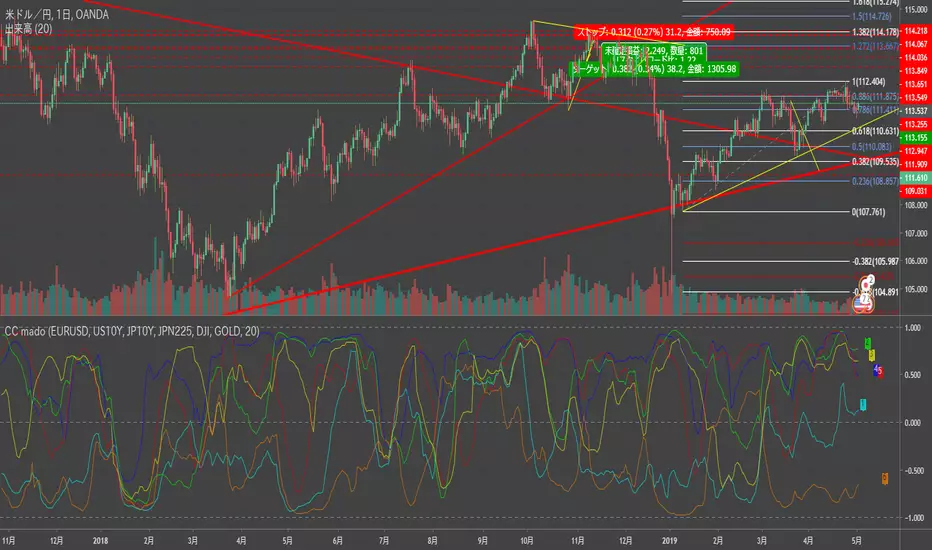
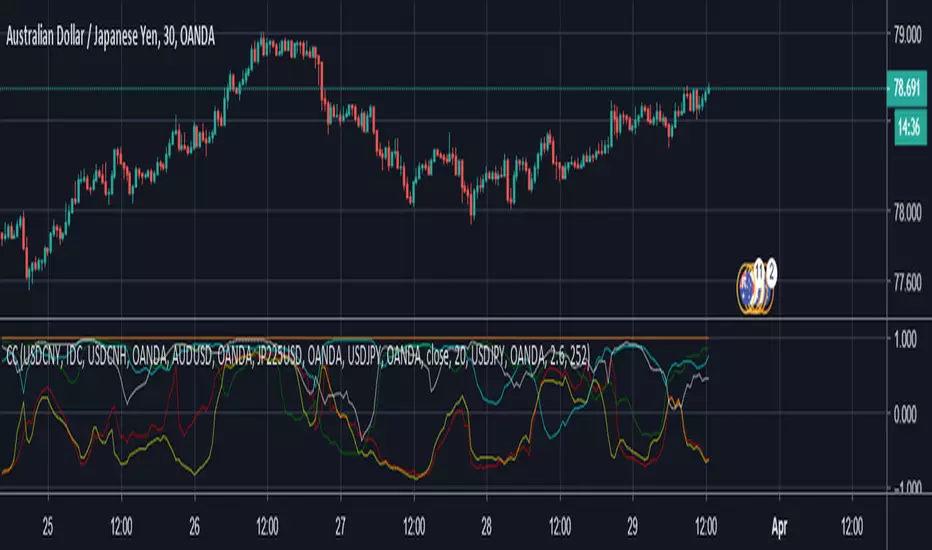
Correlation Checker[mado]you can check correlation between current symbol and another 6 symbols.
default setting for USDJPY.
EURUSD/US10Y/JP10Y/JPN225/DJI/GOLD
ex For AUDUSD, US10Y/AU10Y/NZDUSD/USDCHF/HSI/DJI
Trend Validation | www.cryptoalphaindicators.comThis indicator is designed to run in the background and provide a bird's eye view of what the prevailing trend is currently (positive/negative).
The navy blue background color indicates a positive trend underway and conversely the red background color indicates a negative trend has been detected.
Formulated with Ehler's Force Index and the Exponential Moving average.
The areas absent of color indicate that no satisfiable correlation was found between price (ema) and the price-to-volume indicator Ehler's Force Index (EFI).
The Trend Validation indicator is available for purchase at www.cryptoalphaindicators.com

Multi-Asset Correlation CoeffThis is just a modified correlation coefficient indicator that shows the correlation coefficient between five different assets and the one on the chart.
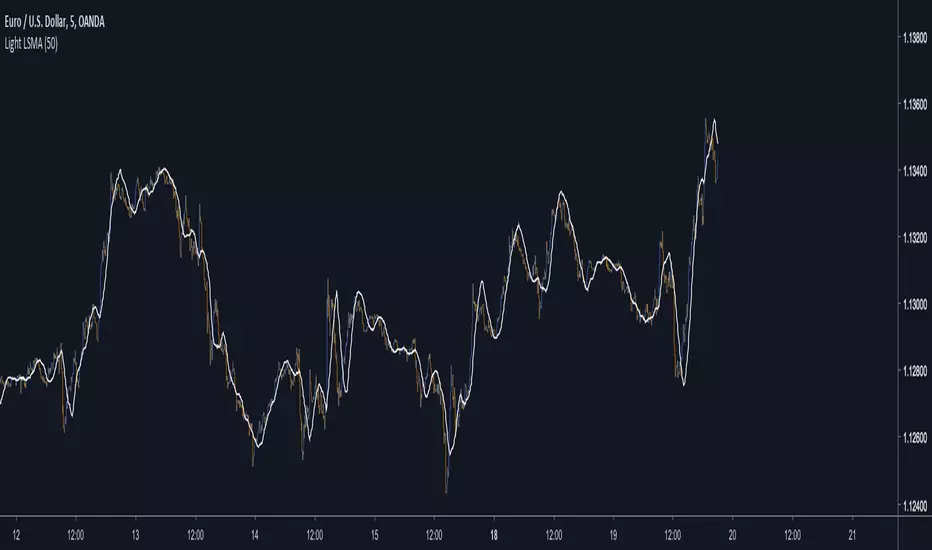
Light LSMAEstimating the LSMA Without Classics Parameters
I already mentioned various methods in order to estimate the LSMA in the idea i published. The parameter who still appeared on both the previous estimation and the classic LSMA was the sample correlation coefficient. This indicator will use an estimate of the correlation coefficient using the standard score thus providing a totally different approach in the estimation of the LSMA. My motivation for such indicator was to provide a different way to estimate a LSMA.
Standardization
The standard score is a statistical tool used to measure at how many standard deviations o a data point is bellow or above its mean. It can also be used to rescale variables, this conversion process is called standardizing or normalizing and it will be the basis of our estimation.
Calculation : (x - x̄)/o where x̄ is the moving average of x and o the standard deviation.
Estimating the Correlation Coefficient
We will use standardization to estimate the correlation coefficient r . 1 > r > -1 so in (y - x̄)/o we want to find y such that y is always above or below 1 standard deviation of x̄ , i had for first idea to pass the price through a band-stop filter but i found it was better to just use a moving average of period/2 .
Estimating the LSMA
We finally rescale a line through the price like mentioned in my previous idea, for that we standardize a line and we multiply the result by our correlation estimation, next we multiply the previous calculation by the price standard deviation, then we sum this calculation to the price moving average.
Comparison of our estimate in white with a LSMA in red with both period 50 :
Working With Different Independents Variables
Here the independent variable is a line n (which represent the number of data point and thus create a straight line) but a classic LSMA can work with other independent variables, for exemple if a LSMA use the volume as independent variable we need to change our correlation estimate with (ȳ - x̄)/ô where ȳ is the moving average of period length/2 of y, y is equal to : change(close,length)*change(volume,length) , x̄ is the moving average of y of period length , and ô is the standard deviation of y. This is quite rudimentary and if our goal is to provide a easier way to calculate correlation then the product-moment correlation coefficient would be more adapted (but less reactive than the sample correlation) .
Conclusion
I showed a way to estimate the correlation coefficient, of course some tweaking could provide a better estimate but i find the result still quite close to the LSMA.
Synergy StatsSynergy Stats
This indicator is intended to complement the Synergy indicator. It provides the following statistics:
A percentage showing how often the two assets move in the opposite direction over a given lookback period.
Similarly, another percentage showing how often the two assets move in the same direction over the same lookback period.
Count the number of times (occurrences) when the two assets move in the same direction for more than 4 bars.
Count the number of times the alternative asset moves more than x%
Count the number of times that chart asset moved in the same direction of the alternative asset when the alternative asset moved more than x%
Both indicators were developed for use in an investigation/tutorial using Pine Script to analyse Gold and US Dollar Index correlation.
The full free post can be found here: backtest-rookies.com

SynergySynergy
This indicator was developed for use in an investigation/tutorial using Pine Script to analyse Gold and US Dollar Index correlation.
The first indicator shall measure the percentage change between the open and close of each bar and compare it to the same percentage change of an alternative asset. Additionally, we shall color the background when the two assets move in the same direction. This should allow us to more easily see when the two assets move together and spot trends in their moment.
The yellow bars show use the percentage change in the price of gold. The blue bars show the percentage change in the price of the US Dollar index. If the bar is above zero, it means that the asset closed up. Conversely, if it is below zero, it means the asset closed down. Finally, the grey bars show bars in which the two assets closed in the same direction.
It can be used in conjunction with a second indicator (to be published soon) that provides statistics generated from this indicator.
The full free post can be found here: backtest-rookies.com

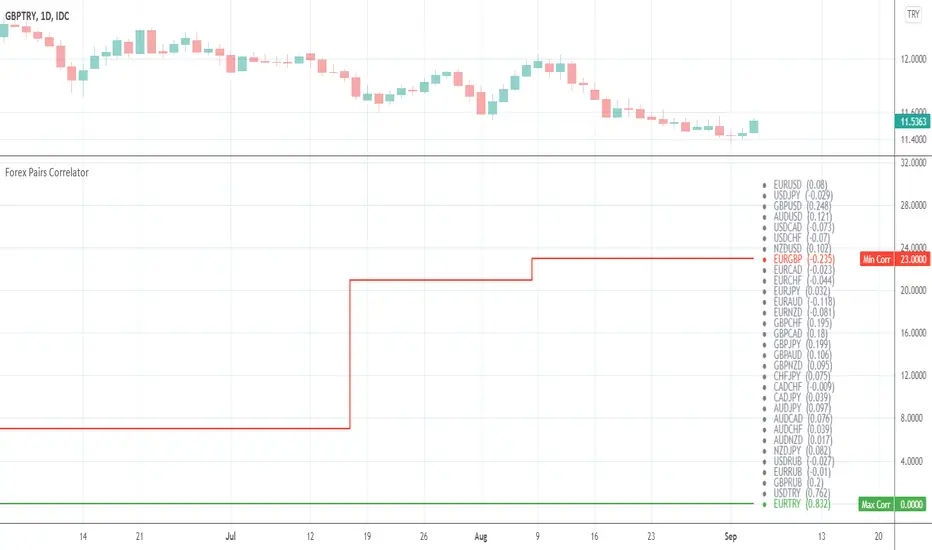
Forex Pairs CorrelatorHi everyone!
This tool helps to identify the best positive and negative correlated pairs from 38 well-known Forex pairs.
By default it will find the best correlations for your current ticker.
If you are a newbie in Correlation Analysis you can find a brief explanation here .
Settings
Lookback for correlations (default: 14 )
Option to use or not to use current ticker (default: true )
Custom ticker (default: EURUSD )
Choose as many pairs as you want from 38 available pairs.
Available pairs
USDCAD
USDMXN
USDBRL
USDCHF
USDRUB
USDTRY
USDZAR
USDJPY
USDCNY
CADCHF
CADJPY
CHFJPY
EURUSD
EURCAD
EURGBP
EURCHF
EURRUB
EURTRY
EURJPY
EURCNY
EURAUD
EURNZD
GBPUSD
GBPCAD
GBPCHF
GBPRUB
GBPJPY
GBPCNY
GBPAUD
GBPNZD
AUDUSD
AUDCAD
AUDCHF
AUDJPY
AUDCNY
AUDNZD
NZDUSD
NZDJPY
Cheers!
Crypto USD Pairs CorrelatorHey there!
This tool helps to identify the best positive and negative correlated pairs from 38 crypto */USD pairs.
By default it will find the best correlations for your current ticker.
If you are a newbie in Correlation Analysis you can find a brief explanation here .
Settings
Lookback for correlations (default: 14 )
Option to use or not to use current ticker (default: true )
Custom ticker (default: BTCUSD )
Choose as many pairs as you want from 38 available pairs.
Available pairs
ADAUSD
BATUSD
BCDUSD
BCHUSD
BCNUSD
BNBUSD
BTCUSD
BTGUSD
BTSUSD
DASHUSD
DCRUSD
DGBUSD
DOGEUSD
EOSUSD
ETCUSD
ETHUSD
ICXUSD
IOTAUSD
LSKUSD
LTCUSD
MKRUSD
NANOUSD
NEOUSD
OMGUSD
ONTUSD
PAXUSD
QTMUSD
TRXUSD
VETUSD
WAVESUSD
XEMUSD
XLMUSD
XMRUSD
XRPUSD
XTZUSD
ZECUSD
ZILUSD
ZRXUSD
Good luck!

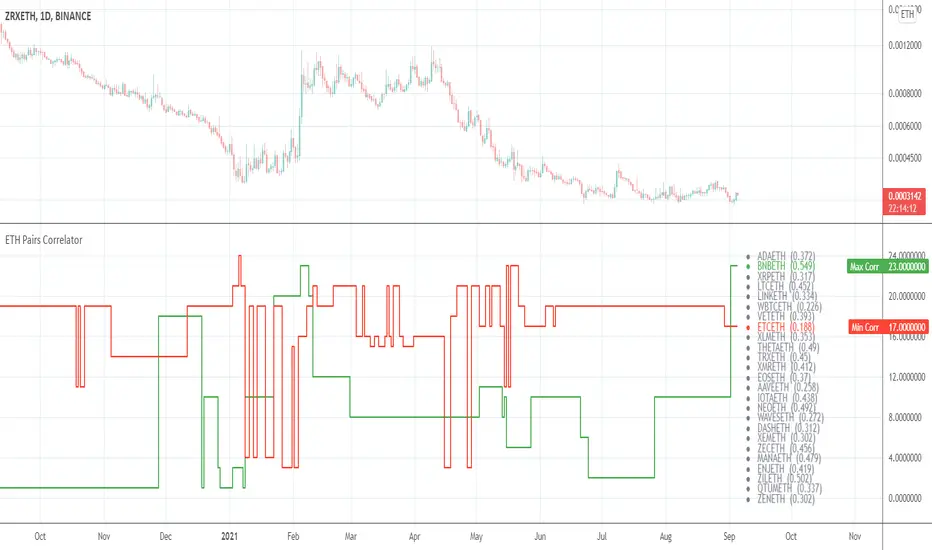
ETH Pairs CorrelatorHey there!
This tool helps to identify the best positive and negative correlated pairs from 38 */ETH cryptocurrency pairs.
By default it will find the best correlations for your current ticker.
If you are a newbie in Correlation Analysis you can find a brief explanation here .
Settings
Lookback for correlations (default: 14 )
Option to use or not to use current ticker (default: true )
Custom ticker (default: BTCUSDT )
Choose as many pairs as you want from 38 available pairs.
Available pairs
ADAETH
BATETH
BCDETH
BCHETH
BNBETH
BSVETH
BTGETH
DASHETH
DGBETH
EOSETH
ETCETH
HOTETH
ICXETH
IOTAETH
LSKETH
LTCETH
MKRETH
NANOETH
NEOETH
NPXSETH
OMGETH
ONTETH
QKCETH
QTMETH
REPETH
TRXETH
TUSDETH
VETETH
WAVESETH
XEMETH
XLMETH
XMRETH
XRPETH
XTZETH
XVGETH
ZECETH
ZILETH
ZRXETH
Good luck!
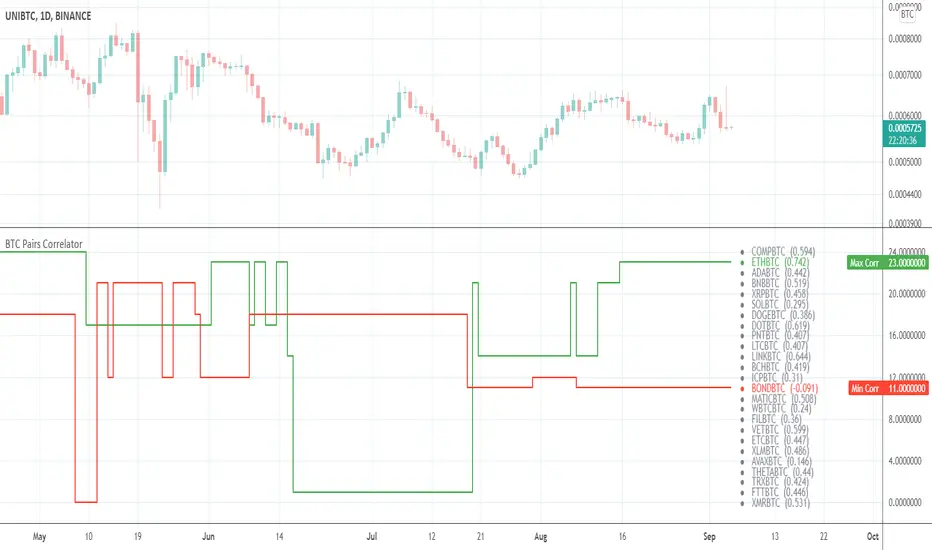
BTC Pairs CorrelatorHey there!
This tool helps to identify the best positive and negative correlated pairs from 38 */BTC cryptocurrency pairs.
By default it will find the best correlations for your current ticker.
If you are a newbie in Correlation Analysis you can find a brief explanation here .
Settings
Lookback for correlations (default: 14 )
Option to use or not to use current ticker (default: true )
You can switch to a custom ticker (default: BTCUSDT )
Choose as many pairs as you want from 38 available pairs.
Available pairs
ADABTC
BATBTC
BCDBTC
BCHBTC
BCNBTC
BNBBTC
BSVBTC
BTGBTC
DASHBTC
DCRBTC
DGBBTC
DOGEBTC
EOSBTC
ETCBTC
ETHBTC
LSKBTC
LTCBTC
IOTABTC
MKRBTC
NANOBTC
NEOBTC
OMGBTC
ONTBTC
PAXBTC
QTMBTC
TRXBTC
TUSDBTC
USDCBTC
VETBTC
WAVESBTC
XEMBTC
XLMBTC
XMRBTC
XRPBTC
XTZBTC
ZECBTC
ZILBTC
ZRXBTC
Good luck!
Stock Market Indices Correlations HeatmapHello friends,
I'm excited to share one of my insightful tools. This indicator visualizes how major global stock indices move relative to your selected instrument, helping you instantly spot market-wide strength, weakness, or divergence.
🛠 How It Works
The indicator calculates Pearson correlation coefficients between your selected symbol and 28 major stock indices , including S&P 500, NASDAQ, DAX, NIKKEI, and many more. Each color is selected according to the correlation value:
Green hues show positive correlations (instruments moving together).
Red hues show negative correlations (instruments moving in opposite directions).
Lighter or transparent colors indicate weak or no correlation.
You can customize the correlation lookback period (default 14 bars ), select your preferred data source (close, open, etc.), and choose from multiple professional color palettes to best match your charting style.
🔥 Key Features
Comprehensive Global Coverage — Correlations across 28 major indices from North America, Europe, and Asia.
Multiple Palettes — Choose from 8 professional color palettes (Blue/Red, Spectral, Viridis, etc.) for better visual clarity.
Adjustable Lookback — Set correlation calculation period from 1 to any number of bars.
Dynamic Data Requests — Real-time updates for all tracked indices using TradingView's request.security.
Smart Alerts — Receive alerts when all indices align positively or negatively — a sign of broad market sentiment extremes.
Performance Optimized — Efficient data handling ensures smooth operation even with multiple requests per bar.
Enhanced UI — Streamlined settings panel for fast palette and source adjustments.
Non-Repainting — Uses only historical data, ensuring stable readings.
If you'd like access or have any questions, feel free to reach out to me directly via DM.
👋 Good luck and happy trading!
Ücretli komut dosyası

Partial CorrelationComputes the partial correlation between 2 symbols while removing the influence of a third.
Ex.:
Computes the correlation between AAPL and AMZN while removing the influence of SPX.
