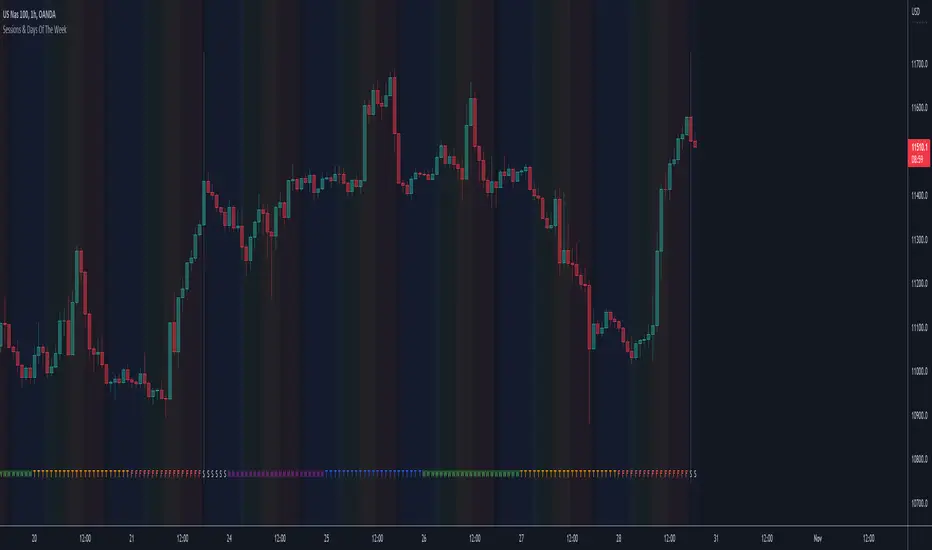
Sessions & Days Of The WeekTraders tend to focus their energy on specific sessions or time periods. This indicator will plot the days of the week, and also highlight the following sessions: Frankfurt (2:00am - 11:00am EST), London (3:00am - 12:00pm EST), New York (8:00am - 5:00pm EST), Sydney (5:00pm - 2:00am EST), Tokyo (7:00pm - 4:00am EST).
It’s important to be aware that Session Open and Close times will vary based on the time of year, as countries shift over to daylight savings time.
Close
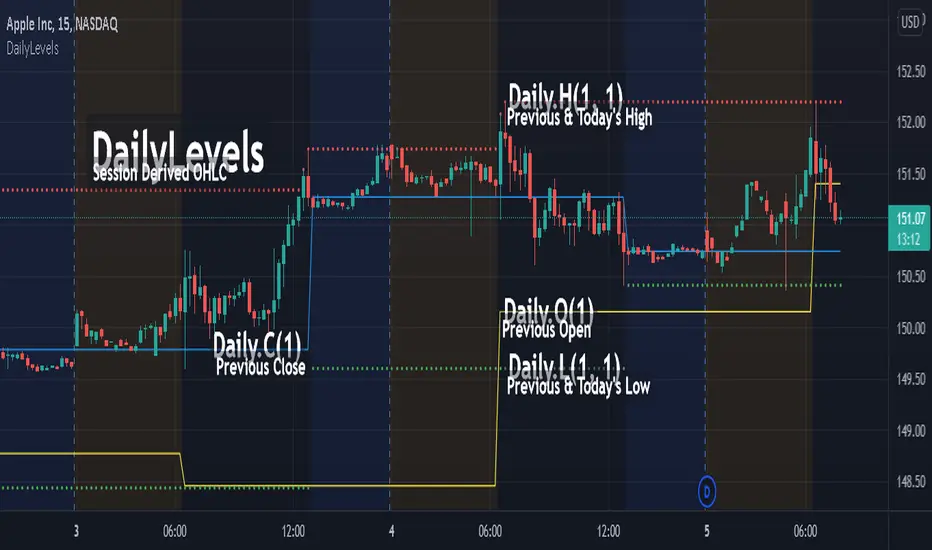
DailyLevelsLibrary "DailyLevels"
Functions for acquiring daily timeframe data by number of prior days.
openD(daysPrior, spec, res) Gets the open for the number of days prior.
Parameters:
daysPrior : Number of days back to get the open from.
spec : session.regular (default), session.extended or other time spec.
res : The resolution (default = '1440').
Returns: The open for the number of days prior.
highD(daysPrior, extraForward, spec, res) Gets the highest value for the number of days prior.
Parameters:
daysPrior : Number of days back to get the high from.
extraForward : Number of extra days forward to include.
spec : session.regular (default), session.extended or other time spec.
res : The resolution (default = '1440').
Returns: The high for the number of days prior.
lowD(daysPrior, extraForward, spec, res) Gets the lowest value for the number of days prior.
Parameters:
daysPrior : Number of days back to get the low from.
extraForward : Number of extra days forward to include.
spec : session.regular (default), session.extended or other time spec.
res : The resolution (default = '1440').
Returns: The low for the number of days prior.
closeD(daysPrior, spec, res) Gets the close for the number of days prior.
Parameters:
daysPrior : Number of days back to get the open from. 0 produces the current close
spec : session.regular (default), session.extended or other time spec.
res : The resolution (default = '1440').
Returns: The close for the number of days prior.
hlc3D(daysPrior, extraForward, spec, res) Gets the HLC3 value for the number of days prior.
Parameters:
daysPrior : Number of days back to get the HLC3 from.
extraForward : Number of extra days forward to include. Determines the closing value.
spec : session.regular (default), session.extended or other time spec.
res : The resolution (default = '1440').
Returns: The HLC3 for the number of days prior.
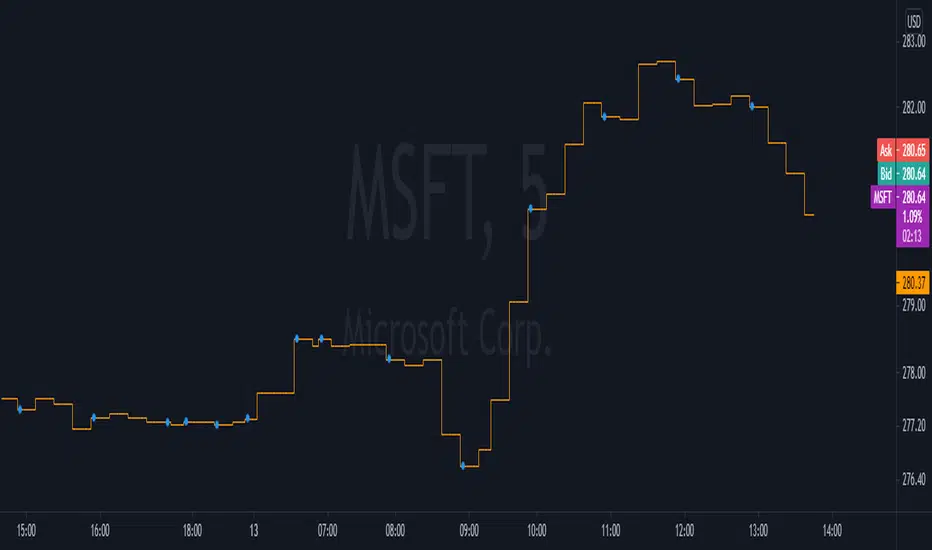
Lowest Close indicatorPlots the lowest close in last 40 bars. On a daily chart , that's about 8 weeks.

Market Sessions Open/Close LevelsThis indicator displays the market open and close price levels for the main trading sessions (Sydney, Tokyo, Frankfurt, London and New York). The Daily Line changes color depending on if price is trading above or below the level. Feel free to add or replace levels depending on your trading style and trading times.

OHLC - H.D.W.MThis indicatos plots Open and Close of the Curernt and Previous Day, Week or Month. It also shows the Highs and Lows of the Hourly, Daily, Weekly and Monthly Timeframes.

Daily lines (UTC)This is a simple script to add highlighted lines on the daily open.
It uses UTC as timezone.

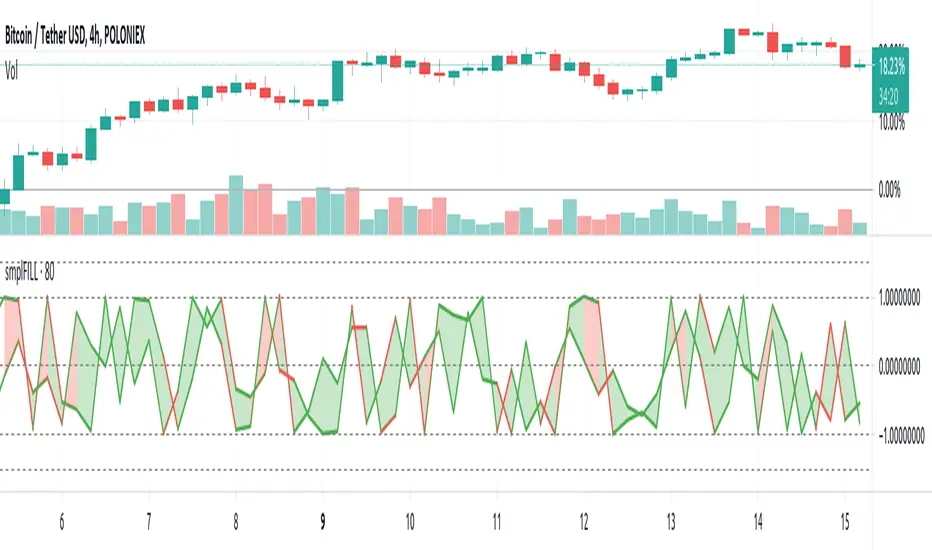
FILL - SimpleFill might flip you a lot of signals close on transitions involving high volatility having wide price swings within settings sensitive intervals. In other words, the script redraws like crazy, so alerts set to 'once per bar' are reset on redraw to view the bar as just having started again.
So, if you do webhook with this, you might find it the easier way to deal with the behaviour; using a personal alert-handling API and programmatic access to an Exchange trading account, filtering and checking that alerts are treated on volatility, volume and velocity, missing ingredients in this particular implementation.
The script is about 20 lines long with declarations and horizontal line decorations included in that number.
Alerts may not work as expected.
Enjoy.
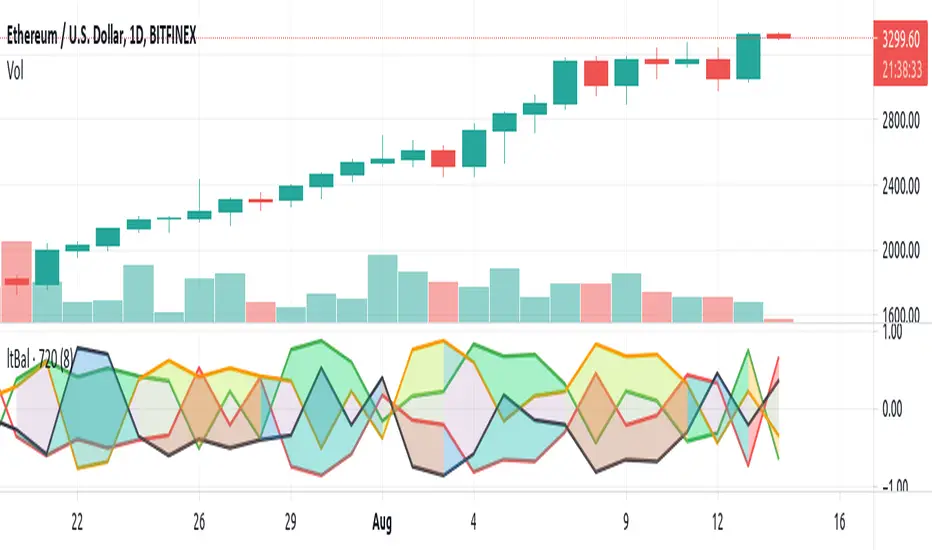
Light BalanceThe script is simple, going for a color scheme logic which tenderly avoids rigorous signals processing.
For the script to remain simple, logical derivatives are also out; as such, there are no secondary relations built off of primary ones. And it also ignores (unless you do this yourself) the logic in a varying order of lines.
Coloring has been done according to a limited set of relations between the four (4) plotted lines.
Quite a bit of information is capture, as you'll see when looking at line order, crossings, and transparency transitions and their patterns.
The approach makes the relations ones which can be learned over time; you become the algorithm to sort out signals. Ha ha. I know that sounds like a cop out doesn't it. Did I mention it's a simple script?
One thing you might want to play with right away are fills having red and green, and lime and fuchsia. It would be cool to reduce it all down to two (2) colors, but all the boolean relations might have to be listed, and it also may not be possible to cumulatively combine transparency overlays of the same value. Visually, that approach may not result to awaken a useful feature anyway. Also, fill() has its limitations in that it cannot be in a local scope; this includes function wrapped calls to fill(), or calls made using branching logic statements if/elseif, iff(), and var = (cond) ? t_val/exp : f_val/exp. So, to my knowledge, a fill() can not be made to be logically on/off.
Please, enjoy getting some use out of it.
Supertrend with Percent Difference from CloseThis script improves the Supertrend indicator by displaying a label that shows the percent difference between the latest closing price & the Supertrend.
This comes in handy when one is using the Supertrend value as a stoploss level. For instance, one would like to have a maximum stop loss level of 8%. Instead of calculating how much percent the price is away from the Supertrend, one can look at the percent label & make an informed decision as to whether initiating a position would have favourable risk/reward or not.
Another utility would be selling into strength when one is using the Supertrend as a trailing stop loss. For instance, if the price is a certain percentage far away from the Supertrend, one may conclude that the price is now extended & either price correction or time correction would ensue, & decide to sell into strength.

15-60min closuresthis script charts two different informations :
15min close as a step line
60min close as dots that are overlayed on the stepline
this is most useful on timeframes that are less than or equal 15 min
RexDog Hour Close LinesThe RexDog Hour Close Lines plots the last 4 previous hour (60 minute) closes. Extremely helpful indicator for traders who trade on lower timeframes below the 60.
The plotted lines are also offset to represent that hours close location on the chart-- but keep the below in mind.
The offset is set for a default resolution of 5 minutes. In that chart timeframe, the offset is correct as to the close location. Changing the timeframe to 3m for instance the offset is not accurate to that particular bar. I am sure there is a simple way to do this but maybe I'm just not smart enough to figure it out. Either way, the offset in any timeframe is easy to distinguish the oldest hour close to the newest.
This indicator has the following options:
You can enable or disable any previous 4 hour close line
You can change all line sizes
You can change all line colors. I do apologize if it's inconvenient that I've defaulted the lines to different colors.
I've limited the visibility to only periods below 60 minutes-- but and maybe there is a better way to do this (if so please share). The limit is based on the most common periods below 60: 1, 2, 3, 5, 10, 12, 15, and 30.
Will most likely release the 240 and 30-minute version of this I have on a few charts.

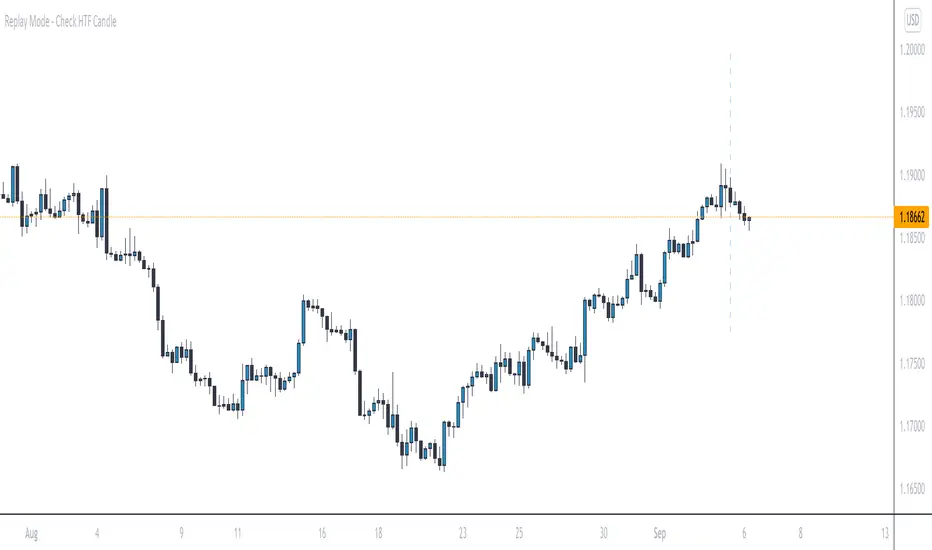
Replay Mode - Check HTF CandleThis indicator is intended to be used while using Replay Mode.
A vertical line will be drawn when you can safely check the 4H, Daily, or Weekly candle without seeing future price.
It is similar to the built-in Session Breaks, but has the benefit of not needing to remove one candle before checking the Daily.
When the line is the color of your 4H settings, it is safe to check the 4H candle.
When the line is the color of your Daily settings, it is safe to check the 4H and Daily candles.
When the line is the color of your Weekly settings, it is safe to check the 4H, Daily and Weekly candles
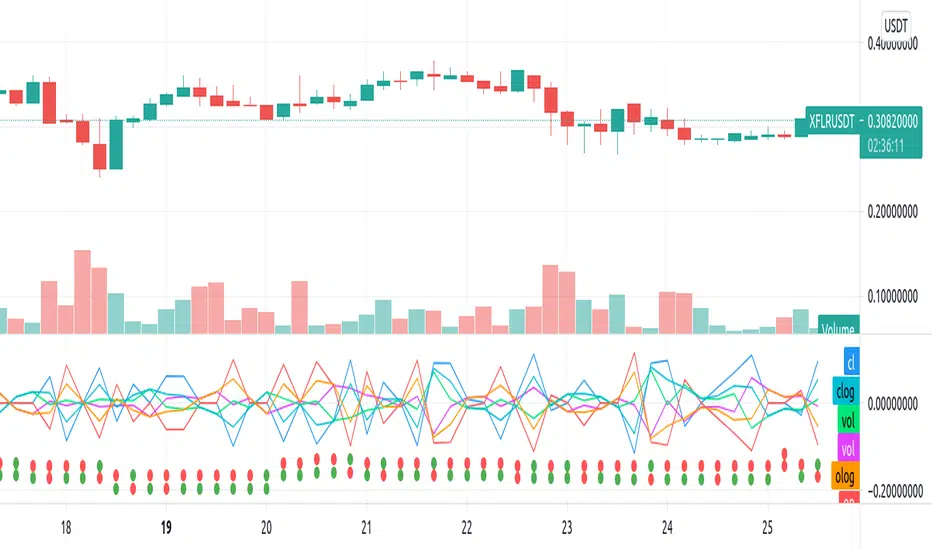
Repulsion: Price & Volume 1Repulsion: Price & Volume 1
www.quantamagazine.org
Proof of concept using the above link and comparisons of price and volume, and one of a series stemming from the so-called Repulsion Engine, now also open sourced, and other indicators from the workbench.
Traffic lights are not accurate.
Like it if you use it, drop a line if you update it -- or if you have comments about how to improve it.
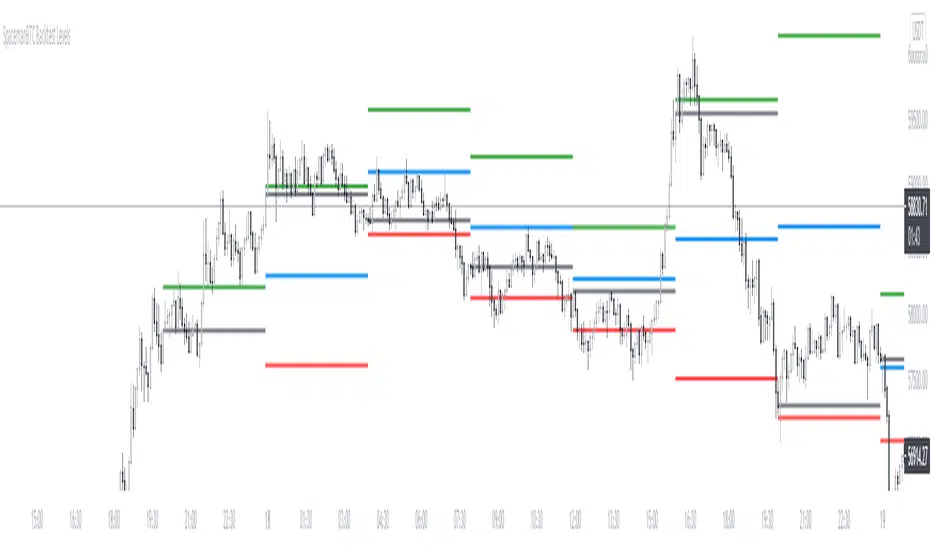
Key Levels CustomTF + Backtest: SpacemanBTCKey Levels Backtest, same logic as the key levels script, provide levels based:
High, Low, Mid and Close.
This was requested, took a long time to post as I fell sick and was given a lot of Dev Work.
Hope this helps those who use it, very useful to see liquidity grabs in my opinion.
Input time in minutes!
Result of a user request.
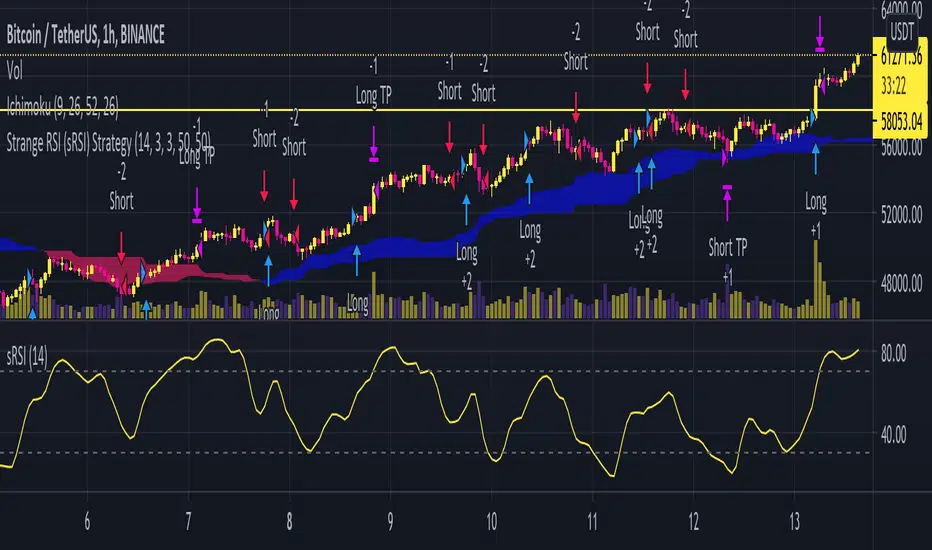
Strange RSIThis indicator is a fork of some development I've been doing with the core code from Empirical Moments. In short, the Strange RSI calculates the RSI of an indicator which compares high with low prices to detect anomalous price fluctuations. The RSI Length can be changed to optimize your strategy. See Strange RSI Backtesting strategy script.
Open Close Cross Strategy plus ExplorerOpen Close Cross Strategy plus Explorer
V 1.0
There is a code that can control sensitivity. try to change 'ATR Multiplier' menu
There is a code for prevent 'repaint'. If you want it check 'Forces Non-Repainting' menu
thanks to
PMax Explorer STRATEGY & SCREENER KivancOzbilgic
Open Close Cross Strategy R5 revised by JustUncleL JustUncleL

NSDT Daily Key LevelsSimple script to show key levels of current day and previous day. Labels can be turned on and off as needed. Line colors, thickness and style can be changed. Modified the "M/W/D Level" script from paaax. Credit for original code goes to him. Link to script and profile posted in code of this script.

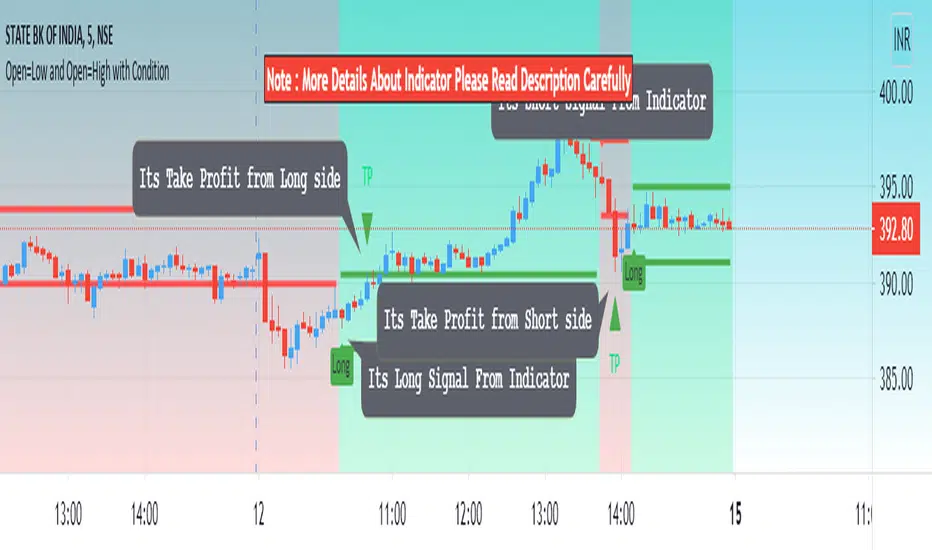
Open=Low and Open=High with ConditionHello Everyone Its indicator Base On Candle (Bar)
How to work its indicator?
➤ if Open = low and pervious bar close > open when Long signal and if Open = High and pervious bar close < open When Short
Indicator Feature
➤ Long Signal with Alert
➤ Short Signal with Alert
➤ Take Profit with Alerts calculated by Long or Short Bar Open You can also choose Percentage or Point by default percent
➤ Trailing Stop Loss with Alerts
Important: This Indicator we are using for Automation Trading if You Want This Indicator Access, Please Contact me PM on Tradingview
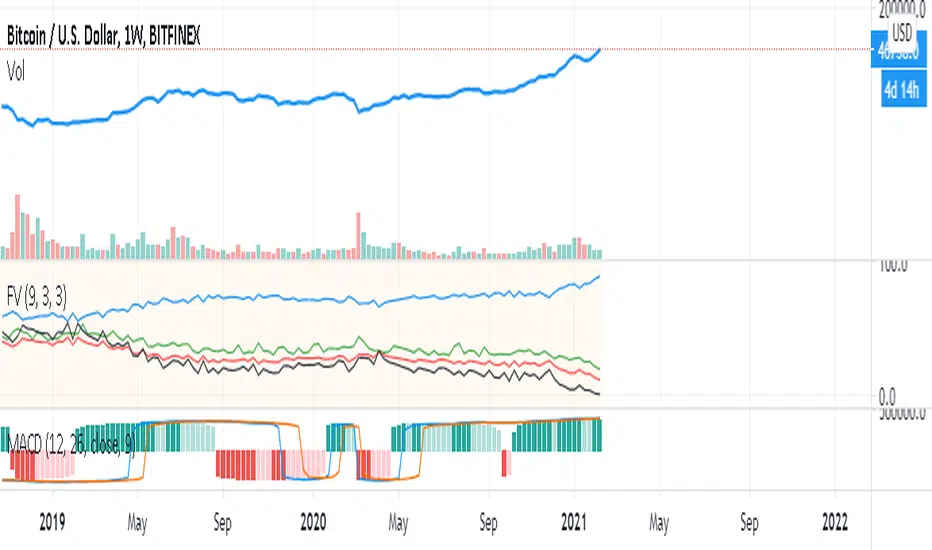
VFFVFluctuations to Volume desired to change the price.
to identifying which parameter of ask/bid (Technical ) or News (fundamental) parameters are changing the market I think this formula is enough !!!!
thanks for use and share your comments
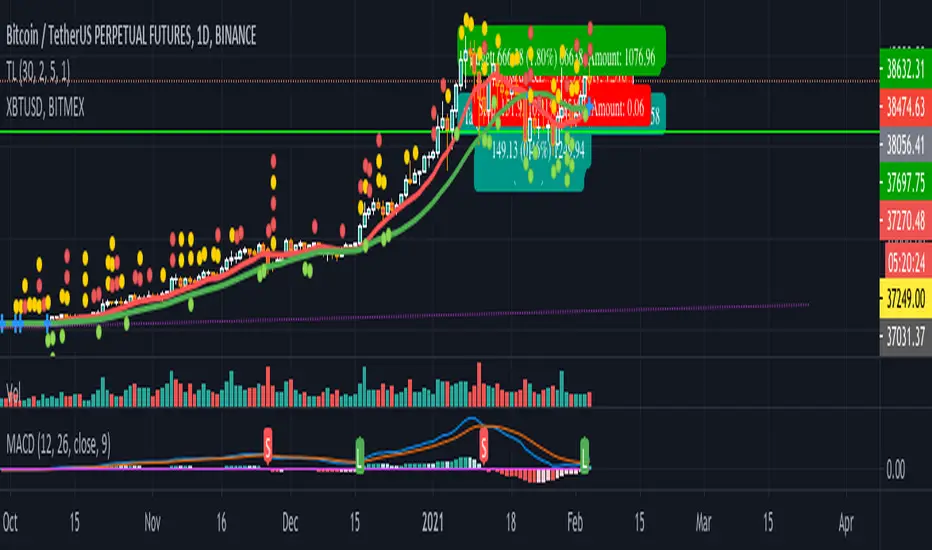
MACD signal with alert (long/short/close) for TV free accountSend MACD alert through email (available for free/pro user):
// 3 - buy
// -2 - short
// 0 - close position
// 1 - ignore
Example buy signal
Alert: STRAT3. BINANCE:BTCUSDTPERP, price = 31080
Example sell signal
Alert: STRAT-2. BINANCE:BTCUSDTPERP, price = 31080
Example close signal
Alert: STRAT0. BINANCE:BTCUSDTPERP, price = 31080
Example ignore signal
Alert: STRAT1. BINANCE:BTCUSDTPERP, price = 31080
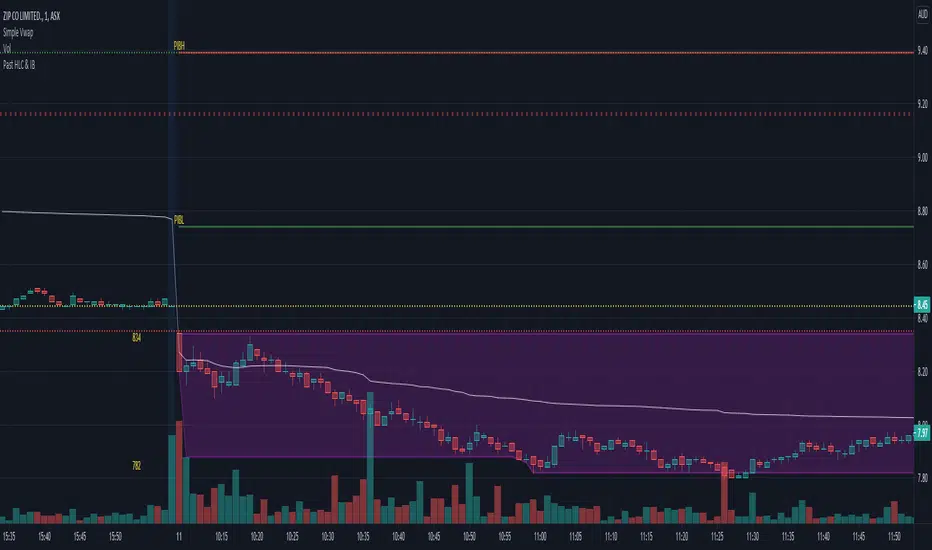
Initial Balance (IB) and Previous Day / Week High, Low & ClosePlots Historical key levels for volume profile idea.
Plots the following:
- Previous Day High
- Previous Day Low
- Previous Day Close
- Previous Day IB High
- Previous Day IB Low
- Current Days IB High
- Current Days IB Low
IB is based on first hour of trading.
Made specifically for ASX stocks, have not tested it on other exchanges or assets.
Key Levels SpacemanBTC IDWMKey levels, plotted automatically
Additional timeframes can be added on request
Useful for seeing strength of the trend in the market

Key Levels TheHuntThis indicator is made to show you some key levels on the chart on the different timeframes. You can hide them or show them in the settings. The levels are the Monthly Weekly and Daily opens, current monthly, weekly and daily high / low, last weeks high / low & last daily high / low as well as Monday high and low. These levels can be used as key pivots or key liquidity areas. You can also adjust the time to also use the correct Mon range for forex pairs.
As you can see on the chart, that is how the levels show up on the chart.
