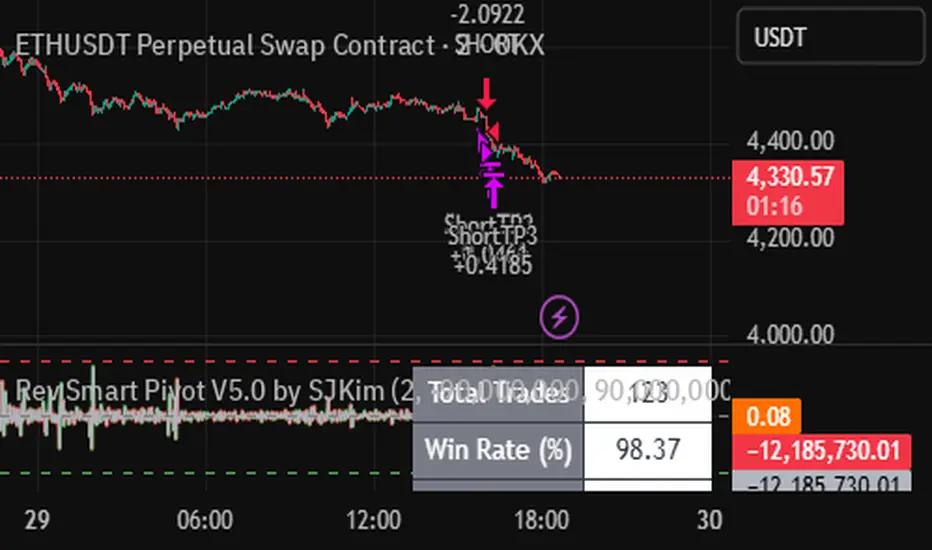
Rev Smart Pivot V5.0 by SJKimRev Smart Pivot V5.0 by SJKim
Rev Smart Pivot V5.0 by SJKim
Rev Smart Pivot V5.0 by SJKim
Grafik Desenleri

𝐍𝐄𝐔𝐑𝐀𝐋 𝐍𝐄𝐓𝐖𝐎𝐑𝐊神经网络交易系统全网都在疯狂寻找的神经网络交易系统
策略通过整合多种技术指标(如EMA、Supertrend、HMA、PSAR、RSI、MACD、WaveTrend、Stochastic、Bollinger Bands、ATR、RVI、OBV、CMF、VWAP、K线形态等),生成综合交易信号。策略采用评分系统,根据各指标的权重累积分数,触发强/弱多头和空头信号,并结合趋势过滤(可选)和止损机制进行交易管理。
The neural network trading system that the entire network is frantically searching for
The strategy integrates multiple technical indicators (such as EMA、Supertrend、HMA、PSAR、RSI、MACD、WaveTrend、Stochastic、Bollinger Bands、ATR、RVI、OBV、CMF、VWAP、K Generate comprehensive trading signals based on line shapes, etc. The strategy adopts a scoring system, accumulates scores based on the weights of each indicator, triggers strong/weak long and short signals, and combines trend filtering (optional) and stop loss mechanism for trading management.

J12Matic Builder by galgoomA flexible Renko/tick strategy that lets you choose between two entry engines (Multi-Source 3-way or QBand+Moneyball), with a unified trailing/TP exit engine, NY-time trading windows with auto-flatten, daily profit/loss and trade-count limits (HALT mode), and clean webhook routing using {{strategy.order.alert_message}}.
Highlights
Two entry engines
Multi-Source (3): up to three long/short sources with Single / Dual / Triple logic and optional lookback.
QBand + Moneyball: Gate → Trigger workflow with timing windows, OR/AND trigger modes, per-window caps, optional same-bar fire.
Unified exit engine: Trailing by Bricks or Ticks, plus optional static TP/SL.
Session control (NY time): Evening / Overnight / NY Session windows; auto-flatten at end of any enabled window.
Day controls: Profit/Loss (USD) and Trade-count limits. When hit, strategy HALTS new entries, shows an on-chart label/background.
Alert routing designed for webhooks: Every order sets alert_message= so you can run alerts with:
Condition: this strategy
Notify on: Order fills only
Message: {{strategy.order.alert_message}}
Default JSONs or Custom payloads: If a Custom field is blank, a sensible default JSON is sent. Fill a field to override.
How to set up alerts (the 15-second version)
Create a TradingView alert with this strategy as Condition.
Notify on: Order fills only.
Message: {{strategy.order.alert_message}} (exactly).
If you want your own payloads, paste them into Inputs → 08) Custom Alert Payloads.
Leave blank → the strategy sends a default JSON.
Fill in → your text is sent as-is.
Note: Anything you type into the alert dialog’s Message box is ignored except the {{strategy.order.alert_message}} token, which forwards the payload supplied by the strategy at order time.
Publishing notes / best practices
Renko users: Make sure “Renko Brick Size” in Inputs matches your chart’s brick size exactly.
Ticks vs Bricks: Exit distances switch instantly when you toggle Exit Units.
Same-bar flips: If enabled, a new opposite signal will first close the open trade (with its exit payload), then enter the new side.
HALT mode: When day profit/loss limit or trade-count limit triggers, new entries are blocked for the rest of the session day. You’ll see a label and a soft background tint.
Session end flatten: Auto-closes positions at window ends; these exits use the “End of Session Window Exit” payload.
Bar magnifier: Strategy is configured for on-close execution; you can enable Bar Magnifier in Properties if needed.
Default JSONs (used when a Custom field is empty)
Open: {"event":"open","side":"long|short","symbol":""}
Close: {"event":"close","side":"long|short|flat","reason":"tp|sl|flip|session|limit_profit|limit_loss","symbol":""}
You can paste any text/JSON into the Custom fields; it will be forwarded as-is when that event occurs.
Input sections — user guide
01) Entries & Signals
Entry Logic: Choose Multi-Source (3) or QBand + Moneyball (pick one).
Enable Long/Short Signals: Master on/off switches for entering long/short.
Flip on opposite signal: If enabled, a new opposite signal will close the current position first, then open the other side.
Signal Logic (Multi-Source):
Single: any 1 of the 3 sources > 0
Dual: Source1 AND Source2 > 0
Triple (default): 1 AND 2 AND 3 > 0
Long/Short Signal Sources 1–3: Provide up to three series (often indicators). A positive value (> 0) is treated as a “pulse”.
Use Lookback: Keeps a source “true” for N bars after it pulses (helps catch late triggers).
Long/Short Lookback (bars): How many bars to remember that pulse.
01b) QBands + Moneyball (Gate -> Trigger)
Allow same-bar Gate->Trigger: If ON, a trigger can fire on the same bar as the gate pulse.
Trigger must fire within N bars after Gate: Size of the gate window (in bars).
Max signals per window (0 = unlimited): Cap the number of entries allowed while a gate window is open.
Buy/Sell Source 1 – Gate: Gate pulse sources that open the buy/sell window (often a regime/zone, e.g., QBands bull/bear).
Trigger Pulse Mode (Buy/Sell): How to detect a trigger pulse from the trigger sources (Change / Appear / Rise>0 / Fall<0).
Trigger A/B sources + Extend Bars: Primary/secondary triggers plus optional extension to persist their pulse for N bars.
Trigger Mode: Pick S2 only, S3 only, S2 OR S3, or S2 AND S3. AND mode remembers both pulses inside the window before firing.
02) Exit Units (Trailing/TP)
Exit Units: Choose Bricks (Renko) or Ticks. All distances below switch accordingly.
03) Tick-based Trailing / Stops (active when Exit Units = Ticks)
Initial SL (ticks): Starting stop distance from entry.
Start Trailing After (ticks): Start trailing once price moves this far in your favor.
Trailing Distance (ticks): Offset of the trailing stop from peak/trough once trailing begins.
Take Profit (ticks): Optional static TP distance.
Stop Loss (ticks): Optional static SL distance (overrides trailing if enabled).
04) Brick-based Trailing / Stops (active when Exit Units = Bricks)
Renko Brick Size: Must match your chart’s brick size.
Initial SL / Start Trailing After / Trailing Distance (bricks): Same definitions as tick mode, measured in bricks.
Take Profit / Stop Loss (bricks): Optional static distances.
05) TP / SL Switch
Enable Static Take Profit: If ON, closes the trade at the fixed TP distance.
Enable Static Stop Loss (Overrides Trailing): If ON, trailing is disabled and a fixed SL is used.
06) Trading Windows (NY time)
Use Trading Windows: Master toggle for all windows.
Evening / Overnight / NY Session: Define each session in NY time.
Flatten at End of : Auto-close any open position when a window ends (sends the Session Exit payload).
07) Day Controls & Limits
Enable Profit Limits / Profit Limit (Dollars): When daily net PnL ≥ limit → auto-flatten and HALT.
Enable Loss Limits / Loss Limit (Dollars): When daily net PnL ≤ −limit → auto-flatten and HALT.
Enable Trade Count Limits / Number of Trades Allowed: After N entries, HALT new entries (does not auto-flatten).
On-chart HUD: A label and soft background tint appear when HALTED; a compact status table shows Day PnL, trade count, and mode.
08) Custom Alert Payloads (used as strategy.order.alert_message)
Long/Short Entry: Payload sent on entries (if blank, a default open JSON is sent).
Regular Long/Short Exit: Payload sent on closes from SL/TP/flip (if blank, a default close JSON is sent).
End of Session Window Exit: Payload sent when any enabled window ends and positions are flattened.
Profit/Loss/Trade Limit Close: Payload sent when daily profit/loss limit causes auto-flatten.
Tip: Any tokens you include here are forwarded “as is”. If your downstream expects variables, do the substitution on the receiver side.
Known limitations
No bracket orders from Pine: This strategy doesn’t create OCO/attached brackets on the broker; it simulates exits with strategy logic and forwards your payloads for external automation.
alert_message is per order only: Alerts fire on order events. General status pings aren’t sent unless you wire a separate indicator/alert.
Renko specifics: Backtests on synthetic Renko can differ from live execution. Always forward-test on your instrument and settings.
Quick checklist before you publish
✅ Brick size in Inputs matches your Renko chart
✅ Exit Units set to Bricks or Ticks as you intend
✅ Day limits/Windows toggled as you want
✅ Custom payloads filled (or leave blank to use defaults)
✅ Your alert uses Order fills only + {{strategy.order.alert_message}}

fero.Laplace + MA TP/SL Strategy (10m)//@version=5Labne is a good technique for generating logic or theory.

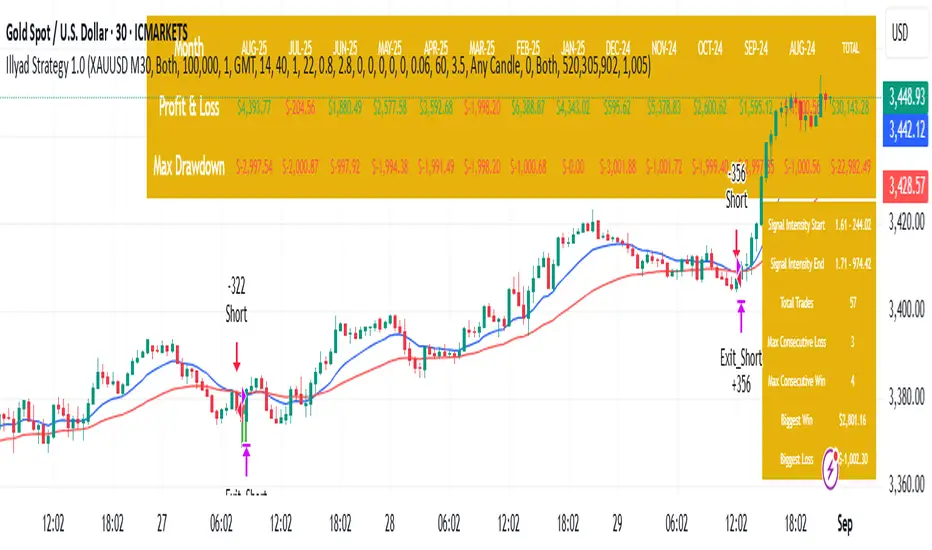
Optimised XAU/USD (Gold, IC Markets, 30m)The Illyad Strategy 1.0 optimised for XAU/USD (Gold) on the 30-minute timeframe (IC Markets feed).
📊 Backtest Results (Jan 2024 – Aug 2025):
✅ Total P&L: +30,143.28 USD (+30.14%)
📉 Max Drawdown: 3.60% (3,945.84 USD)
🔁 Total Trades: 57
📈 Win Rate: 42.11% (24/57 trades)
⚖️ Profit Factor: 1.91
This setup shows steady performance and low drawdown on Gold — ideal for traders wanting to capture volatility while maintaining consistency.
🔧 Optimisation Notes:
Works best on the 30m timeframe.
Each instrument (forex, indices, commodities, stocks) has unique behaviour.
To maximise results, always optimise the parameters per symbol — e.g., Gold requires a different configuration than GBP/USD or NASDAQ.
💡 Best Use Cases:
Prop firm challenges & scaling funded accounts.
Long-term compounding with low risk.
Automated execution via TradingView alerts → MT5 for hands-free trading.
⚠️ Disclaimer:
This strategy is for educational purposes only. Past results do not guarantee future performance. Always backtest and forward-test before going live.
📲 Next Steps:
This example demonstrates the Gold (XAU/USD) optimisation. The Illyad Strategy can be tuned for any forex pair, index, or commodity with proper optimisation.
👉 Visit my profile for full automation solutions.
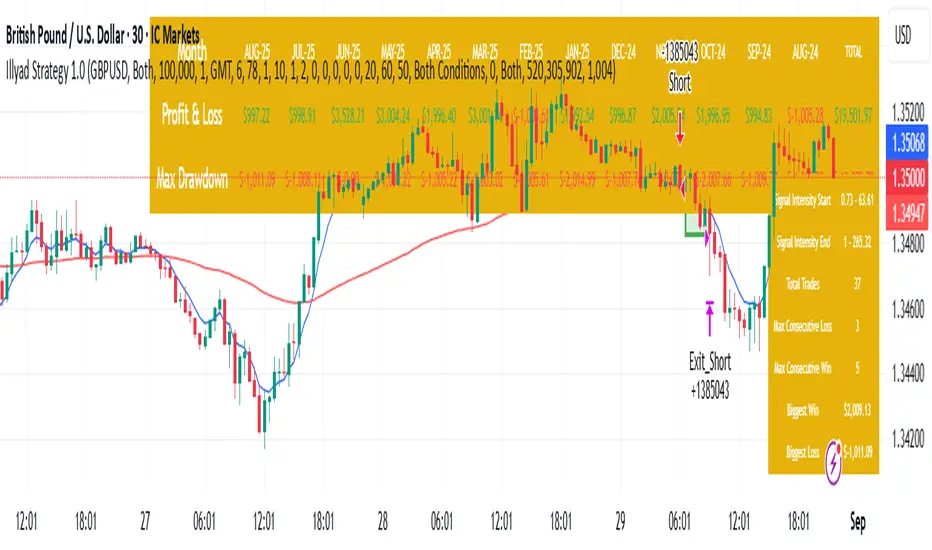
Optimised GBP/USD (IC Markets, 30m)This is the Illyad Strategy 1.0 optimised for GBP/USD on the 30-minute timeframe (IC Markets feed).
📊 Backtest Results (Jan 2024 – Aug 2025):
✅ Total P&L: +19,501.97 USD (+19.50%)
📉 Max Drawdown: 3.57% (3,607.64 USD)
🔁 Total Trades: 37
📈 Win Rate: 51.35% (19/37 trades)
⚖️ Profit Factor: 2.08
This version shows steady profitability with controlled drawdown, making it highly effective for prop firm evaluations and scaling accounts.
🔧 Optimisation Notes:
Works best on the 30-minute timeframe.
Each symbol behaves differently — always optimise the algo per instrument (e.g. GBP/USD vs EUR/GBP vs Gold).
Parameters such as moving averages, risk, and SL/TP ratios can be tuned to maximise performance.
💡 Best Use Cases:
Prop firm challenges (FTMO, AquaFunded, MyForexFunds, etc.).
Scaling funded capital by trading multiple accounts simultaneously.
Full automation via TradingView alerts → MT5 integration.
⚠️ Disclaimer:
This script is for educational purposes only. Past results do not guarantee future performance. Always backtest and forward-test on demo before going live.
📲 Next Steps:
This setup demonstrates the GBP/USD optimisation. The Illyad Strategy can be adjusted to perform across any forex pair, index, or stock with proper optimisation.
👉 Check my profile for full automation solutions.
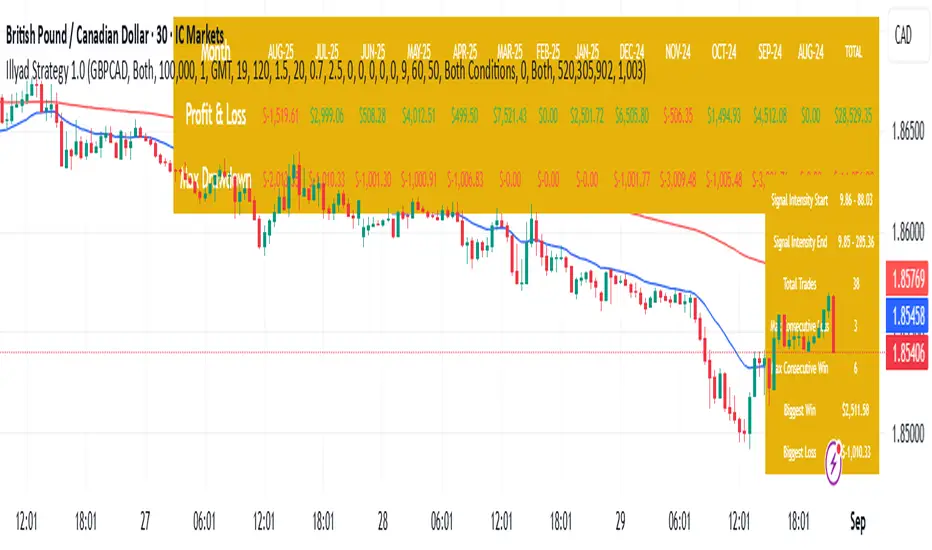
Optimised GBP/CAD (IC Markets, 30m) - Automated TradingHere’s the Illyad Strategy 1.0 optimised for GBP/CAD on the 30-minute timeframe (IC Markets feed).
📊 Backtest Results (Jan 2024 – Aug 2025):
✅ Total P&L: +28,529.35 CAD (+28.53%)
📉 Max Drawdown: 3.61% (3,822.27 CAD)
🔁 Total Trades: 38
📈 Win Rate: 50.00% (19/38 trades)
⚖️ Profit Factor: 2.49
This setup shows strong performance with low drawdown, making it well-suited for prop firm trading and long-term portfolio compounding.
🔧 Optimisation Notes:
Works best on the 30-minute timeframe.
Each symbol has unique volatility and structure. To maximise results, you must optimise the algo per symbol (e.g., GBP/CAD vs EUR/USD vs NASDAQ).
Parameters such as moving averages, signal intensity, and SL/TP levels should be tuned to the instrument.
💡 Best Use Cases:
Prop firm challenges (FTMO, AquaFunded, MyForexFunds alternatives).
Running across multiple accounts simultaneously for compounding.
Automated execution via TradingView alerts → MT5 integration.
⚠️ Disclaimer:
This script is provided for educational purposes only. Past results do not guarantee future performance. Always backtest and forward-test on demo before live trading.
📲 Next Steps:
This version demonstrates the GBP/CAD optimisation. The Illyad Strategy can be tuned to work on any symbol (forex, indices, or stocks).
👉 Visit my profile for full automation solutions (TradingView → MT5)
fero.karma algoUnderstand what stocks, currencies (forex), and cryptocurrencies are. Learn common terms like bull market, bear market, volatility, and liquidity.
Study Analysis: There are two main types of analysis:

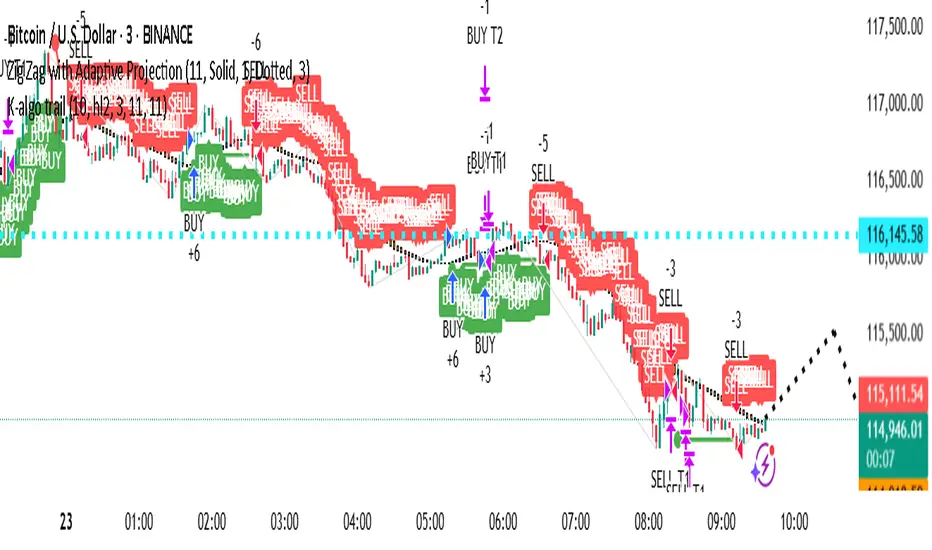
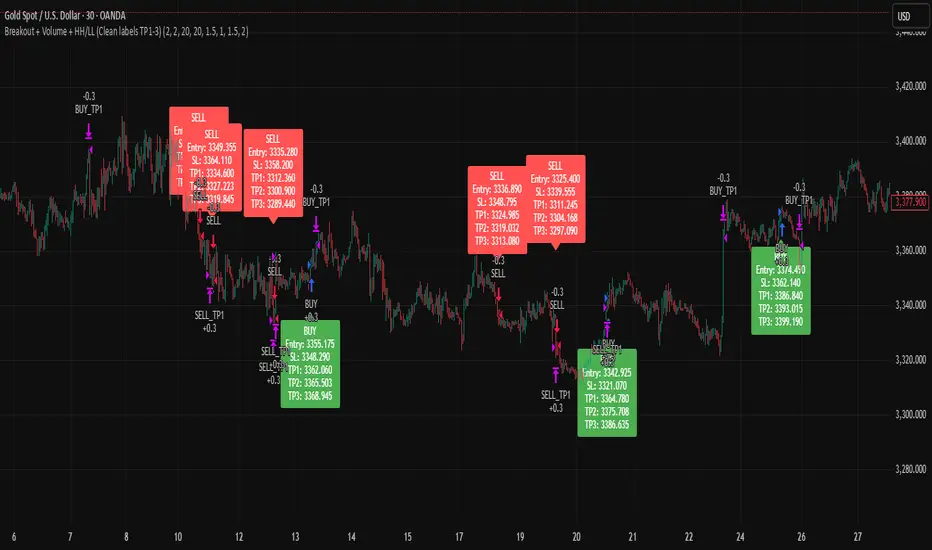
Breakout + Volume + HH/LL (Clean labels TP1-3)Breakout + Volume + HH/LL Strategy (Clean Labels)
This strategy combines breakout confirmation, volume strength, and market structure (Higher Highs / Lower Lows) to identify high-probability trade setups.
Breakout Filter: Uses a Donchian channel to detect price breakouts above resistance or below support.
Volume Confirmation: Requires volume to exceed the moving average of volume by a chosen multiplier, filtering out weak or false breakouts.
Market Structure: Long trades are only allowed if a Higher High (HH) has formed, and short trades only if a Lower Low (LL) has formed.
Trade Execution Rules:
For BUY trades: Entry at breakout, stop loss (SL) below the last pivot low, and three take profits (TP1–TP3) based on configurable risk-reward ratios.
For SELL trades: Entry at breakout, stop loss above the last pivot high, with TP1–TP3 levels set symmetrically below the entry.
Labels on Chart:
Each signal is marked with a clean label showing only:
Trade direction (BUY or SELL)
Entry price
Stop Loss
TP1, TP2, TP3
This makes the chart uncluttered while still providing all key trade information for execution or backtesting.
Std Smart Pivot V5.0 by SJKimStd Smart Pivot V5.0 by SJKim
Std Smart Pivot V5.0 by SJKim
Std Smart Pivot V5.0 by SJKim

Nor Smart Pivot V5.0 by SJKimNor Smart Pivot V5.0 by SJKim.
Nor Smart Pivot V5.0 by SJKim.
Nor Smart Pivot V5.0 by SJKim.

FVG Ultra Assertive - Individual Filters (mtbr)FVG Ultra Assertive - Individual Filters (mtbr)
What this script offers:
This strategy detects and highlights FVGs (Fair Value Gaps) on the chart, providing traders with a visual and systematic approach to identify potential price inefficiencies. The script plots bullish and bearish FVG zones using customizable boxes and labels, allowing users to easily spot high-probability trading areas. In addition, it opens and closes simulated trades based on the detected FVGs, enabling full backtesting and strategy performance evaluation. It integrates multiple independent filters to validate the strength of each FVG signal before entering a trade.
How it works:
The script identifies:
Bullish FVGs when the current low is higher than the high of two bars ago.
Bearish FVGs when the current high is lower than the low of two bars ago.
Once an FVG is detected, it applies three optional independent filters:
GAP/ATR Filter:
Measures the FVG size relative to the Average True Range (ATR). Only gaps exceeding a user-defined multiple of ATR are considered valid.
Support/Resistance (S/R) Filter:
Uses pivot points to check if the FVG overlaps with recent high/low pivot levels within a tolerance percentage. This ensures the gap aligns with meaningful market levels.
Stochastic Filter:
Applies a stochastic oscillator to confirm momentum. Bullish FVGs are validated when stochastic values are oversold, and bearish FVGs when overbought.
After passing the selected filters, the strategy opens trades:
LONG FVG for bullish signals (buy)
SHORT FVG for bearish signals (sell)
The strategy automatically closes positions when an opposite signal appears, generating a backtest report with trades, profits, and statistics. The final bullish or bearish FVG signals are plotted as colored boxes on the chart with labels “BULL FVG” or “BEAR FVG” for immediate visual reference.
How to configure it for use:
Use GAP/ATR Filter: Enable or disable the ATR-based filter and adjust the ATR period (ATR Length) and minimum gap multiplier (Minimum Gap x ATR).
Use S/R Filter: Enable or disable the pivot-based S/R filter. Configure the pivot lookback periods (Pivot Left and Pivot Right) and the tolerance percentage (Gap Tolerance %).
Use Stochastic Filter: Enable or disable stochastic confirmation. Adjust the K and D lengths (Stoch K Length and Stoch D Length) and the overbought/oversold thresholds (Stoch Overbought and Stoch Oversold).
Colors: Customize the colors for bullish and bearish FVGs (FVG Bull and FVG Bear) to match your chart preferences.
Usage Tips:
Apply this strategy to any timeframe; shorter timeframes generate more frequent FVGs, while higher timeframes highlight stronger gaps.
Combine FVG signals with other technical analysis tools for better trade confirmation.
Use the box and label visualization to quickly scan charts for trade opportunities without cluttering the chart.
The strategy’s trades (LONG and SHORT) provide backtesting results and performance statistics for each signal.

Sofi v6gives sell and buy signals for tech stocks. it is amazing how good it works. gice it a try and test it before applying it for live trading.
3-Candle Reversal Pattern-vahid2star3-Candle Reversal Zones + Hammer Confirmation (with Risk Management & Alerts)
This script combines 3-candle reversal detection, hammer confirmations, and smart demand/supply zone plotting into a single tool designed for both discretionary and automated traders.
🔍 Core Logic
3-Candle Reversal Pattern
Candle-1: Strong move in one direction (big body).
Candle-2: Doji-like candle (high shadow/body ratio).
Candle-3: Reversal candle in the opposite direction (large body relative to Candle-2).
A gap after Candle-3 is required for extra confirmation.
Hammer Confirmation (Hammer-1 & Hammer-2)
After a valid 3-candle setup, the script searches for a hammer pattern near the zone.
Hammer-1: Draws a box directly on the hammer range if followed by a strong confirming candle.
Hammer-2: If another hammer forms after the confirmation candle and holds for N bars (configurable), a second hammer box is drawn.
Demand & Supply Zones
For bullish setups, a demand zone is created from the Candle-2 low to the Candle-1 low.
For bearish setups, a supply zone is created from the Candle-2 high to the Candle-1 high.
Zones extend to the right until price interacts with them.
🛠 Filters & Quality Controls
Trend filter (optional):
Only draw zones if price respects higher-timeframe EMA200 slope and LTF EMA alignment.
Market structure filter:
Require higher-high / higher-low (for bullish) or lower-high / lower-low (for bearish).
ATR filter:
Zones must have a minimum height relative to ATR.
Overlap control:
Avoid drawing zones that overlap too heavily with existing ones.
Cooldown:
Restrict consecutive zones of the same type within a user-defined bar distance.
🎯 Risk Management & Strategy
Dynamic position sizing:
Trade size is automatically calculated from account equity, risk %, and leverage.
Stop-loss & Take-profit:
SL placed just beyond the zone ± buffer ticks.
TP automatically set at user-defined Reward:Risk ratio (e.g., 3:1).
Capital protection:
Trades respect max leverage and risk per position settings.
⚡ Alerts
The script provides one-time alerts for each zone:
🔔 First Touch Alert → Triggered when price first touches a demand, supply, or hammer box.
Each zone only fires one alert, avoiding duplicates on re-touch or trade exit.
📊 Visuals
Demand zones: Green boxes.
Supply zones: Red boxes.
Hammer boxes: Blue (bullish) / Orange (bearish).
Used zones: Greyed out after price fills them.
Outcomes: Zones change to green if TP is hit, red if SL is hit.
Optional labels mark “Bullish zone ✓”, “Bearish zone ✓”, “Hammer-1 ✓”, or “Hammer-2 ✓” when confirmed.
🔧 Settings Overview
Core pattern ratios (C1/C2, C3/C2 size multipliers).
Doji definition (shadow/body ratio).
Hammer search depth, confirmation delay, and strictness.
Risk % per trade, leverage cap, stop buffer, RR ratio.
Visual styling (colors, max box count, labels).
Trend, structure, ATR, overlap, and cooldown filters.
Option to disable orders (use as indicator + alerts only).
⚠️ Disclaimer
This script is a technical analysis tool intended for educational purposes.
It does not guarantee profits. Use proper risk management and test thoroughly before applying in live trading.
✨ With its combination of 3-candle reversals, hammer confirmations, and smart filtering, this script is designed to reduce noise, highlight high-probability zones, and give traders both visual structure and actionable alerts.

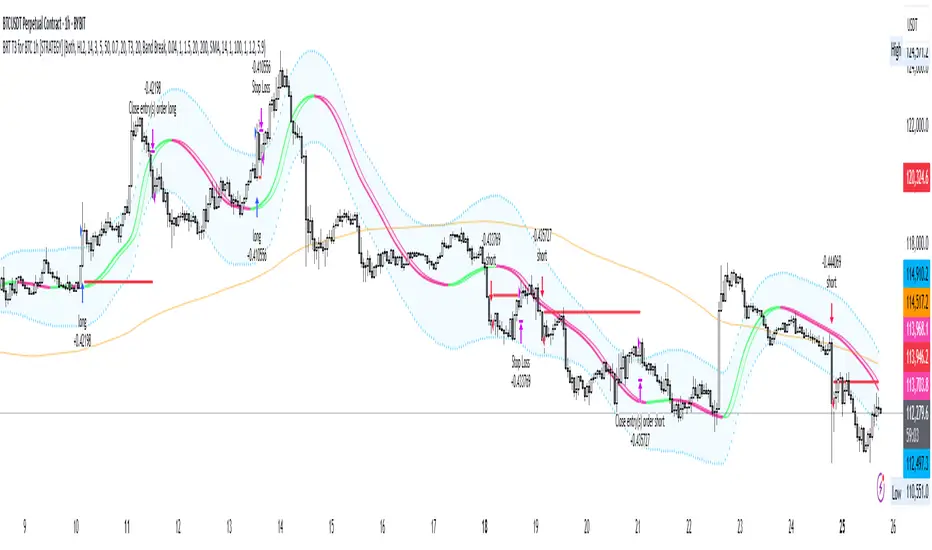
BRT T3 for BTC 1h [STRATEGY]## 📊 BRT T3 Adaptive Strategy for BTC 1H
STRATEGY DESCRIPTION
Professional trading strategy based on the adaptive T3 (Tillson T3) indicator with dynamic length controlled by the Relative Strength Index (RSI) . The strategy is specifically designed for Bitcoin trading on the hourly timeframe and includes a comprehensive filter system to minimize false signals.
═════════════════════════════════════════
🔥 UNIQUE CODE FEATURES
1. RSI-Adaptive Architecture:
• Innovative Approach: Unlike standard MA strategies with fixed periods, our code dynamically adjusts the moving average length based on RSI
• Smart Formula: len = minLen + (maxLen - minLen) * (1 - RSI/100) - automatically accelerates response in extreme zones
• Result: Strategy adapts to market conditions without manual reconfiguration
2. Modified Ichimoku Cloud:
• Unique Calculation: Instead of classic high/low, uses ATR-based method
• Dynamic Levels: Cloud is built based on volatility, not fixed periods
• Advantage: More accurate trend determination in highly volatile cryptocurrency markets
3. Hybrid Signal System:
• Dual-mode Generation: Switch between classic MA crossovers and volatility band breakouts
• Multi-stage Confirmation: Optional signal verification across N forward bars
• Effect: 40-60% reduction in false signals compared to simple MA strategies
4. All-in-One Solution:
• 8 MA Types in One Code: The only strategy on TradingView with complete implementation of T3, EMA, SMA, WMA, VWMA, HMA, RMA, DEMA
• Custom Functions: All MAs calculated through custom functions supporting series int
• Versatility: One code replaces 8 different strategies
5. Intelligent Filtering:
Combination of 4 independent filters:
├── Volume Filter (dynamic multiplier)
├── Trend Filter (adaptive period)
├── ATR Filter (volatility)
└── Ichimoku Filter (cloud trend)
• Unique Logic: Each filter can work independently or in combination
• Master Switch: Single control for all filters
6. Advanced Risk Management:
• Smart Stops: SL/TP levels are stored in variables and not recalculated on every bar
• Slippage Protection: Checks both close and high/low for stop triggers
• Visualization: Dynamic display of levels only for active positions
7. Performance Optimization:
• Efficient Loops: Minimized calculations through intermediate result storage
• Conditional Visualization: Element rendering only when necessary
• Clean Code: Structured organization with clear logical block separation
═════════════════════════════════════════
💎 TECHNICAL INNOVATIONS
Adaptation Algorithm (exclusive development):
// Dynamic length based on RSI
rsi_scale = 1.0 - rsi / 100.0
len_adaptive = minLen + (maxLen - minLen) * rsi_scale
ATR-based Ichimoku (unique modification):
// Instead of classic (highest + lowest) / 2
// Using ATR for dynamic levels
upper := close < upper ? min(hl2 + atr*mult, upper ) : hl2 + atr*mult
lower := close > lower ? max(hl2 - atr*mult, lower ) : hl2 - atr*mult
Multi-MA Architecture (complete implementation):
• Each MA type has its own optimized function
• Support for series int for dynamic length
• Unified selection interface via switch statement
═════════════════════════════════════════
🎯 KEY FEATURES
• Adaptive System: Moving average length automatically adjusts based on RSI, providing quick response in trending movements and stability in sideways markets
• 8 Moving Average Types: T3, EMA, SMA, WMA, VWMA, HMA, RMA, DEMA - ability to choose the optimal type for different market conditions
• Multi-level Filtering:
- Volume Filter - signal confirmation with increased activity
- Trend Filter - trading in the direction of the main trend
- ATR Filter - accounting for market volatility
- Ichimoku Cloud - additional trend direction confirmation
• Professional Risk Management: Customizable stop-loss and take-profit levels
═════════════════════════════════════════
⚙️ HOW IT WORKS
1. Signal Generation:
• Original Mode: Classic MA crossover signals with lagged version
• Band Break Mode: Volatility band breakouts (based on standard deviation)
2. RSI Adaptation:
• High RSI (overbought) → uses short MA length for quick response
• Low RSI (oversold) → uses long MA for noise smoothing
• Adaptation range is configured by Min/Max length parameters
3. Filter System:
• Each filter can be enabled/disabled independently
• Signal is generated only when passing all active filters
• Ichimoku filter blocks counter-trend trades
═════════════════════════════════════════
📈 STRATEGY PARAMETERS
Main Settings:
• Strategy Type: Long Only / Short Only / Both
• Data Source: Close, Open, High, Low, HL2, HLC3, OHLC4
RSI Settings:
• RSI Length: Calculation period (default 14)
• RSI Smoothing: Smoothing to reduce noise
T3/MA Settings:
• Min/Max Length: Adaptive length range (5-50)
• Volume Factor: T3 smoothing coefficient (0.7)
• MA Type: Moving average type selection
Filters:
• Volume Filter: Volume multiplier (1.5x average)
• Trend Filter: Trend MA period (200)
• ATR Filter: Minimum volatility for entry
• Ichimoku Filter: Cloud for trend determination
Risk Management:
• Stop Loss: Percentage from entry price (1.2%)
• Take Profit: Percentage from entry price (5.9%)
• Position Size: 50,000 USDT (effective leverage 5x)
═════════════════════════════════════════
💡 USAGE RECOMMENDATIONS
Optimal Conditions:
• Timeframe: 1H (developed and optimized)
• Instrument: BTC/USDT and other liquid cryptocurrencies
• Market Conditions: Trending and moderately volatile markets
Customize to Your Style:
1. Conservative: Increase signal confirmation period, enable all filters
2. Aggressive: Reduce filters, use Band Break mode
3. Scalping: Decrease Min/Max length, disable trend filter
═════════════════════════════════════════
📊 VISUALIZATION
Strategy displays:
• Main MA Line - changes color depending on direction
• Lag Line - for visualizing crossover moment
• Volatility Bands - upper and lower boundaries
• Trend MA - orange line (200 periods)
• SL/TP Levels - red and green lines for open positions
═════════════════════════════════════════
🔔 ALERTS
Strategy supports alert configuration for:
• Long position entry signals
• Short position entry signals
• Position exit signals
• Ichimoku line crossings
═════════════════════════════════════════
⚠️ RISK WARNING
IMPORTANT NOTICE: Trading in financial markets involves substantial risk of capital loss. Past performance presented in this strategy is based solely on historical data and under no circumstances constitutes a guarantee of future returns.
The strategy author is not responsible for:
• Any direct or indirect financial losses resulting from the use of this strategy
• Trading decisions made based on strategy signals
• Interpretation of backtesting results as a forecast of future performance
This strategy is provided exclusively for educational and research purposes. Backtesting results are affected by numerous factors including but not limited to: slippage, spread, commissions, market liquidity, and technical failures.
Before using the strategy in live trading:
• Conduct your own testing on a demo account
• Ensure understanding of all parameters and logic
• Only use funds you can afford to lose
• Consider consulting with a qualified financial advisor
DISCLAIMER: By using this strategy, you acknowledge and accept all risks associated with financial market trading and confirm that the author does not provide investment advice and bears no fiduciary responsibility to users.
═════════════════════════════════════════
🛠 TECHNICAL SUPPORT
For questions about setup and optimization:
• Leave comments under the publication
• Follow strategy updates
• Study the code for deep understanding of logic
═════════════════════════════════════════
📝 VERSION AND UPDATES
Version: 1.0.0
Pine Script: v6
Last Updated: 2025
Changelog:
• Added support for 8 MA types
• Integrated Ichimoku Cloud filter
• Optimized risk management system
• Improved signal visualization
═════════════════════════════════════════
© 2025 BRT Trading Systems
Strategy is protected by copyright. Commercial use without author's permission is prohibited.

ETH/BTC/XRP Strategy - Powered by BCHETH/BTC/XRP Strategy — Cross-Asset Momentum-Based Strategy
Overview
This strategy aims to identify medium-term long trade opportunities on ETH/BTC/XRP 2 or 4 hour charts by leveraging cross-asset momentum signals from Bitcoin Cash (BCH) relative to Ethereum (ETH). It integrates volatility filters, volume validation, and momentum confirmations to improve trade timing and risk management.
Key Features and Logic
Cross-Asset Momentum Filter: Enters long trades when BCH outperforms ETH in the prior candle, supporting relative strength confirmation.
Volume Confirmation: BCH volume must exceed 135% of its 20-period average, validating market interest before entry signals.
Volatility Filter: ETH price near or below 110% of the lower Bollinger Band (20 periods, 2σ) indicates oversold conditions.
Momentum Indicators: ETH RSI below 70 ensures the asset is not overbought, coupled with BCH MACD line crossing above its signal line for bullish bias.
Risk Controls: Includes trailing stop losses and take profit targets to protect gains and limit drawdowns.
Timing Constraints: Controlled cooldown periods between trades help prevent overtrading and false signals.
Usage Recommendations
Optimized for 2 or 4hour ETH/BTC/XRP USDT candles; 5-minute data optionally used for finer entries and exits.
Suitable for traders seeking dynamic timing based on multi-asset interactions rather than blind holding.
Works as a complement within diversified or rotational strategies focusing on Ethereum exposure.
Performance Summary (Backtest Jan 2023 – Jul 2025) ; ETHUSDT 2hour basis.
Total trades: 65
Win rate: 61.5%
Profit factor: 5.1
Note: The sample size is limited; results should be interpreted with caution. Past performance is not indicative of future results.
Important Notes
This script represents an original combination of cross-asset momentum with volatility and volume filters tailored to ETH and BCH interaction.
Source code is protected to safeguard unique implementation details while allowing free usage without restrictions.
Use appropriate risk management, and consider these signals as part of a broader trading analysis.
No guarantees on profitability; trading involves significant risk.

Lunar calendar day Crypto Trading StrategyLunar calendar day Crypto Trading Strategy
This strategy explores the potential impact of the lunar calendar on cryptocurrency price cycles.
It implements a simple but unconventional rule:
Buy on the 5th day of each lunar month
Sell on the 26th day of the lunar month
No trades between January 1 (solar) and Lunar New Year’s Day (holiday buffer period)
Research background
Several academic studies have investigated the influence of lunar cycles on financial markets. Their findings suggest:
Returns tend to be higher around the full moon compared to the new moon.
Periods between the full moon and the waning phase often show stronger average returns than the waxing phase.
This strategy combines those observations into a practical implementation by testing fixed entry (lunar day 5) and exit (lunar day 26) points, while excluding the transition period from solar New Year to Lunar New Year, effectively capturing mid-month lunar effects.
How it works
The script includes a custom lunar date calculation function, reconstructing lunar months and days for each year (2020–2026).
On lunar day 5, the strategy opens a long position with 100% of equity.
On lunar day 26, the strategy closes the position.
No trades are executed between Jan 1 and Lunar New Year’s Day.
All trades include:
Commission: 0.1%
Slippage: 3 ticks
Position sizing uses the entire equity (100%) for simplicity, but this is not recommended for live trading.
Why this is original
Unlike mashups of built-in indicators, this script:
Implements a full lunar calendar system inside Pine Script.
Translates academic findings on lunar effects into an applied backtest.
Adds a realistic trading filter (holiday gap) based on cultural/seasonal calendar rules.
Provides researchers and traders with a framework to explore non-traditional, time-based signals.
Notes
This is an experimental, research-oriented strategy, not financial advice.
Results are highly dependent on the chosen period (2020–2026).
Using 100% equity per trade is for simplification only and is not a viable money management practice.
The purpose is to investigate whether cyclical patterns linked to lunar time can provide any statistical edge in ETHUSDT.

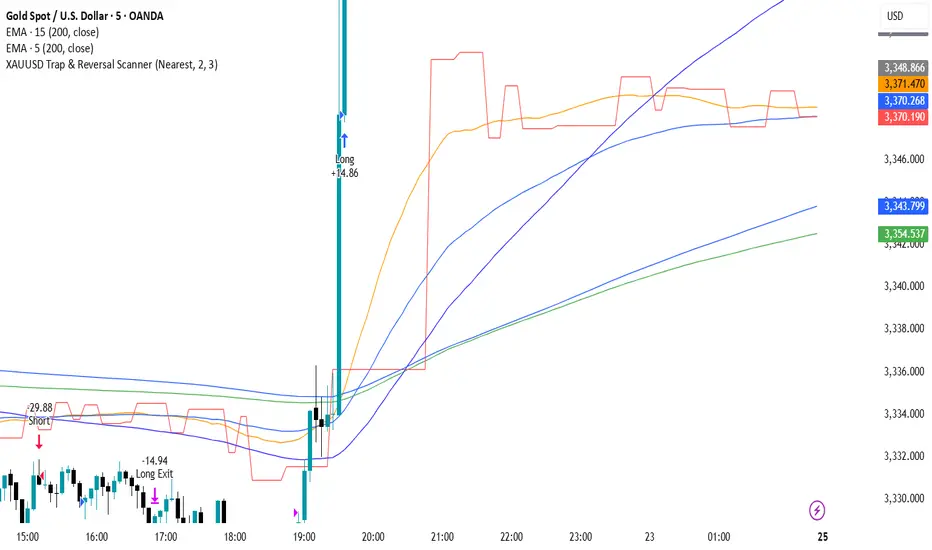
XAUUSD Trap & Reversal ScannerThis strategy is designed for XAUUSD (Gold) on 5m/15m timeframes.
It detects and trades reversal traps confirmed by classic patterns:
Double Tops / Double Bottoms
Head & Shoulders / Inverse H&S
Fair Value Gaps (FVG / IFVG)
Trap Sweeps (stop hunts)
Additional filters:
EMA200 trend confirmation
London & New York trading session filter (12:00–17:00 UTC)
Risk management with ATR-based stop loss
Partial profit-taking (50% at 1:1, remainder at 1:RR up to 1:4)
MTF RSI + ADX + ATR SL/TP vivekDescription:
This strategy combines the power of multi-timeframe RSI filtering with ADX trend confirmation and ATR-based risk management to capture strong directional moves.
🔑 Entry Rules:
• Daily RSI > 60
• 4H RSI > 60
• 1H RSI > 60
• 10m RSI > 40
• ADX (current timeframe) > 20
When all conditions align, a long entry is triggered.
🛡 Risk Management:
• ATR-based Stop-Loss (customizable multiplier)
• Take-Profit defined as a Risk-Reward multiple of the ATR stop
🎯 Why this Strategy?
• Ensures alignment across higher timeframes before entering a trade
• Uses ADX to avoid choppy/range-bound markets
• Built-in ATR stop-loss & take-profit for disciplined risk control
• Fully customizable parameters
This strategy is designed for trend-following swing entries. It works best on liquid instruments such as indices, forex pairs, and large-cap stocks. Always optimize the parameters based on your preferred asset and timeframe.

MTF RSI + ADX + ATR SL/TPThis strategy combines the power of multi-timeframe RSI filtering with ADX trend confirmation and ATR-based risk management to capture strong directional moves.
🔑 Entry Rules:
• Daily RSI > 60
• 4H RSI > 60
• 1H RSI > 60
• 10m RSI > 40
• ADX (current timeframe) > 20
When all conditions align, a long entry is triggered.
🛡 Risk Management:
• ATR-based Stop-Loss (customizable multiplier)
• Take-Profit defined as a Risk-Reward multiple of the ATR stop
🎯 Why this Strategy?
• Ensures alignment across higher timeframes before entering a trade
• Uses ADX to avoid choppy/range-bound markets
• Built-in ATR stop-loss & take-profit for disciplined risk control
• Fully customizable parameters
This strategy is designed for trend-following swing entries. It works best on liquid instruments such as indices, forex pairs, and large-cap stocks. Always optimize the parameters based on your preferred asset and timeframe.