Sr.Rma.Prev High/lows with Alerts
Disclaimer: This chart is designed for educational purposes only. Please conduct your own due diligence before entering any trades.
The strategy is based on previous highs and lows, combined with stop-loss and reversal percentage logic. It is most effective on SPY and QQQ using the 1-minute time-frame, where I personally trade next-day expiration with preset configurations.
If you choose to apply it to other stocks, be sure to adjust the stop-loss % and re-entry % parameters to match your trading style and risk tolerance.
Grafik Desenleri

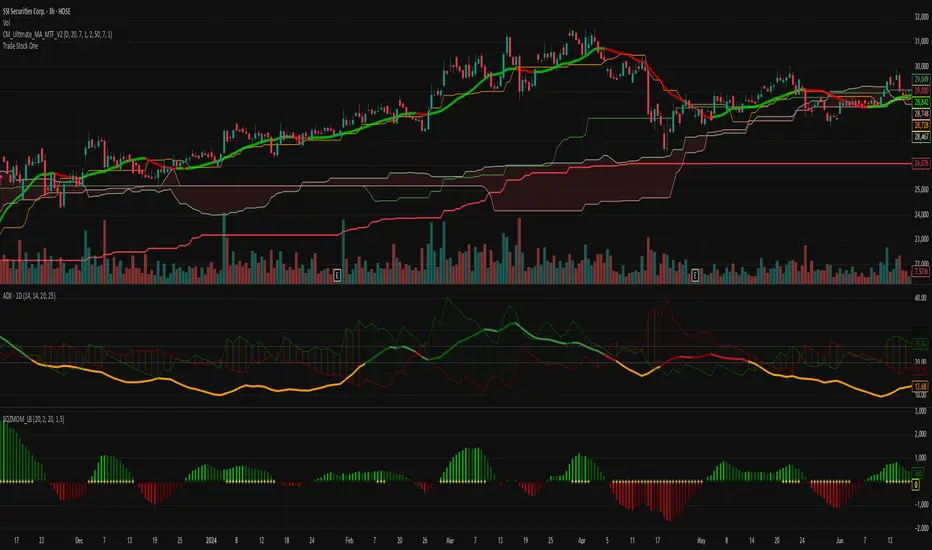
TradeStockOnev4Professional Trading Strategy
Specializes in trading uptrends, riding long-term waves
Limits frequent entries
Suitable for medium- to long-term stock trading
C25_EngulfingEngulfing Testing Script. Best used for 5m MNQ futures. Can work on others with tweaks to parameters


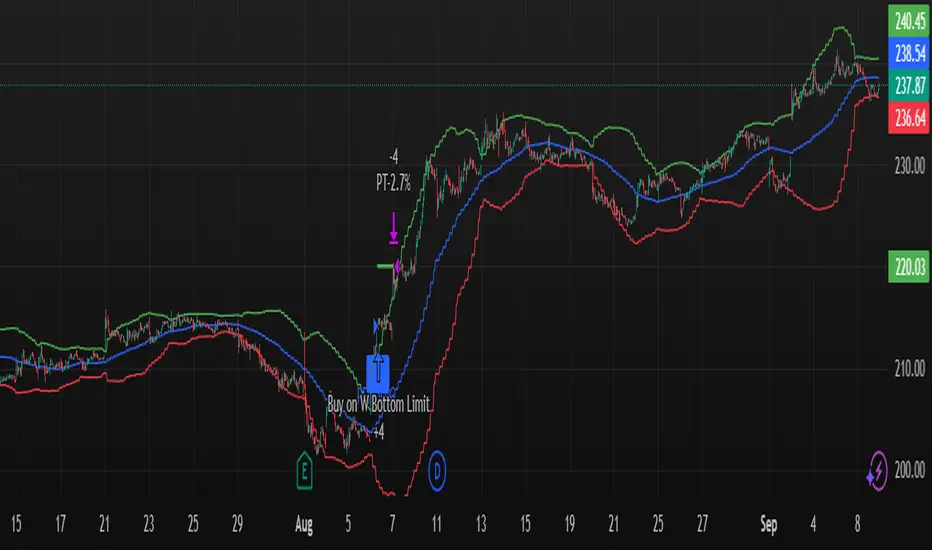
W Bottom Reversal Strategy W Bottom Reversal Strategy (15m-close entries; intrabar TP; daily MACD exit; JSON alerts v49.3-expire2)
Overview
A precision reversal strategy designed for 15-minute charts on liquid symbols. It detects a capitulation-and-stabilization “W” base using 1-hour (1H) context, confirms momentum improvement, then enters only on bar close to avoid early/“ghost” signals. Exits combine a fast intrabar take-profit (~2.7%) with a daily MACD risk-off exit that closes positions when higher-timeframe momentum turns against the setup.
How it works (high-level, matching code)
1H volatility + oversold gate (arming)
Compute 1H Bollinger-style bands (basis = SMA(close, bbLength=20), stdev multiplier bbMult=2.0).
Arm the setup when a 1H bar closes with price < 1H lower band and 1H RSI( rsiLength=14 ) < rsiThreshold (default 20.0).
1H momentum flip → pending entry
When a new 1H bar closes and 1H MACD line (EMA12−EMA26) crosses above 0 while armed and flat, set an entryPending flag.
This does not enter yet—it prepares a confirmed, bar-close entry on the lower timeframe.
Bar-close execution on the chart timeframe (15m)
On the next 15m bar close (or within N bars, see below) and still flat, fire the entry using a limit order at close × (1 − 0.00001) (≈ 0.001% below close) to reduce slippage and maintain chart/alert alignment.
Anti-late filter (no stale triggers)
If the pending entry doesn’t trigger within N chart bars (input: “Pending entry valid for N chart bars”, default 1, range 1–8), it expires and the arm state resets. This prevents late fills long after the 1H confirmation.
Exit logic
Primary: Standing intrabar take-profit at +2.7% from the average entry price (managed via strategy.exit limit).
Risk-off: On daily bar close, if Daily MACD line (EMA12−EMA26) crosses under 0, close the position (flat on daily momentum flip).
Default Properties (used for this publication)
Timeframe: 15m (with 1H and Daily higher-timeframe confirmations via request.security)
Initial capital: $10,000
Position sizing: Percent of equity = 10% per trade (enters only when flat; no stacking while in a position)
Commission: 0.05% per side
Slippage: Recommend 1 tick in Strategy Properties for realistic fills
Inputs exposed:
BB Length: 20 • BB Multiplier: 2.0
RSI Length: 14 • RSI Threshold: 20.0
MACD: Short 12, Long 26, Signal 9 (signal kept for compatibility; logic uses MACD line vs 0)
Pending entry valid for N chart bars: default 1 (1–8)
Execution behavior (per code):
calc_on_every_tick = false (evaluates on bar close)
process_orders_on_close = true (orders placed at bar close)
Limit entry at close −0.001%
Intrabar TP (2.7%)
Daily risk-off exit on MACD<0 at daily bar close
Alerts (exact behavior in code)
Uses alert() function calls with standardized JSON.
Set your alert to “Only alert() function calls” and “Once per bar close.”
Two events are emitted:
LONG_CONFIRMED on entry fire (15m bar close)
EXIT_CONFIRMED_DAILY_MACD on daily MACD<0 (daily bar close)
JSON fields include: event, version ("v49.3-expire2"), symbol, interval, price, and time.
How to use
Apply on liquid tickers (tight spreads, healthy volume).
Keep defaults initially; run across a broad, liquid watchlist to gather a proper sample.
For automation, route bar-close alerts to your executor; confirm broker lot/route settings and that limit orders at close −0.001% are acceptable.
Expect fewer signals in powerful trends; the daily risk-off helps cut failed bases.
Methodology & expectations (results transparency)
Evaluate on a dataset yielding 100+ trades before drawing conclusions.
Keep commission & slippage enabled (see defaults).
Risk sizing: With 10% of equity per trade and flat-to-flat entries, exposure aligns with typical 5–10% guidance.
No performance guarantees—outcomes depend on symbol selection, volatility regime, news, and execution quality.
Originality & value (vendor justification)
While it uses familiar building blocks (BB/RSI/MACD), the edge comes from the 1H volatility + oversold arming, 1H momentum flip, strict 15m bar-close limit execution, and the N-bar pending expiry that prevents stale triggers—paired with a dual-exit design (intrabar TP + daily risk-off). The focus is on reducing premature fills, keeping alerts 1:1 with chart marks, and capturing the first impulse out of a W-base.
Disclaimers
For educational purposes only; not financial advice. Paper-test first. Verify alerts, fills, and symbol liquidity with your broker before live use.
Changelog: v49.3-expire2 — Bar-close limit entries; anti-late pending window; standardized JSON alerts; intrabar 2.7% TP; daily MACD risk-off exit.
Recovery StrategyDescription:
The Recovery Strategy is a long-only trading system designed to capitalize on significant price drops from recent highs. It enters a position when the price falls 10% or more from the highest high over a 6-month lookback period and adds positions on further 2% drops, up to a maximum of 5 positions. Each trade is held for 6 months before exiting, regardless of profit or loss. The strategy uses margin to amplify position sizes, with a default leverage of 5:1 (20% margin requirement). All key parameters are customizable via inputs, allowing flexibility for different assets and timeframes. Visual markers indicate recent highs for reference.
How It Works:
Entry: Buys when the closing price drops 10% or more from the recent high (highest high in the lookback period, default 126 bars ~6 months). If already in a position, additional buys occur on further 2% drops (e.g., 12%, 14%, 16%, 18%), up to 5 positions (pyramiding).
Exit: Each trade exits after its own holding period (default 126 bars ~6 months), regardless of profit or loss. No stop loss or take-profit is used.
Margin: Uses leverage to control larger positions (default 20% margin, 5:1 leverage). The order size is a percentage of equity (default 100%), adjustable via inputs.
Visualization: Displays blue markers (without text) at new recent highs to highlight reference levels.
Inputs:
Lookback Period for High Peak (bars): Number of bars to look back for the recent high (default: 126, ~6 months on daily charts).
Initial Drop Percentage to Buy (%): Percentage drop from recent high to trigger the first buy (default: 10.0%).
Additional Drop Percentage to Buy (%): Further drop percentage to add positions (default: 2.0%).
Holding Period (bars): Number of bars to hold each position before selling (default: 126, ~6 months).
Order Size (% of Equity): Percentage of equity used per trade (default: 100%).
Margin for Long Positions (%): Percentage of position value covered by equity (default: 20%, equivalent to 5:1 leverage).
Usage:
Timeframe: Designed for daily charts (126 bars ~6 months). Adjust Lookback Period and Holding Period for other timeframes (e.g., 1008 hours for hourly charts, assuming 8 trading hours/day).
Assets: Suitable for stocks, ETFs, or other assets with significant price volatility. Test thoroughly on your chosen asset.
Settings: Customize inputs in the strategy settings to match your risk tolerance and market conditions. For example, lower Margin for Long Positions (e.g., to 10% for 10:1 leverage) to increase position sizes, but beware of higher risk.
Backtesting: Use TradingView’s Strategy Tester to evaluate performance. Check the “List of Trades” for skipped trades due to insufficient equity or margin requirements.
Risks and Considerations:
No Stop Loss: The strategy holds trades for the full 6 months without a stop loss, exposing it to significant drawdowns in prolonged downtrends.
Margin Risk: Leverage (default 5:1) amplifies both profits and losses. Ensure sufficient equity to cover margin requirements to avoid skipped trades or simulated margin calls.
Pyramiding: Up to 5 positions can be open simultaneously, increasing exposure. Adjust pyramiding in the code if fewer positions are desired (e.g., change to pyramiding=3).
Market Conditions: Performance depends on price drops and recoveries. Test on historical data to assess effectiveness in your market.
Broker Emulator: TradingView’s paper trading simulates margin but does not execute real margin trading. Results may differ in live trading due to broker-specific margin rules.
How to Use:
Add the strategy to your chart in TradingView.
Adjust input parameters in the settings panel to suit your asset, timeframe, and risk preferences.
Run a backtest in the Strategy Tester to evaluate performance.
Monitor open positions and margin levels in the Trading Panel to manage risk.
For live trading, consult your broker’s margin requirements and leverage policies, as TradingView’s simulation may not match real-world conditions.
Disclaimer:
This strategy is for educational purposes only and does not constitute financial advice. Trading involves significant risk, especially with leverage and no stop loss. Always backtest thoroughly and consult a financial advisor before using any strategy in live trading.

LP Sweep / Reclaim & Breakout Grading: Long-onlySignals
1) LP Sweep & Reclaim (mean-reversion entry)
Compute LP bounds from prior-bar window extremes:
lpLL_prev = lowest low of the last N bars (offset 1).
lpHH_prev = highest high of the last N bars (offset 1).
Sweep long trigger: current low dips below lpLL_prev and closes back above it.
Real-time quality grading (A/B/C) for sweep:
Trend filter & slope via EMA(88).
BOS bonus: close > last confirmed swing high.
Body size vs ATR, location above a long EMA, headroom to swing high (penalty if too close), and multi-sweep count bonus.
Sum → score → grade A/B/C; A or B required for sweep entry.
2) Trend Breakout (momentum entry)
Core trigger: close > previous Donchian high (length boLen) + ATR buffer.
Optional filter: close must be above the default EMA.
Breakout grading (A/B/C) in real time combining:
Trend up (price > EMA and EMA rising),
Body/ATR, Gap above breakout level (in ATR),
Volume vs MA,
Upper-wick penalty,
Position-in-Score: headroom to last swing high (penalty if too near) + EMA slope bonus.
Sum → score → A or B required if grading enabled.

Sweep/Reclaim & Breakout Grading — Long-onlyStrategy Overview
Name: LP Sweep & Reclaim — Long-only: Breakout Grading with Position-in-Score + Hybrid SL + 1R→BE
Signals
1) LP Sweep & Reclaim (mean-reversion entry)
2) Trend Breakout (momentum entry)
Risk & Exit Logic
Hybrid Stop-Loss (at entry)
Compute two candidates:
Structure-based SL: reference level (LP low for sweeps, min(low, donchianHigh) for breakouts) minus k × ATR.
ATR-based SL: close − m × ATR.
Hybrid rule (longs): pick the tighter one (the higher price) → initial SL.
1R → Breakeven (BE) transition
Trend Take-Profit (EMA cross)
Exit condition: after at least minHoldBars since entry (default 4), close crosses below the chosen EMA → strategy.close.

Nifty 50 Scalping - Bullish Buy & Bearish Sell (5 Target / 2 SL)Nifty 50 Scalping - Bullish Buy & Bearish Sell (5 Target / 2 SL)

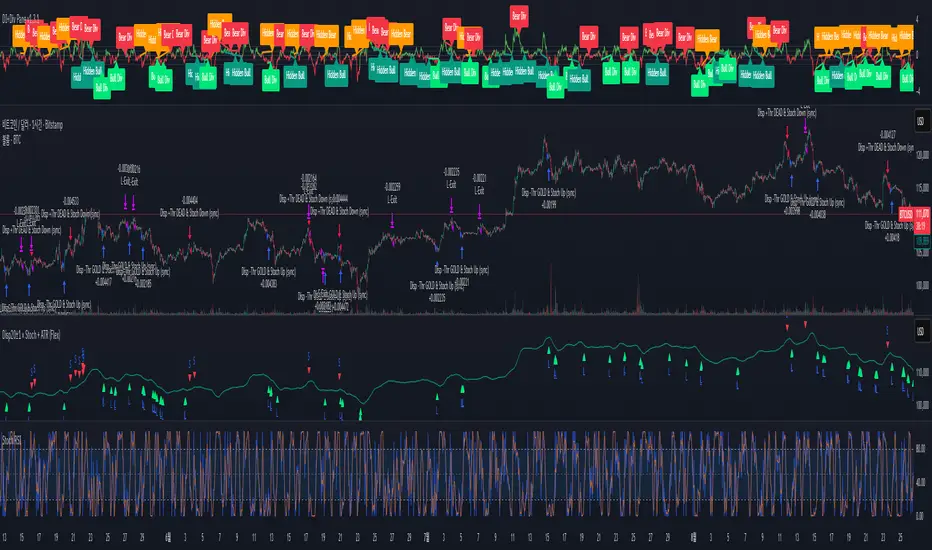
Disparity(20MA) ±1 × Stochastic 80/20 + ATR SL/TP[by Irum]Disparity(20MA) ±1 × Stochastic 80/20 + ATR SL/TP
사용 설명서 (KR/EN Bilingual Manual)
1) 목적 & 정의 / Purpose & Definition
KR — 목적 & 정의
이 스크립트는 이격도(Disparity) 와 스토캐스틱(80/20) 의 동시 신호를 활용해 추세 전환/지속 구간의 고확률 진입 시점을 포착하고, ATR 기반 손절/익절(고정 또는 트레일링)로 리스크를 정량화하여 운용 효율을 높이기 위해 설계되었습니다.
핵심 아이디어:
가격이 20MA 대비 ±임계값을 크로스(과열/침체 해소 신호)하고,
스토캐스틱이 80/20을 돌파/이탈(모멘텀 전환 신호)할 때,
두 신호가 동일봉 또는 N봉 내 동기화되면 진입.
청산: ATR×배수를 이용한 고정 TP/SL 또는 ATR 트레일링.
EN — Purpose & Definition
This strategy combines Disparity (price vs. 20MA) and Stochastic (80/20) to identify high-probability entries when momentum confirms mean-reversion/continuation, while ATR-based stops/take-profits (fixed or trailing) provide quantified risk control.
Core Idea:
Disparity crosses ±threshold (overbought/oversold release),
Stochastic crosses 80/20 (momentum shift),
Both conditions sync on the same bar or within N bars → entry.
Exits: Fixed ATR TP/SL or ATR trailing.
2) 신호 로직 요약 / Signal Logic Overview
KR
롱 진입: Disparity가 −임계값 상향 돌파 & Stochastic 20 상향 돌파가 syncBars 이내에 동시 충족.
숏 진입: Disparity가 +임계값 하향 돌파 & Stochastic 80 하향 돌파가 syncBars 이내에 동시 충족.
완화 옵션(useRelaxStoch): 최근 relaxLookback 내 20/80 터치 이력 + 현재 방향성만으로도 모멘텀 전환을 인정(교차 미충족 보완).
EN
Long: Disparity crosses up −threshold & Stochastic crosses up 20 within syncBars.
Short: Disparity crosses down +threshold & Stochastic crosses down 80 within syncBars.
Relaxed option (useRelaxStoch): Accepts momentum shift if 20/80 was touched in the last relaxLookback bars and the current slope confirms, even without a strict cross.
3) 설정 메뉴 안내 / Settings Menu Guide
A. 기본 / Core
기준가격 / Source (source)
설명: Disparity 계산에 쓰는 가격 소스.
입력: close, hl2, ohlc4 등.
기본값: close.
팁: 변동성 큰 종목은 hlc3/ohlc4가 노이즈를 줄이기도 함.
이격도 기준 MA 길이 / MA Length (for Disparity) (int ≥1)
설명: Disparity의 기준선이 되는 단순이동평균 길이.
기본값: 20.
영향: 길이↑ → 신호 빈도↓, 안정성↑.
이격도 임계값(±%) / Disparity Threshold (±%) (float ≥0.1, step 0.1)
설명: Disparity가 +임계값 아래로 하향 크로스(숏) 또는 −임계값 위로 상향 크로스(롱)할 때 신호.
기본값: 1.0%.
팁: 너무 크면 신호 드뭄, 너무 작으면 과다.
B. 스토캐스틱 / Stochastic
%K Length / K 길이 (int ≥1, 기본 14)
%K Smoothing / K 스무딩 (int ≥1, 기본 1)
%D Length / D 길이 (int ≥1, 기본 3)
설명: ta.stoch의 K를 스무딩한 kSlow와, 추가 스무딩한 dSlow(참조용)를 구성.
Buy Level (↑20) / 매수 기준선 (0~100, 기본 20)
Sell Level (↓80) / 매도 기준선 (0~100, 기본 80)
C. 신호 로직 / Signal Logic
Signal Sync Window (bars) / 신호 동기화 윈도우 (0~10, 기본 0)
설명: 0=두 신호가 같은 봉에서 모두 충족해야 함. N>0=최근 N봉 내에서 각각 한 번 발생하면 인정.
팁: 1~3은 현실적 체결/지연을 반영하며 과최적화 방지에 도움.
Relaxed Stochastic? (교차 완화) (bool, 기본 false)
설명: 교차 대신 최근 20/80 터치 + 현재 기울기만으로도 모멘텀 전환을 인정. 신호 빈도↑.
Relax lookback bars (int ≥1, 기본 5)
설명: 완화판정에 쓰는 최근 봉 수.
D. 리스크 / Risk (ATR)
ATR Length / ATR 길이 (int ≥1, 기본 14)
ATR Mult for Stop / 손절 ATR 배수 (float ≥0.1, 기본 1.5)
ATR Mult for Take-Profit / 익절 ATR 배수 (float ≥0.1, 기본 2.0)
설명: 진입가 ± ATR×배수로 SL/TP 설정.
팁: 변동성 큰 자산은 SL 배수↑, TP 배수도 함께 조정 권장.
Use ATR Trailing Stop? / ATR 트레일링 사용 (bool, 기본 false)
ATR Mult for Trailing / 트레일링 ATR 배수 (float ≥0.1, 기본 2.0)
설명: 고정 TP/SL 대신 추적 손절을 사용(수익 추적에 유리).
E. 시각화 / Visualization
Plot 20MA / 20MA 표시 (bool, 기본 true)
Show Entry Markers / 진입 마커 표시 (bool, 기본 true)
4) 진입·청산 규칙 / Entry & Exit Rules
KR
진입: 위 “신호 로직” 충족 시 strategy.entry("L"/"S").
청산 (고정형):
롱: Stop = 진입 − ATR×SL, TP = 진입 + ATR×TP
숏: Stop = 진입 + ATR×SL, TP = 진입 − ATR×TP
청산 (트레일링형):
ATR×trailMult로 산출한 trail_points/offset으로 추적 손절.
EN
Entry: Place strategy.entry("L"/"S") when sync conditions are met.
Exit (Fixed):
Long: Stop = Entry − ATR×SL, TP = Entry + ATR×TP
Short: Stop = Entry + ATR×SL, TP = Entry − ATR×TP
Exit (Trailing):
Use ATR×trailMult as trailing distance & offset.
5) 알림 / Alerts
조건
Long Entry (Disp −Thr & Stoch Up, sync) → longSignal
Short Entry (Disp +Thr & Stoch Down, sync) → shortSignal
메시지 포맷 / Message format
{"signal":"long|short","symbol":"{{ticker}}","price":{{close}}}
Webhook(예: 거래소·봇)에서 signal/symbol/price를 활용해 체결 로직과 연동하십시오.
6) 빠른 시작 & 권장 프리셋 / Quick Start & Suggested Presets
KR — BTC/USDT (15분봉) 제안
maLen=20, thrPct=1.0~1.5, kLen=14, kS=1, dLen=3, stBuyLv=20, stSellLv=80
syncBars=1~3 (동시성 여유), useRelaxStoch=true, relaxLookback=5
고정형: atrLen=14, atrMultSL=1.5~2.0, atrMultTP=2.0~3.0
트레일링형: useTrail=true, trailMult=2.0~3.0
EN — BTC/USDT (15-min) suggestion
Above defaults, with syncBars=1~3, useRelaxStoch=true to improve fill realism.
Increase atrMultSL on high-volatility days to reduce whipsaws.
7) 운용 팁 & 점검 / Tips & Troubleshooting
KR
신호가 안 나와요: thrPct가 지나치게 크거나 syncBars=0으로 너무 엄격할 수 있음. thrPct↓, syncBars↑ 조정.
휩쏘 과다: useRelaxStoch를 끄거나 thrPct↑, atrMultSL↑.
TP 도달 전에 청산: 트레일링 사용 시 변동성 확대로 SL이 따라붙다 체결될 수 있음 → trailMult↑ 또는 고정형 전환.
과최적화 방지: 한 구간에 과특화된 튜닝(특히 syncBars, thrPct)은 다른 시장에서 성능 저하. Walk-forward 권장.
EN
No signals: Lower thrPct and/or increase syncBars.
Too many whipsaws: Disable relaxed mode, raise thrPct and/or atrMultSL.
Stopped before TP (trailing): Increase trailMult or switch to fixed exits.
Robustness: Avoid over-tuning; validate via walk-forward testing.
Trend Following S/R Fibonacci Strategy 2Trend Following S/R Fibonacci Strategy 2
Trend Following S/R Fibonacci Strategy 2

Hilly 2.0 Advanced Crypto Scalping Strategy - 1 & 5 Min ChartsHow to Use
Copy the Code: Copy the script above.
Paste in TradingView: Open TradingView, go to the Pine Editor (bottom of the chart), paste the code, and click “Add to Chart.”
Check for Errors: Verify no errors appear in the Pine Editor console. The script uses Pine Script v5 (@version=5).
Select Timeframe:
1-Minute Chart: Use defaults (emaFastLen=7, emaSlowLen=14, rsiLen=10, rsiOverbought=80, rsiOversold=20, slPerc=0.5, tpPerc=1.0, useCandlePatterns=false).
5-Minute Chart: Adjust to emaFastLen=9, emaSlowLen=21, rsiLen=14, rsiOverbought=75, rsiOversold=25, slPerc=0.8, tpPerc=1.5, useCandlePatterns=true.
Apply to Chart: Use a liquid crypto pair (e.g., BTC/USDT, ETH/USDT on Binance or Coinbase).
Verify Signals:
Green “BUY” or “EMA BUY” labels and triangle-up arrows below candles.
Red “SELL” or “EMA SELL” labels and triangle-down arrows above candles.
Green/red background highlights for signal candles.
Arrows use size.normal for consistent visibility.
Backtest: Use TradingView’s Strategy Tester to evaluate performance over 1–3 months, checking Net Profit, Win Rate, and Drawdown.
Demo Test: Run on a demo account to confirm signal visibility and performance before trading with real funds.

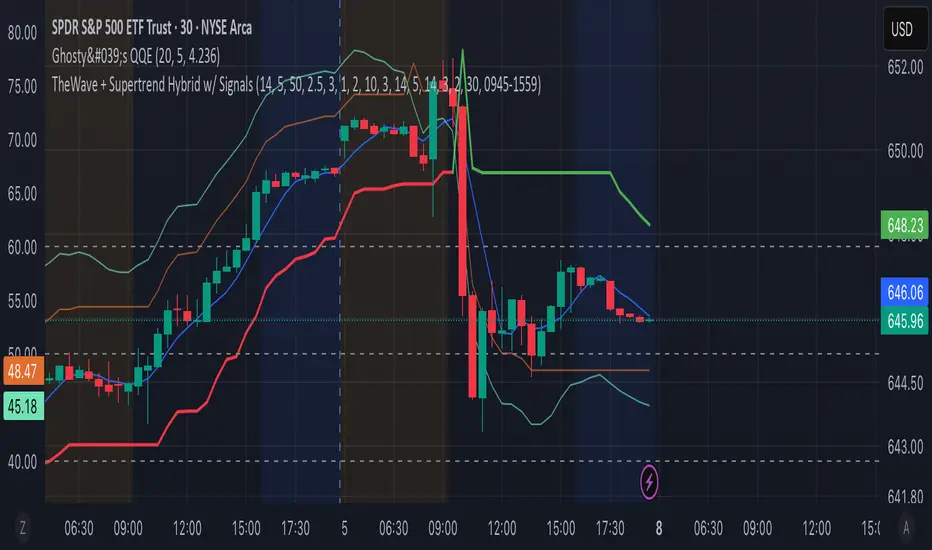
TheWave + Supertrend Hybrid w/ Signals• Green triangle below bar → Long entry signal
• Red triangle above bar → Short entry signal
• Small lime cross above/below → Take-profit hit
• Small maroon cross above/below → Stop-loss hit
• SMA5 and Supertrend lines for trend context
This version makes all entries and exits visually obvious while keeping the hybrid TheWave + Supertrend logic intact.
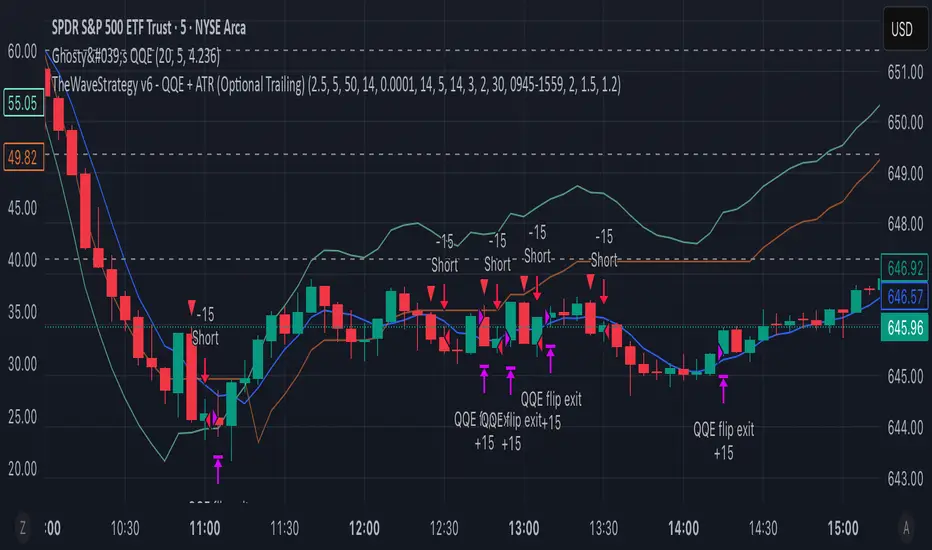
TheWaveStrategy v6 - QQE + ATR (Optional Trailing)New Version Of the wave with QQE and ATR
• Compiles cleanly in Pine v6.
• Optional trailing stop toggle via useTrailingATR.
• Market exit uses strategy.close() properly.
• ATR spike filter uses 5m ATR.
• QQE confluence with 30m timeframe included.
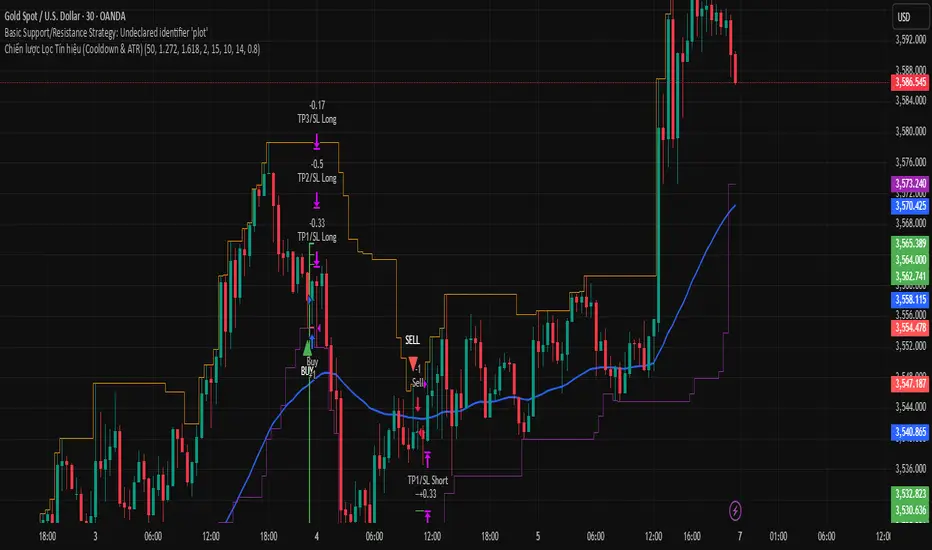
Chiến lược Lọc Tín hiệu (Cooldown & ATR)Chiến lược Lọc Tín hiệu (Cooldown & ATR)
Chiến lược Lọc Tín hiệu (Cooldown & ATR)

Consolidated 9-Indicator Buy/Sell Zones & TriggersALL important inductors combined for long term position holders and short term guys...use it to enter trade and exit ...backgroud colour will give you the indication of the market mood..

swapstrategy-Reversal StrategyGenerate buy and sell signals and reverses position when chart turn buy or sell side

LFT strategy Main Reversion
this script will tell exactly when to buy and sell with TP and SL, used the latest LLM to tone the model with a profit ratio of 2.05 in 6 years and profit ratio of 4.02 in past 6 month and have been back tested with Monte Carlo simulation, with profit ratio 1+ for 99% of the time with 1000 iterations with 500 steps, for 100 times
please contact LFT Foundation for access

Hilly's Advanced Crypto Scalping Strategy - 5 Min ChartTo determine the "best" input parameters for the Advanced Crypto Scalping Strategy on a 5-minute chart, we need to consider the goals of optimizing for profitability, minimizing false signals, and adapting to the volatile nature of cryptocurrencies. The default parameters in the script are a starting point, but the optimal values depend on the specific cryptocurrency pair, market conditions, and your risk tolerance. Below, I'll provide recommended input values based on common practices in crypto scalping, along with reasoning for each parameter. I’ll also suggest how to fine-tune them using TradingView’s backtesting and optimization tools.
Recommended Input Parameters
These values are tailored for a 5-minute chart for liquid cryptocurrencies like BTC/USD or ETH/USD on exchanges like Binance or Coinbase. They aim to balance signal frequency and accuracy for day trading.
Fast EMA Length (emaFastLen): 9
Reasoning: A 9-period EMA is commonly used in scalping to capture short-term price movements while remaining sensitive to recent price action. It reacts faster than the default 10, aligning with the 5-minute timeframe.
Slow EMA Length (emaSlowLen): 21
Reasoning: A 21-period EMA provides a good balance for identifying the broader trend on a 5-minute chart. It’s slightly longer than the default 20 to reduce noise while confirming the trend direction.
RSI Length (rsiLen): 14
Reasoning: The default 14-period RSI is a standard choice for momentum analysis. It works well for detecting overbought/oversold conditions without being too sensitive on short timeframes.
RSI Overbought (rsiOverbought): 75
Reasoning: Raising the overbought threshold to 75 (from 70) reduces false sell signals in strong bullish trends, which are common in crypto markets.
RSI Oversold (rsiOversold): 25
Reasoning: Lowering the oversold threshold to 25 (from 30) filters out weaker buy signals, ensuring entries occur during stronger reversals.
MACD Fast Length (macdFast): 12
Reasoning: The default 12-period fast EMA for MACD is effective for capturing short-term momentum shifts in crypto, aligning with scalping goals.
MACD Slow Length (macdSlow): 26
Reasoning: The default 26-period slow EMA is a standard setting that works well for confirming momentum trends without lagging too much.
MACD Signal Smoothing (macdSignal): 9
Reasoning: The default 9-period signal line is widely used and provides a good balance for smoothing MACD crossovers on a 5-minute chart.
Bollinger Bands Length (bbLen): 20
Reasoning: The default 20-period Bollinger Bands are effective for identifying volatility breakouts, which are key for scalping in crypto markets.
Bollinger Bands Multiplier (bbMult): 2.0
Reasoning: A 2.0 multiplier is standard and captures most price action within the bands. Increasing it to 2.5 could reduce signals but improve accuracy in highly volatile markets.
Stop Loss % (slPerc): 0.8%
Reasoning: A tighter stop loss of 0.8% (from 1.0%) suits the high volatility of crypto, helping to limit losses on false breakouts while keeping risk manageable.
Take Profit % (tpPerc): 1.5%
Reasoning: A 1.5% take-profit target (from 2.0%) aligns with scalping’s goal of capturing small, frequent gains. Crypto markets often see quick reversals, so a smaller target increases the likelihood of hitting profits.
Use Candlestick Patterns (useCandlePatterns): True
Reasoning: Enabling candlestick patterns (e.g., engulfing, hammer) adds confirmation to signals, reducing false entries in choppy markets.
Use Volume Filter (useVolumeFilter): True
Reasoning: The volume filter ensures signals occur during high-volume breakouts, which are more likely to sustain in crypto markets.
Signal Arrow Size (signalSize): 2.0
Reasoning: Increasing the arrow size to 2.0 (from 1.5) makes buy/sell signals more visible on the chart, especially on smaller screens or volatile price action.
Background Highlight Transparency (bgTransparency): 85
Reasoning: A slightly higher transparency (85 from 80) keeps the background highlights subtle but visible, avoiding chart clutter.
How to Apply These Parameters
Copy the Script: Use the Pine Script provided in the previous response.
Paste in TradingView: Open TradingView, go to the Pine Editor, paste the code, and click "Add to Chart."
Set Parameters: In the strategy settings, manually input the recommended values above or adjust them via the input fields.
Test on a 5-Minute Chart: Apply the strategy to a liquid crypto pair (e.g., BTC/USDT, ETH/USDT) on a 5-minute chart.
Fine-Tuning for Optimal Performance
To find the absolute best parameters for your specific trading pair and market conditions, use TradingView’s Strategy Tester and optimization features:
Backtesting:
Run the strategy on historical data for your chosen pair (e.g., BTC/USDT on Binance).
Check metrics like Net Profit, Profit Factor, Win Rate, and Max Drawdown in the Strategy Tester.
Focus on a sample period of at least 1–3 months to capture various market conditions (bull, bear, sideways).
Parameter Optimization:
In the Strategy Tester, click the settings gear next to the strategy name.
Enable optimization for key inputs like emaFastLen (test range: 7–12), emaSlowLen (15–25), slPerc (0.5–1.5), and tpPerc (1.0–3.0).
Run the optimization to find the combination with the highest net profit or best Sharpe ratio, but avoid over-optimization (curve-fitting) by testing on out-of-sample data.
Market-Specific Adjustments:
Volatile Pairs (e.g., DOGE/USDT): Use tighter stop losses (e.g., 0.5–0.7%) and smaller take-profit targets (e.g., 1.0–1.2%) to account for rapid price swings.
Stable Pairs (e.g., BTC/USDT): Slightly wider stop losses (e.g., 1.0–1.2%) and take-profit targets (e.g., 1.8–2.5%) may work better.
Trending Markets: Increase emaSlowLen (e.g., to 25–30) to follow stronger trends.
Choppy Markets: Tighten bbMult (e.g., to 1.8) and lower rsiOverbought/rsiOversold (e.g., to 70/30) to filter noise.
Forward Testing:
After backtesting, run the strategy in real-time on a demo account for 1–2 weeks to validate performance under current market conditions.
Important Notes
No Universal "Best" Numbers: Optimal parameters vary by crypto pair, exchange, and market conditions (e.g., bull vs. bear market). The suggested values are a starting point based on common scalping practices.
Risk Management: Never risk more than 1–2% of your account per trade. Adjust position sizing in TradingView’s strategy settings to align with your risk tolerance.
Market Volatility: Crypto markets are highly volatile. Test the strategy on your specific pair and adjust parameters if signals are too frequent or too rare.
Not Financial Advice: This is an educational tool. Backtest thoroughly and use a demo account before trading with real funds.
If you want me to generate a chart showing backtest performance for specific parameters or to tweak the script further (e.g., adding more indicators or adjusting signal logic), let me know!can you add clear buy ans sell signs above the candles in this codeTo add clear buy and sell signals above the candles in the provided Pine Script, I'll modify the existing code to include prominent text labels directly above (for sell signals) and below (for buy signals) the candles. These labels will be larger, color-coded, and positioned to avoid clutter, ensuring they are easily visible on the chart. The core strategy logic (EMA, RSI, MACD, Bollinger Bands, candlestick patterns, and volume filter) will remain unchanged, and I'll reuse the same artifact_id since this is an update to the previous script.AdvancedCryptoScalpingStrategy.pinex-pine

MTF FVG Confluence v6 — JSON Alerts via alert()This strategy combines multi-timeframe confluence with candlestick analysis and fair value gaps (FVGs) to generate structured long/short entries. It aligns Daily and 4H EMA trends with 1H MACD momentum, then confirms with engulfing candles and FVG zones for precision entries. Risk management is built-in, featuring stop-loss, 3R take-profit targets, and optional break-even logic, with dynamic JSON alerts for webhook automation.
Categories:
Candlestick analysis
Chart patterns
Cycles

dabilThe strategy is probably to go short or long with the trend depending on the case, but if all time units 1 minute then 3 minutes then 5 minutes then 15 minutes then 1 hour all show the same direction, but first the 1 hour must be bullish in which the 1 hour candle closes above the previous one, for example if the trend is bearish then the market wants to change direction, then a 1 hour bullish close must then be followed by a 1 hour bearish close below the bullish candle, then another bullish candle must shoot above the previous bullish candle, then 15 minutes also shoot above the previous 15 bullish candles, then 1 and 2...3.5. Then I can rise with the market by only covering the last 15 bullish candles with my stop loss, if my SL is 50 pips then I want 100 pips and then I'm out.
