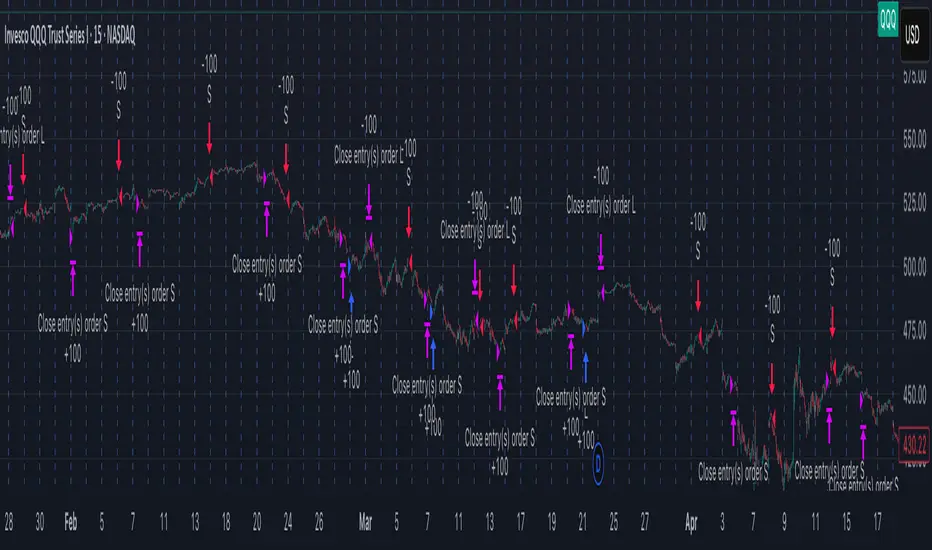
Composite PR Signal (Trend↔Revert + ADX gate)Core Components
1. Dynamic Inputs
Max/PR windows (maxLen, prWin) – define historical lookbacks for oscillators and percentile ranks.
Smoothing (smooth) – applies an EMA filter to stabilize composite scores.
Threshold (th) – governs entry sensitivity.
Holding period (hBars) – maximum bars allowed in a trade.
Execution options – allow shorting, fast approximations for PR and CCI.
2. Custom Utility Functions
The script implements optimized versions of common TA operations:
Rolling sums, delays, and moving averages (EMA, RMA, SMA).
Lazy rolling extrema (efficient highest/lowest lookups).
Stateful arrays for tracking oscillator values across bars.
Fast approximations for percentile ranks and indicators.
3. Indicators Used
The system calculates a broad set of oscillators, including:
Trend/Momentum: ROC, TRIX, TSI, MACD histogram, OBV ROC, AO, CMF, BOP, UO, ADX.
Reversion/Oscillators: RSI, Stochastic K/D, MFI, Williams %R, CCI, CMO.
Each is converted into a percentile rank (PR) to normalize values between 0–100.
4. Composite Scoring
Two composite signals are built:
Trend Score – averages normalized outputs of momentum indicators.
Reversion Score – averages normalized outputs of oscillators prone to mean reversion.
ADX Gate – when ADX PR is high, the strategy favors trend score; when low, it favors reversion score.
Final score is smoothed and compared against entry thresholds.
5. Trade Logic
Entry:
Long: When composite score crosses above +th.
Short: When composite score crosses below -th (if enabled).
Exit:
Opposite crossover signal.
Or trade duration exceeds hBars.
6. Risk/Execution Parameters
Initial capital: 100,000
Commission: 0.01% per trade
Fixed order size: 100 units
No pyramiding
Intended Use
This script is designed for:
Swing trading across multiple assets (equities, forex, crypto).
Adapting to market regimes — capturing breakouts during strong trends, but fading moves when markets are choppy.
Grafik Desenleri
EMA 8/33 Optimized Crossover w/FilterThis strategy is ideal for fast-moving assets like cryptocurrencies (e.g., SOLUSDT) on intraday to swing trading timeframes. Its robust filtering aims for fewer trades but with higher accuracy, producing a smoother equity curve and lower drawdown in your backtests.
You can further optimize the EMA lengths, minimum candle size, and TP/SL percentages to suit your preferred asset and timeframe.

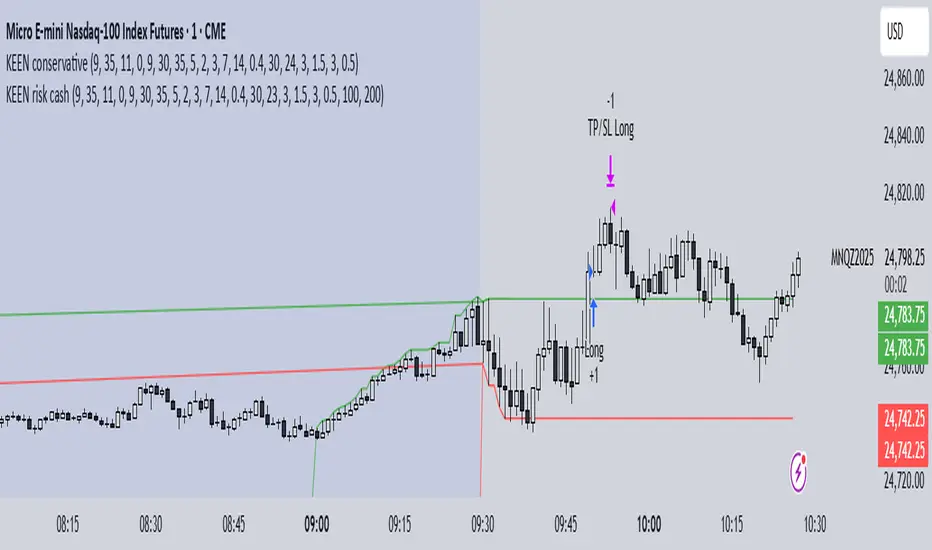
KEEN risk cashthis strategy is based on orb 5 minutes and is set off for risk per trade and take profit.
try yourself and let me know how it works
Triple Quad Frosty v4.5Triple Quad Frosty v4.5 is a Renko-friendly strategy that lets you trade from up to four signal sources per side. Orders are only placed when your chosen conditional filters (A/B/C) agree, giving you full control over when entries are valid. You decide how signals must line up — from simple single-source triggers to majority or full agreement across all four.
Renko-based, with customizable static stops, take profits, and trailing stops. Time/day filters, daily trade limits, and forced closures let you restrict trading to specific windows.
The HTF filters in Triple Quad Frosty v4.5 use a higher-timeframe Hull Moving Average (HMA) to confirm trend direction, while slope and distance settings on the local HMA help filter out weak or choppy setups. Longs only trigger when price is above the HTF HMA and meets slope/distance requirements, and shorts only when the opposite is true.
Color-coded labels mark each exit as a win or loss, with reversal trades labeled separately for clarity. Conditional bars plotted above and below the chart show when the A/B/C filters align on a long or short bias, giving clear visual confirmation of entry conditions. Stop loss and take profit levels are plotted directly on the chart with guide lines, so you can easily track active trade management in real time.

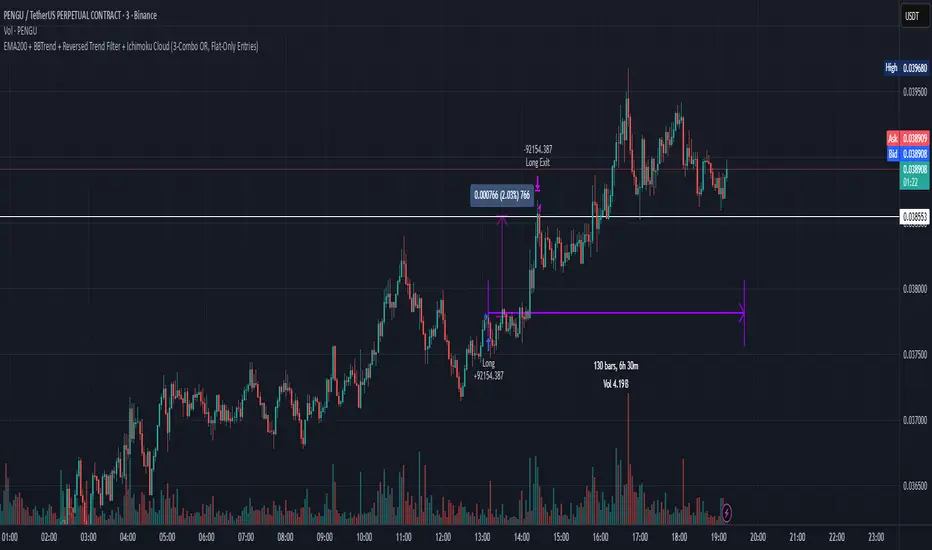
Marcels ComboMulti-timeframe trend + reversal strategy using EMA200, BBTrend, Ichimoku Cloud, and price pullbacks. Trades only when all filters align in any of 3 timeframe combos. Designed for disciplined, low-drawdown entries with fixed TP/SL and flat-only logic.
Ramen & OJ V1Ramen & OJ V1 — Strategy Overview
Ramen & OJ V1 is a mechanical price-action system built around two entry archetypes—Engulfing and Momentum—with trend gates, session controls, risk rails, and optional interval take-profits. It’s designed to behave the same way you’d trade it manually: wait for a qualified impulse, enter with discipline (optionally on a measured retracement), and manage the position with clear, rules-based exits.
Core Idea (What the engine does)
At its heart, the strategy looks for a decisive candle, then trades in alignment with your defined trend gates and flattens when that bias is no longer valid.
Entry Candle Type
Engulfing: The body of the current candle swallows the prior candle’s body (classic momentum shift).
Momentum: A simple directional body (close > open for longs, close < open for shorts).
Body Filter (lookback): Optional guard that requires the current body to be at least as large as the max body from the last N bars. This keeps you from chasing weak signals.
Primary MA (Entry/Exit Role):
Gate (optional): Require price to be above the Primary MA for longs / below for shorts.
Exit (always): Base exit occurs when price closes back across the Primary MA against your position.
Longs: qualifying bullish candle + pass all enabled filters.
Shorts: mirror logic.
Entries (Impulse vs. Pullback)
You choose how aggressive to be:
Market/Bars-Close Entry: Fire on the bar that confirms the signal (respecting filters and sessions).
Retracement Entry (optional): Instead of chasing the close, place a limit around a configurable % of the signal candle’s range (e.g., 50%). This buys the dip/sells the pop with structure, often improving average entry and risk.
Flip logic is handled: when an opposite, fully-qualified signal appears while in a position, the strategy closes first and then opens the new direction per rules.
Exits & Trade Management
Primary Exit: Price closing back across the Primary MA against your position.
Interval Take-Profit (optional):
Pre-Placed (native): Automatically lays out laddered limit targets every X ticks with OCO behavior. Each rung can carry its own stop (per-rung risk). Clean, broker-like behavior in backtests.
Manual (legacy): Closes slices as price steps through the ladder levels intrabar. Useful for platforms/brokers that need incremental closes rather than bracketed OCOs.
Per-Trade Stop: Choose ticks or dollars, and whether the $ stop is per position or per contract. When pre-placed TP is on, each rung uses a coordinated OCO stop; otherwise a single hard stop is attached.
Risk Rails (Session P&L Controls)
Session Soft Lock: When a session profit target or loss limit is hit, the strategy stops taking new trades but does not force-close open positions.
Session Hard Lock: On reaching your session P&L limit, all orders are canceled and the strategy flattens immediately. No new orders until the next session.
These rails help keep good days good and bad days survivable.
Filters & How They Work Together
1) Trend & Bias
Primary MA Gate (optional): Only long above / only short below. This keeps signals aligned with your primary bias.
Primary MA Slope Filter (optional): Require a minimum up/down slope (in degrees over a defined bar span). It’s a simple way to force impulse alignment—green light only when the MA is actually moving up for longs (or down for shorts).
Secondary MA Filter (optional): An additional trend gate (SMA/EMA, often a 200). Price must be on the correct side of this higher-timeframe proxy to trade. Great for avoiding countertrend picks.
How to combine:
Use Secondary MA as the “big picture” bias, Primary MA gate as your local regime check, and Slope to ensure momentum in that regime. That three-layer stack cuts a lot of chop.
2) Volatility/Exhaustion
CCI Dead Zone Filter (optional): Trades only when CCI is inside a specified band (default ±200). This avoids entries when price is extremely stretched; think of it as a no-chase rule.
TTM Squeeze Filter (optional): When enabled, the strategy avoids entries during a squeeze (Bollinger Bands inside Keltner Channels). You’re effectively waiting for the release, not the compression itself. This plays nicely with momentum entries and the slope gate.
How to combine:
If you want only the clean breaks, enable Slope + Squeeze; if you want structure but fewer chases, add CCI Dead Zone. You’ll filter out a lot of low-quality “wiggle” trades.
3) Time & Market Calendar
Sessions: Up to two session windows (America/Chicago by default), with background highlights.
Good-Till-Close (GTC): When ON, trades can close outside the session window; when OFF, all positions are flattened at session end and pending orders canceled.
Market-Day Filters: Skip US listed holidays and known non-full Globex days (e.g., Black Friday, certain eves). Cleaner logs and fewer backtest artifacts.
How to combine:
Run your A-setup window (e.g., cash open hour) with GTC ON if you want exits to obey system rules even after the window, or GTC OFF if you want the book flat at the bell, no exceptions.
Practical Profiles (mix-and-match presets)
Trend Rider: Primary MA gate ON, Slope filter ON, Secondary MA ON, Retracement ON (50%).
Goal: Only take momentum that’s already moving, buy the dip/sell the pop back into trend.
Structure-First Pullback: Primary MA gate ON, Secondary MA ON, CCI Dead Zone ON, Retracement 38–62%.
Goal: Filter extremes, use measured pullbacks for better R:R.
Break-Only Mode: Slope ON + Squeeze filter ON (avoid compression), Body filter ON with short lookback.
Goal: Only catch clean post-compression impulses.
Session Scalper: Tight session window, GTC OFF, Interval TP ON (small slices, short rungs), per-trade tick stop.
Goal: Quick hits in a well-defined window, always flat after.
Automation Notes
The system is built with intrabar awareness (calc_on_every_tick=true) and supports bracket-style behavior via pre-placed interval TP rungs. For webhook automation (e.g., TradersPost), keep chart(s) open and ensure alerts are tied to your order events or signal conditions as implemented in your alert templates. Always validate live routing with a small-size shakedown before scaling.
Tips, Caveats & Good Hygiene
Intrabar vs. Close: Backtests can fill intrabar where your broker might not. The pre-placed mode helps emulate OCO behavior but still depends on feed granularity.
Slippage & Fees: Set realistic slippage/commission in Strategy Properties to avoid fantasy equity curves.
Session Consistency: Use the correct timezone and verify that your broker’s session aligns with your chart session settings.
Don’t Over-stack Filters: More filters ≠ better performance. Start with trend gates, then add one volatility filter if needed.
Disclosure
This script is for educational purposes only and is not financial advice. Markets carry risk; only trade capital you can afford to lose. Test thoroughly on replay and paper before using any automated routing.
TL;DR
Identify a decisive candle → pass trend/vol filters → (optionally) pull back to a measured limit → scale out on pre-planned rungs → exit on Primary MA break or session rule. Clear, mechanical, repeatable.

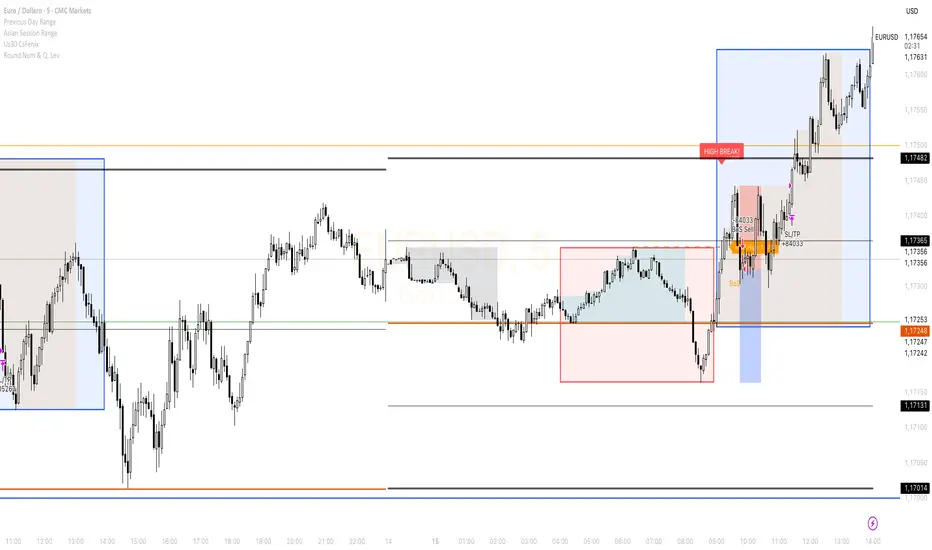
Cs Fenix Us30The price unbalances the Asia and Frankfurt range and if there is a structural change it highlights a possible entry with a stop and target level.
CoinGpt NQ策略# CoinGpt NQ 策略(MACD·多因子·可金字塔)
## 概述
**CoinGpt NQ策略**是一套面向 **纳指期货 NQ(建议:`CME_MINI:NQ1!`)30 分钟** 的可运行交易策略。
核心以 **MACD 趋势动量** 为骨架,叠加 **EMA 趋势过滤**、**可选金字塔加仓**、**三种出场模式(固定 TP/SL、追踪、追踪+TP)** 与 **风控上限**,提供三套一键预设(Balanced / Trend / Scalper),满足不同市场状态与风险偏好。
> 适配:期货/连续合约;仅做多(本脚本版本)。
> 时间框架:**30m**(可在“仅在 30m 生效”开关控制)。
---
## 进场逻辑
* **信号触发**:`MACD 上穿 Signal`(并要求直方图连续上升 2 根)。
* **趋势过滤**:价格位于 `EMA(p_emaLen)` 上方,且 `MACD>0 & Signal>0`(可关闭)。
* **时间框架限制**:默认仅在 30m 有效(可关闭)。
## 出场逻辑
* **固定 TP/SL**:按百分比计算限价止盈与止损。
* **追踪止盈**:默认以 **ATR 偏移** 跟踪;
* **追踪 + TP**:在拖尾的同时设置上沿 TP。
* **反向保护**:`MACD 下穿 Signal` 时市价平仓。
> 出场模式在输入项 **「出场模式」** 选择:
> `Auto(by preset) / Fixed TP/SL / Trailing / Trailing + TP`
---
## 金字塔加仓(可选)
* 仅在已有多单且不利回撤达到阈值时触发;
* 最多 `p_maxAdds` 层;每层在 **上次加仓价** 基础上按 `p_addStep%` 回撤触发;
* 目的:**拉低均价、提高持仓性价比**;采用小步长、有限层数控制回撤风险。
---
## 风险管理
* **当日最大亏损**:`strategy.risk.max_intraday_loss(p_maxDailyDD, %权益)`
* **单笔头寸上限**:`strategy.risk.max_position_size(p_posCapPct)`
* **订单量**(策略属性):默认 **90% 权益**。
* 实盘更建议:Balanced≈**40%**、Trend≈**35%**、Scalper≈**30%**(在“策略属性 → 订单大小”中调整)。
---
## 三套预设(参数一键生效)
| 预设 | MACD(fast/slow/signal) | 趋势EMA | 金字塔 | 加仓步长 | 固定TP/SL(%) | 追踪(ATR倍数) | 单笔上限 | 当日亏损 |
| ---------------- | ---------------------- | ----- | --- | ----- | ----------------- | --------- | ---- | ---- |
| **Balanced(默认)** | 8 / 21 / 5 | 233 | 2 层 | 0.12% | TP 0.22 / SL 0.15 | 1.2× | 50% | 1.5% |
| **Trend** | 10 / 24 / 7 | 200 | 3 层 | 0.10% | TP 0.25 / SL 0.18 | 1.6× | 45% | 1.2% |
| **Scalper** | 6 / 19 / 4 | 100 | 关闭 | —— | TP 0.18 / SL 0.12 | 1.3× | 35% | 1.0% |
> 说明:
>
> * Balanced:均衡型,适合多数时期;
> * Trend:顺势拉伸,持仓更久、盈亏比更高;
> * Scalper:快进快出、高胜率、不过度叠仓。
---
## 使用建议
1. **品种/周期**:`CME_MINI:NQ1!`(或当季主力合约),**30m**。
2. **手续费**:本策略默认 **1 USD/合约**(在“策略属性”可按实盘成本调整)。
3. **成交精度**:建议在“策略属性 → 高级设置”勾选 **Bar Magnifier**,提升限价/拖尾成交模拟精度。
4. **仓位**:策略默认 90% 仅为展示;回测与实盘更建议 **30%\~40% 权益**。
5. **风险**:金字塔仅做轻量、有限层数;若市场极端震荡,适当降低单笔上限与当日亏损阈值。
---
## 输入项(TradingView 右侧面板)
* **参数预设**:`Balanced / Trend / Scalper`
* **仅在 30m 周期生效**:开/关
* **出场模式**:`Auto(by preset) / Fixed TP/SL / Trailing / Trailing + TP`
> 其余细节参数由预设自动注入,无需手动繁杂调整,**开箱即用**。
---
## 注意事项
* 本脚本为研究与教育用途,不构成投资建议。期货与杠杆交易风险高,请在可承受范围内使用。
* 预设适配历史统计特征,未来表现不保证;建议结合自身风控与账户规模,先小仓/纸面验证。
* 仅做多版本;若需要双向(多空)或加入 RTH(美股盘中)/HTF(更高周期确认)等扩展,请在评论区留言。
---
**作者注**:
* 本策略在 Pine v6 编写,避免了常见的 v6 语法踩坑(如 `strategy.risk.max_position_size()` 仅 1 参、`plot` 标题需常量、追踪需成对参数 `trail_price + trail_offset` 等)。
* 欢迎在评论区反馈你的回测截图(区间、手续费、订单量),我会根据数据给出更贴合你的参数档。
# CoinGpt NQ Strategy (MACD · Multi-Factor · Optional Pyramiding)
## Overview
**CoinGpt NQ Strategy** is a ready-to-trade system for **Nasdaq-100 futures (NQ; recommended: `CME_MINI:NQ1!`) on the 30-minute timeframe**.
It uses **MACD momentum** as the backbone, adds an **EMA trend filter**, optional **pyramiding**, and **three exit modes** (Fixed TP/SL, Trailing, Trailing+TP) with built-in risk caps. Three one-click presets—**Balanced / Trend / Scalper**—cover different regimes and risk appetites.
> Instruments: futures / continuous contract
> Direction: **Long-only** (this script version)
> Timeframe: **30m** (toggleable)
---
## Entry
* **Trigger:** `MACD` line crossing **above** `Signal`.
* **Trend filter (optional):** price above `EMA(p_emaLen)` and `MACD > 0 & Signal > 0`.
* **Timeframe guard:** by default, signals are valid on **30m** only.
## Exit
* **Fixed TP/SL:** percentage-based limit and stop.
* **Trailing:** ATR-based trailing offset (or percent).
* **Trailing + TP:** trailing stop **and** a take-profit cap.
* **Protective flip:** when `MACD` crosses **below** `Signal`, close the long.
> Choose exit mode in **Inputs → “Exit Mode”**:
> `Auto(by preset) / Fixed TP/SL / Trailing / Trailing + TP`.
---
## Pyramiding (optional)
* Adds only **against adverse pullbacks** from the last add price.
* Up to `p_maxAdds` layers; each layer triggers at `p_addStep%` pullback from the **previous add**.
* Goal: **improve average price** with **small steps & limited layers** to keep drawdowns controlled.
---
## Risk Management
* **Daily loss cap:** `strategy.risk.max_intraday_loss(p_maxDailyDD, % of equity)`.
* **Per-trade size cap:** `strategy.risk.max_position_size(p_posCapPct)`.
* **Order size (strategy properties):** default **90% of equity** (for display).
* Practical suggestion: Balanced ≈ **40%**, Trend ≈ **35%**, Scalper ≈ **30%** (set in Strategy Properties → Order size).
---
## Presets (one-click)
| Preset | MACD (fast/slow/signal) | Trend EMA | Pyramiding | Add Step | Fixed TP/SL (%) | Trailing (ATR) | Pos Cap | Daily DD |
| ---------------------- | ----------------------- | --------- | ---------- | -------- | ------------------------- | -------------- | ------- | -------- |
| **Balanced (default)** | 8 / 21 / 5 | 233 | 2 layers | 0.12% | TP **0.22** / SL **0.15** | **1.2×** | **50%** | **1.5%** |
| **Trend** | 10 / 24 / 7 | 200 | 3 layers | 0.10% | TP **0.25** / SL **0.18** | **1.6×** | **45%** | **1.2%** |
| **Scalper** | 6 / 19 / 4 | 100 | Off | — | TP **0.18** / SL **0.12** | **1.3×** | **35%** | **1.0%** |
> **Balanced:** all-weather, stable.
> **Trend:** holds longer and targets higher R multiples.
> **Scalper:** quick in/out, higher hit-rate, no stacking.
---
## Usage Tips
1. **Symbol/TF:** `CME_MINI:NQ1!`, **30m**.
2. **Fees:** default **\$1 per contract** (adjust to your broker in Strategy Properties).
3. **Execution realism:** enable **Bar Magnifier** (Strategy Properties → Advanced) for more accurate limit/trailing fills.
4. **Sizing:** the script defaults to 90% only to showcase behavior—use **30–40%** in realistic tests.
5. **Pyramiding:** keep layers small & capped. In choppy regimes, reduce `p_posCapPct` and `p_maxDailyDD`.
---
## Inputs (right-panel)
* **Param Preset:** `Balanced / Trend / Scalper`
* **30m-only:** on/off
* **Exit Mode:** `Auto(by preset) / Fixed TP/SL / Trailing / Trailing + TP`
> All other parameters are pre-wired by the chosen preset for **plug-and-play** operation.
---
## Notes & Disclaimer
* Educational use only—**not** financial advice. Futures and leverage carry substantial risk.
* Presets reflect historical characteristics; **future performance is not guaranteed**. Start small or paper trade first.
* This version is **long-only**; if you need a two-sided (long & short) variant or extras (RTH/HTF filters), leave a comment.
---
**Author Notes**
* Written in **Pine v6** with common pitfalls avoided (e.g., `strategy.risk.max_position_size()` takes **one** arg, `plot` titles are **const strings**, trailing requires `trail_price + trail_offset`).
* Share your backtest screenshots (period, fees, order size) and I can suggest **tighter, data-driven knobs** for your setup.

Swing H/L with EMAIndicator uses pivot points to mark swing highs (LH/HH) and swing lows (HL/LL),this strategy detects swing structure (HH/LL) and confirms them with EMA crossovers where a ❤︎ symbol will be added above swing H and below swing L.
A Buy signal is generated after the Last H is broken and a bullish signal appears. When the condition is met, the indicator will place a label ‘B’.
A Sell signal is generated after the Last L is broken and a bearish signal appears. When the condition is met, the indicator will place a label ‘S’.
Buy or Sell signals will be recalculated each time when H or L is broken.

BSL/SSL Sweep + FVG Strategy Jobin (c) The New York ATM Model is a structured intraday strategy designed to capture algorithmic stop-hunts and reversals during the New York session open. It focuses on liquidity sweeps—either Buy-Side or Sell-Side—followed by a confirmation using Fair Value Gaps (FVGs).

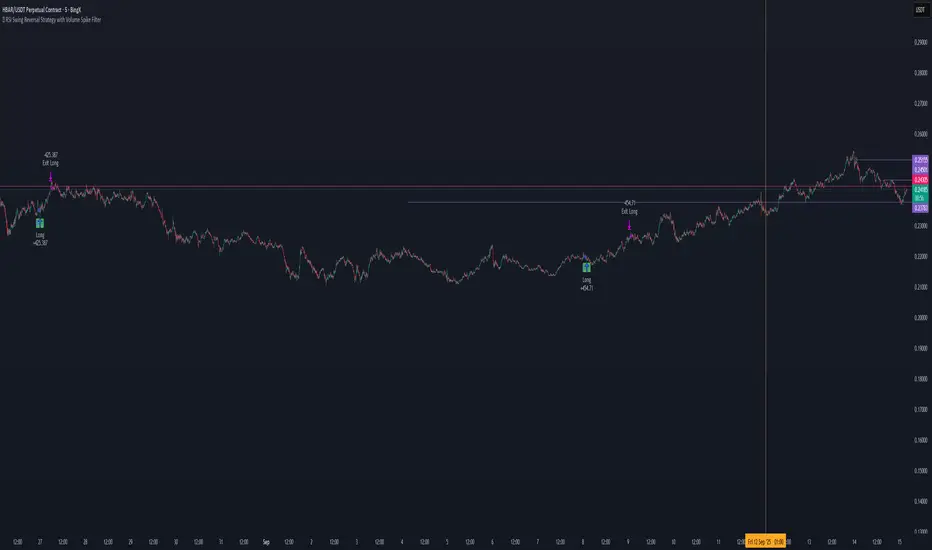
📊 RSI Swing Reversal Strategy with Volume Spike FilterHi , i did test that on Hbar time frame 5min. please let me know if i did miss something .85% win rate. please get back test.
What Will This Strategy Do?
Use RSI cross over/under its MA + Swing High/Low + optional Trend Filter.
Enter long on bullish signals.
Enter short on bearish signals.
Exit on opposite signals or optional take-profit/stop-loss.
Killzones SMT + IFVG detectorKillzones SMT + IFVG Detector
Summary
This strategy implements a specific intraday workflow inspired by ICT-style concepts.
It combines:
Killzone session levels (recording untouched highs/lows)
SMT divergence between NQ and ES (exclusive sweep logic)
IFVG confirmation (3-bar imbalance + width filter + inversion guard)
and an optional smart exit engine
The components are not simply mashed together: they interact in sequence.
A setup only confirms if all conditions line up (time window → untouched level sweep → divergence → valid IFVG → confirmation candle → risk filter).
Workflow
Killzones & session levels
Tracks highs/lows inside default killzones (19:00–23:00, 01:00–04:00, 08:30–10:00, 11:00–12:00, 12:30–15:00, chart timezone).
Stores untouched levels forward; sweeps trigger candidate signals.
SMT divergence (exclusive sweep)
Bullish SMT : one index sweeps its low while the other remains above its session low.
Bearish SMT : one index sweeps its high while the other remains below its session high.
Detection supports “Sweep (Cross)” or “Exact Tick.”
Session IDs are tracked so once a side has fired, later re-touches can’t re-trigger .
IFVG confirmation
Locks the first valid 3-bar IFVG after SMT.
Confirmation requires a candle close beyond the IFVG boundary in the direction of the close.
IFVGs must meet a minimum width filter (default 1.0 point).
Inversion guard: ignores IFVGs already inverted before SMT.
Optional “re-lock” keeps tracking the latest IFVG until confirmation/expiry.
Smart exit engine
Initial stop from opposite wick (+ buffer).
Fixed TP (default 40 points).
Dynamic stop escalation at progress thresholds (BE → 50% → 80% of target).
Safety gates
Weekend lockout (Fri 16:40 → Sun 18:00).
Same-bar sweep of high & low cancels setups.
Max initial stop filter skips oversized setups.
Optional cooldown bars.
Alerts
SMT Bullish/Bearish : divergence detected this bar.
Confirm Long/Short : IFVG confirmation triggered.
Default Strategy Properties (used in screenshots/backtests)
Initial capital: $25,000
Order size: 1 contract
Commission: $1.25 per contract per side
Slippage: 2 ticks
Backtest window: Jun 16, 2025 – Sep 14, 2025
These settings are intentionally conservative. If you change them, your results will differ.
How to use
Apply on an NQ or ES futures chart (1–5 min).
Choose your killzones and detection mode.
Select confirmation symbol (NQ, ES, or “Sweeper”).
Enable/disable IFVG re-lock.
Review signals and use alerts for automation if desired.
Limitations
Strict filters reduce trade count; extend backtest window for more samples.
Works best on NQ/ES; not validated elsewhere.
Past performance is not indicative of future results.
This is an educational tool ; not financial advice.

RSI DCA StrategyThis strategy combines RSI oversold signals with a Dollar-Cost Averaging (DCA) buying approach.
Trigger:
When the RSI (Relative Strength Index) crosses below 30, the strategy marks an oversold condition.
DCA Entry:
Once triggered, the strategy executes up to three consecutive daily entries (1 per day), splitting the predefined capital equally (configurable by user).
Position Management:
Take Profit at a configurable % above the average entry price.
Stop Loss at a configurable % below the average entry price.
Exit Conditions:
The strategy automatically exits either on reaching Take Profit or Stop Loss.
Visualization:
RSI plotted with oversold line (30).
Take Profit and Stop Loss lines displayed after entry.
Performance Reporting:
Includes an optional monthly performance table for evaluating results by month.
Note:
This strategy is for testing RSI-based mean reversion with staggered entries. It is not financial advice and should be optimized and validated for each market or timeframe before practical use.

Hilly's 0010110 Reversal Scalping Strategy - 5 Min CandlesKey Features and Rationale:
Timeframe: Restricted to 5-minute candles as requested.
Pattern Integration: Includes single (Hammer, Shooting Star, Doji), two (Engulfing, Harami), and three-plus (Morning Star, Evening Star) candlestick patterns, plus reversal patterns based on RSI extremes.
VWAP Cross: Incorporates bullish (price crosses above VWAP) and bearish (price crosses below VWAP) signals, enhanced by trend context.
Volume Analysis: Uses a volume spike threshold to filter noise, with a simple day-start volume comparison for financial environment context.
Financial Environment: Approximates the day's sentiment using early-hour volume compared to current volume, adjusted by trend.
Aggregation: Scores each condition (e.g., 1 for basic patterns, 2 for strong patterns like Engulfing, 3 for three-candle patterns) and decides based on weighted consensus, with trendStrength as a tunable threshold.
Risky Approach: Minimal filtering and a low trendStrength (default 0.5) allow frequent signals, aligning with your $100-to-$200 goal, but expect higher risk.
Suggested Inputs:
EMA Length: 10 (short enough for 5-minute sensitivity).
VWAP Lookback: 1 (uses current session VWAP).
Volume Threshold Multiplier: 1.2 (moderate spike requirement).
RSI Length: 14 (standard, adjustable to 7 for more sensitivity).
Trend Strength Threshold: 0.5 (balance between signals; lower to 0.4 for more trades, raise to 0.6 for fewer).


Small-Cap — Sell Every Spike (Rendon1) Small-Cap — Sell Every Spike v6 — Strict, No Look-Ahead
Educational use only. This is not financial advice or a signal service.
This strategy targets low/ mid-float runners (≤ ~20M) that make parabolic spikes. It shorts qualified spikes and scales out into flushes. Logic is deliberately simple and transparent to avoid curve-fit.
What the strategy does
Detects a parabolic up move using:
Fast ROC over N bars
Big range vs ATR
Volume spike vs SMA
Fresh higher high (no stale spikes)
Enters short at bar close when conditions are met (no same-bar fills).
Manages exits with ATR targets and optional % covers.
Tracks float rotation intraday (manual float input) and blocks trades above a hard limit.
Draws daily spike-high resistance from confirmed daily bars (no repaint / no look-ahead).
Timeframes & market
Designed for 1–5 minute charts.
Intended for US small-caps; turn Premarket on.
Works intraday; avoid illiquid tickers or names with constant halts.
Entry, Exit, Risk (short side)
Entry: parabolic spike (ROC + Range≥ATR×K + Vol≥SMA×K, new HH).
Optional confirmations (OFF by default to “sell every spike”): upper-wick and VWAP cross-down.
Stop: ATR stop above entry (default 1.2× ATR).
Targets: TP1 = 1.0× ATR, TP2 = 2.0× ATR + optional 10/20/30% covers.
Safety: skip trades if RVOL is low or Float Rotation exceeds your limit (default warn 5×, hard 7×).
Inputs (Balanced defaults)
Price band: $2–$10
Float Shares: set per ticker (from Finviz).
RVOL(50) ≥ 1.5×
ROC(5) ≥ 1.0%, Range ≥ 1.6× ATR, Vol ≥ 1.8× SMA
Cooldown: 10 bars; Max trades/day: 6
Optional: Require wick (≥35%) and/or Require VWAP cross-down.
Presets suggestion:
• Balanced (defaults above)
• Safer: wick+VWAP ON, Range≥1.8×, trades/day 3–4
• Micro-float (<5M): ROC 1.4–1.8%, Range≥1.9–2.2×, Vol≥2.2×, RVOL≥2.0, wick 40–50%
No look-ahead / repaint notes
Daily spike-highs use request.security(..., lookahead_off) and shifted → only closed daily bars.
Orders arm next bar after entry; entries execute at bar close.
VWAP/ATR/ROC/Vol/RVOL are computed on the chart timeframe (no HTF peeking).
How to use
Build a watchlist: Float <20M, RelVol >2, Today +20% (Finviz).
Open 1–5m chart, enter Float Shares for the ticker.
Start with Balanced, flip to Safer on halty/SSR names or repeated VWAP reclaims.
Scale out into flushes; respect the stop and rotation guard.
Limitations & risk
Backtests on small-caps can be optimistic due to slippage, spreads, halts, SSR, and limited premarket data. Always use conservative sizing. Low-float stocks can squeeze violently.
Alerts
Parabolic UP (candidate short)
SHORT Armed (conditions met; entry at bar close)

MOONA130925-2305bThe Martingale strategy in crypto trading involves doubling trade size after each loss, aiming to recover losses with one win and secure a small profit. While potentially effective short-term, it carries high risk, as consecutive losses can rapidly exhaust capital, making it unsustainable without strict risk management.
Use Below Settings for Best Results.
5Min or 15 Min
EMA 20
EMA 45
EMA 200
Keep Enable EMA on Entry- ON
Length 1- 45
Length 2- 200
Set Target 3% (Untick all Except T1)
Set SL 1.5%

2 of 3 Confluence StrategyA strategy created for swing and positional trading on stocks and index. Best to use on daily or minimum hourly time frame. It will also work in smaller time frames but there will be some noise.

New Rate - PREMIUM v2New Rate – Premium
Overview
New Rate – Premium is a breakout strategy built around a strict “one trade per day” rule. It forms an intraday range from the first N candles, freezes High/Low at the close of candle N, and places OCO stop orders exactly on those levels. The first breakout fills and the opposite order is canceled. Exits can be managed by fixed ticks or by risk/reward (RR). The script draws SL/TP boxes, keeps entry labels at a fixed distance from price, and lets you restrict trading to selected weekdays.
How it works
Window & count: set timeframe, session start, and N candles. Those candles are highlighted and used to compute the range High/Low.
Freeze: when candle N closes, the strategy locks High/Low and draws the lines; a 50% midline is optional.
OCO placement: buy-stop on High and sell-stop on Low (one-cancels-other). The first fill cancels the other side.
Exits:
– Ticks mode: SL/TP are fixed distances in ticks from entry.
– RR mode: SL at the opposite side of the range; TP = RR × risk.
Visual SL/TP boxes are drawn in both modes.
Daily lock: after the first fill, no more entries for that day.
Key features
First break only, one trade per day: hard discipline that avoids over-trading.
Automatic range end: timeframe × N candles (or manual end time).
Exact “at-the-break” entries: stop orders placed at frozen High/Low.
Flexible exits: fixed ticks or RR with opposite-side stop.
Clean visuals: High/Low and midline with configurable color/style/width; text alignment (left/center/right); session background with opacity.
SL/TP boxes: configurable colors, borders, width, and forward projection.
Entry labels with constant offset: “BUY” below bar, “SELL” above bar; distance in ticks so labels never sit on price.
Weekday filter: trade only the days you select (Mon–Fri).
Inputs (summary)
• Session & range: timeframe (minutes), start time, N candles, auto end (TF × N) or manual, line extension.
• Style: High/Low colors, styles, widths; midline on/off; label position; session background color and opacity.
• Exits: RR using the opposite extreme as SL, or “Use SL/TP by ticks”.
• SL/TP boxes: projection bars, SL color, TP color, border color and width, box limit.
• Weekdays: Monday–Friday selectors.
• Entry labels: show/hide, colors, size, vertical offset in ticks, optional X shift in bars.
Backtest snapshot — FX:XAUUSD 30m
Range: 02 Jan 2024 00:00 → 12 Sep 2025 12:00 • Symbol/TF: FX:XAUUSD / 30m
• Net Profit: $1,599.77
• Gross Profit / Gross Loss: $3,929.47 / $2,329.70
• Max Drawdown: $112.73 (4.93%)
• Total Trades / Win rate: 440 / 48.41%
• Avg Trade: $3.64 (0.04%); Avg Winner / Avg Loser: $18.45 / $10.26
• Profit Factor / Sharpe / Sortino: 1.687 / 1.163 / 6.876
• Largest Win / Loss: $91.94 / $10.26
• Avg Bars in Trade: 1 (long), 2 (short)
Why this strategy is original
First-bar breakout accuracy: orders arm exactly when the N-th candle closes, so the very next bar can fill at the true break. This avoids the common ORB miss where the first post-range bar is skipped by delayed checks or market orders.
OCO + daily lock as a core mechanic: the engine enforces one-and-done behavior—no soft rules, no hidden retries—so test results match live logic.
Two exit frameworks, one visual language: switch seamlessly between fixed-tick and structural RR exits while managing both with the same SL/TP boxes for consistent analysis and education.
Readability by design: label offset, aligned High/Low text, and tunable session background keep charts uncluttered during long optimizations or multi-asset reviews.
Operational guardrails: drawing budgets, box limits, and weekday filters are integrated so backtests remain stable and realistic with trading hours.
Focused ORB specialization: no oscillators, no hidden bias—transparent, testable, and purpose-built for the opening-range dynamic you configure.
Recommended use
• Session openings or early windows with a single, clean decision per day.
• Strict rules with exact entry levels and auditable exits.
• Benchmarking exits in both ticks and RR with apples-to-apples visuals.
Default strategy properties
• Initial capital: 10,000 USD; position sizing by % of equity (editable).
• Commissions default to 0% and slippage to 0; edit to match your broker/market.
• Drawing limits tuned to respect TradingView resource caps.
Best practices & compliance
• Educational use. Not financial advice.
• Past performance does not guarantee future results.
• Adjust slippage, commissions, and position sizing to your live context.
• Original implementation with documented mechanics; compliant with TradingView House Rules.
Example setup
TF 5m, start 08:00, N = 6 → auto end at 08:30
RR = 2 with SL at the opposite side of the range
Boxes: projection 10 bars; SL #9598a1; TP #ffbe1a; border #787B86; opacity 70
Days: Tuesday and Wednesday only
Labels: “BUY” below and “SELL” above, 10-tick offset
Glossary
• Opening range breakout (ORB): breakout of the configured initial range.
• One-cancels-other (OCO): filling one order cancels the other.
• Risk/reward (RR): target equals RR × risk distance.
• Tick: minimum price increment.
• Offset: fixed label separation from the bar extremum.

Range Breakout StrategyAfter consecutive candle closes it creates a range, and if price breaks out of it it enters with fixed take profit.

QZ Trend (Crypto Edition) v1.1a: Donchian, EMA, ATR, Liquidity/FThe "QZ Trend (Crypto Edition)" is a rules-based trend-following breakout strategy for crypto spot or perpetual contracts, focusing on following trends, prioritizing risk control, seeking small losses and big wins, and trading only when advantageous.
Key mechanisms include:
- Market filters: Screen favorable conditions via ADX (trend strength), dollar volume (liquidity), funding fee windows, session/weekend restrictions, and spot-long-only settings.
- Signals & entries: Based on price position relative to EMA and EMA trends, combined with breaking Donchian channel extremes (with ATR ratio confirmation), plus single-position rules and post-exit cooldowns.
- Position sizing: Calculate positions by fixed risk percentage; initial stop-loss is ATR-based, complying with exchange min/max lot requirements.
- Exits & risk management: Include initial stop-loss, trailing stop (tightens only), break-even rule (stop moves to entry when target floating profit is hit), time-based exit, and post-exit cooldowns.
- Pyramiding: Add positions only when profitable with favorable momentum, requiring ATR-based spacing; add size is a fraction of the base position, with layers sharing stop logic but having unique order IDs.
Charts display EMA, Donchian channels, current stop lines, and highlight low ADX, avoidable funding windows, and low-liquidity periods.
Recommend starting with 4H or 1D timeframes, with typical parameters varying by cycle. Liquidity settings differ by token; perpetuals should enable funding window filters, while spot requires "long-only" and matching fees. The strategy performs well in trends with quick stop-losses but faces whipsaws in ranges (filters mitigate but don’t eliminate noise). Share your symbol and timeframe for tailored parameters.

Hilly's Reversal Scalping Strategy - 5 Min CandlesHow to Use
Copy the Code: Copy the script above.
Paste in TradingView: Open TradingView, go to the Pine Editor (bottom of the chart), paste the code, and click “Add to Chart.”
Set Timeframe: Ensure the chart is set to 5-minute candles (TradingView: right-click chart > Timeframe > 5 Minutes).
Check for Errors: Verify no errors appear in the Pine Editor console.
Apply to Chart: Use a liquid crypto pair (e.g., BTC/USDT, ETH/USDT on Binance or Coinbase).
Verify Signals:
Green “BUY” labels and triangle-up arrows for bullish reversals (e.g., bullish engulfing, hammer, doji, morning star, three white soldiers, double bottom in a downtrend).
Red “SELL” labels and triangle-down arrows for bearish reversals (e.g., bearish engulfing, shooting star, doji, evening star, three black crows, double top in an uptrend).
Green/red background highlights for signal candles.
Backtest: Use TradingView’s Strategy Tester to evaluate performance over 1–3 months, checking Net Profit, Win Rate, and Drawdown.
Demo Test: Run on a demo account to confirm signal visibility and performance before trading with real funds.
Troubleshooting
If Errors Occur: If any errors appear in TradingView’s Pine Editor console (e.g., “Syntax error” or “Invalid argument”), please share the exact error messages to diagnose environment-specific issues.
Signal Overload: If too many signals appear, increase patternLookback to 15 or set volFilter = volume > volMa * 2.0.
Missed Signals: If signals are too rare, set useVolumeFilter=false or reduce patternLookback to 5.
Additional Features: If you need alerts, other indicators (e.g., EMA, RSI), or dynamic arrow sizing, please specify. Note that dynamic sizing caused errors previously, so I’ve kept size=size.normal.

Hilly 3.0 Advanced Crypto Scalping Strategy - 1 & 5 Min ChartsHow to Use
Copy the Code: Copy the script above.
Paste in TradingView: Open TradingView, go to the Pine Editor (bottom of the chart), paste the code, and click “Add to Chart.”
Check for Errors: Verify no errors appear in the Pine Editor console. The script uses Pine Script v5 (@version=5).
Select Timeframe:
1-Minute Chart: Use defaults (emaFastLen=7, emaSlowLen=14, rsiLen=10, rsiOverbought=80, rsiOversold=20, slPerc=0.5, tpPerc=1.0, useCandlePatterns=false, patternLookback=10).
5-Minute Chart: Adjust to emaFastLen=9, emaSlowLen=21, rsiLen=14, rsiOverbought=75, rsiOversold=25, slPerc=0.8, tpPerc=1.5, useCandlePatterns=true, patternLookback=10.
Apply to Chart: Use a liquid crypto pair (e.g., BTC/USDT, ETH/USDT on Binance or Coinbase).
Verify Signals:
Green “BUY” or “EMA BUY” labels and triangle-up arrows below candles for bullish signals (EMA crossovers, bullish engulfing, hammer, doji, morning star, three white soldiers, double bottom).
Red “SELL” or “EMA SELL” labels and triangle-down arrows above candles for bearish signals (EMA crossovers, bearish engulfing, shooting star, doji, evening star, three black crows, double top).
Green/red background highlights for signal candles.
Backtest: Use TradingView’s Strategy Tester to evaluate performance over 1–3 months, checking Net Profit, Win Rate, and Drawdown.
Demo Test: Run on a demo account to confirm signal visibility and performance before trading with real funds.
