Momentum Velocity [BackQuant]Momentum Velocity
Main Features:
- Momentum Based Oscillator
- Divergences
- Overbought and Oversold Conditions based off a VZO
- Alert Conditions
- Ability to make Adaptive
- Big User input menu for customisation
The Momentum Velocity indicator is based on the principle of momentum , which is a measure of the rate of change or the speed at which prices move over a specified time period. The underlying assumption of momentum trading is that assets that have performed well in the recent past will continue to perform well in the near future, and conversely, assets that have performed poorly will continue to perform poorly. This concept is widely accepted and empirically supported in financial literature, making the Momentum Velocity indicator empirically sound for several reasons:
Empirical Evidence on Momentum
Academic Research: A foundational piece of research that supports the momentum strategy is Jegadeesh and Titman's study, "Returns to Buying Winners and Selling Losers: Implications for Stock Market Efficiency," published in the Journal of Finance in 1993. The authors find that strategies which buy stocks that have performed well in the past and sell stocks that have performed poorly generate significantly higher than expected returns over 3- to 12-month holding periods. This study is one of many that empirically validate the momentum effect in stock returns.
Behavioural Finance Theories:
Behavioural finance provides explanations for the momentum effect that go beyond the efficient market hypothesis. Theories such as investor herding, overreaction and under reaction to news, and the disposition effect can cause price trends to continue. The momentum strategy exploits these behavioural biases by assuming that prices will continue to move in their current direction for some time.
Global Evidence:
The momentum effect is not limited to specific markets or asset classes. Studies have documented momentum profits across various countries, markets, and asset types (stocks, bonds, commodities, and currencies). For instance, Asness, Moskowitz, and Pedersen in their paper, "Value and Momentum Everywhere," published in the Journal of Finance in 2013, show that momentum strategies can yield positive returns in different international markets.
Risk Factors:
Some researchers argue that the returns to momentum strategies are compensation for bearing certain risks. However, the empirical evidence suggests that momentum returns are difficult to explain by traditional risk factors alone, adding to the strategy’s attractiveness. The factor model of Carhart (1997), which adds a momentum factor to the Fama and French three-factor model, highlights the importance of momentum as a distinct source of returns.
Empirical Evidence Application
The Momentum Velocity indicator applies these empirical insights by quantitatively measuring the speed and direction of price movements over a given period, adjusting for recent market conditions through adaptive filtering, and normalizing the results to identify potential trading signals. By doing so, it provides traders with a tool that not only captures the essence of the momentum anomaly but also enhances it with modern technical analysis techniques for real-time market application.
Trading Application
Due to the robustness of momentum, traders are able to use this as a confluence metric into their system on any timeframe. Providing robust signals, that by extention are adaptive to the market. This is also further enabled by using adaptive filtering.
Conclusion
In summary, the empirical soundness of the Momentum Velocity indicator is grounded in the well-documented momentum effect observed in financial markets. By leveraging historical price data to predict future price movements, it aligns with both academic research and observed market behavior, making it a potentially valuable tool for traders seeking to exploit momentum-based trading opportunities.
User Inputs:
Calculation Source: Choose the price component (e.g., close) to base calculations on.
Lookback Period: Define the period over which momentum and normalization are calculated.
Use Adaptive Filtering?: Toggle the use of DEMA for more responsive momentum calculation.
Adaptive Lookback Period: Set the period for the adaptive filter when enabled.
Show Momentum Moving Average?: Option to display a moving average of the plotosc for trend smoothing.
MA Period: Specify the period for the momentum moving average.
Show Static High and Low Levels: Display predefined levels indicating extreme momentum thresholds.
Color Bars According to Trend?: Color price bars based on the momentum direction for quick visual reference.
Show Overbought and Oversold Signals: Highlight extreme volume conditions as potential buy/sell signals.
Signal Calculation Period: Set the period for calculating volume-based signals.
Show Detected Divergences?: Enable or disable the visualization of bullish and bearish divergences.
How it can be used in the context of a Trading System
Momentum and momentum divergences are pivotal concepts in trading systems, offering traders insights into the strength and potential reversal points of market trends. Momentum, a measure of the rate of price changes, helps traders identify the velocity of market movements, allowing them to ride the wave of prevailing trends for profits. When momentum divergences occur—where price movement and momentum indicators move in opposite directions—they signal a weakening of the current trend and potential for reversal. Traders can use these signals to adjust their positions, entering or exiting trades based on the anticipation of trend changes. Incorporating momentum and its divergences into a trading system provides a dynamic strategy that leverages the market's natural cycles of trend strength and exhaustion, aiming to capitalize on both continuation and reversal opportunities for enhanced trading outcomes.
We have also added a volume based component for traders to use as a point of confluence. It is shown on the chart giving background hues for overbought and oversold signals.
Thus following all of the key points here are some sample backtests on the 1D Chart
Disclaimer: Backtests are based off past results, and are not indicative of the future.
INDEX:BTCUSD
INDEX:ETHUSD
BINANCE:SOLUSD
Ortalanmış Osilatörler
CAPACE MARKETThis custom indicator combines the Moving Average Convergence Divergence (MACD) and the Relative Strength Index (RSI) into a single trading tool. It calculates the MACD and RSI values, then averages these two indicators to create a composite line. This average line is intended to capture the momentum and relative strength of the market simultaneously, potentially offering a more nuanced view of market conditions.
Key features of the indicator include:
Visualization of MACD and RSI Lines: It plots the MACD and RSI values as separate lines on the chart, allowing traders to see the behavior of each indicator clearly.
Average Line: A line representing the average of the MACD and RSI indicators is plotted, providing a synthesized view of both momentum and strength.
Entry Points Indication: The indicator uses red dots to mark the points where the average line crosses over or under the MACD or RSI lines. These intersections are meant to signal potential entry points for traders.
Market Condition Highlighting: The background color changes based on whether the average line is above or below zero. A green background suggests a positive market condition (bullish), while a red background indicates a negative market condition (bearish).
This tool aims to offer traders an integrated perspective by combining the insights of both MACD and RSI, potentially aiding in the identification of entry and exit points as well as the overall market sentiment.

Divergence Toolkit (Real-Time)The Divergence Toolkit is designed to automatically detect divergences between the price of an underlying asset and any other @TradingView built-in or community-built indicator or script. This algorithm provides a comprehensive solution for identifying both regular and hidden divergences, empowering traders with valuable insights into potential trend reversals.
🔲 Methodology
Divergences occur when there is a disagreement between the price action of an asset and the corresponding indicator. Let's review the conditions for regular and hidden divergences.
Regular divergences indicate a potential reversal in the current trend.
Regular Bullish Divergence
Price Action - Forms a lower low.
Indicator - Forms a higher low.
Interpretation - Suggests that while the price is making new lows, the indicator is showing increasing strength, signaling a potential upward reversal.
Regular Bearish Divergence
Price Action - Forms a higher high.
Indicator - Forms a lower high.
Interpretation - Indicates that despite the price making new highs, the indicator is weakening, hinting at a potential downward reversal.
Hidden divergences indicate a potential continuation of the existing trend.
Hidden Bullish Divergence
Price Action - Forms a higher low.
Indicator - Forms a lower low.
Interpretation - Suggests that even though the price is retracing, the indicator shows increasing strength, indicating a potential continuation of the upward trend.
Hidden Bearish Divergence
Price Action - Forms a lower high.
Indicator - Forms a higher high.
Interpretation - Indicates that despite a retracement in price, the indicator is still strong, signaling a potential continuation of the downward trend.
In both regular and hidden divergences, the key is to observe the relationship between the price action and the indicator. Divergences can provide valuable insights into potential trend reversals or continuations.
The methodology employed in this script involves the detection of divergences through conditional price levels rather than relying on detected pivots. Traditionally, divergences are created by identifying pivots in both the underlying asset and the oscillator. However, this script employs a trailing stop on the oscillator to detect potential swings, providing a real-time approach to identifying divergences, you may find more info about it here (SuperTrend Toolkit) . We detect swings or pivots simply by testing for crosses between the indicator and its trailing stop.
type oscillator
float o = Oscillator Value
float s = Trailing Stop Value
oscillator osc = oscillator.new()
bool l = ta.crossunder(osc.o, osc.s) => Utilized as a formed high
bool h = ta.crossover (osc.o, osc.s) => Utilized as a formed low
// Note: these conditions alone could cause repainting when they are met but canceled at a later time before the bar closes. Hence, we wait for a confirmed bar.
// The script also includes the option to immediately alert when the conditions are met, if you choose so.
By testing for conditional price levels, the script achieves similar outcomes without the delays associated with pivot-based methods.
type bar
float o = open
float h = high
float l = low
float c = close
bar b = bar.new()
bool hi = b.h < b.h => A higher price level has been created
bool lo = b.l > b.l => A lower price level has been created
// Note: These conditions do not check for certain price swings hence they may seldom result in inaccurate detection.
🔲 Setup Guide
A simple example on one of my public scripts, Standardized MACD
🔲 Utility
We may auto-detect divergences to spot trend reversals & continuations.
🔲 Settings
Source - Choose an oscillator source of which to base the Toolkit on.
Zeroing - The Mid-Line value of the oscillator, for example RSI & MFI use 50.
Sensitivity - Calibrates the sensitivity of which Divergencies are detected, higher values result in more detections but less accuracy.
Lifetime - Maximum timespan to detect a Divergence.
Repaint - Switched on, the script will trigger Divergencies as they happen in Real-Time, could cause repainting when the conditions are met but canceled at a later time before bar closes.
🔲 Alerts
Bearish Divergence
Bullish Divergence
Bearish Hidden Divergence
Bullish Hidden Divergence
As well as the option to trigger 'any alert' call.
The Divergence Toolkit provides traders with a dynamic tool for spotting potential trend reversals and continuations. Its innovative approach to real-time divergence detection enhances the timeliness of identifying market opportunities.

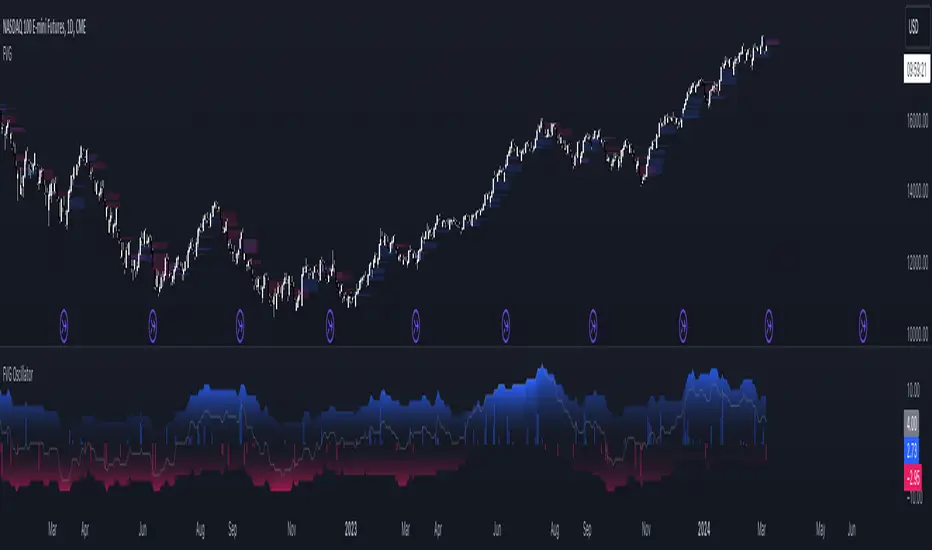
FVG OscillatorThe FVG Oscillator, developed by OmegaTools and available on TradingView, is a specialized analytical tool designed to offer traders insight into the market's potential direction through the lens of Fair Value Gaps (FVGs). This script combines traditional oscillator functionality with a unique focus on FVGs, providing a nuanced approach to understanding market dynamics.
Understanding FVGs and Their Importance:
Fair Value Gaps (FVGs) are identified when there's a discrepancy between the high price of one session and the low of the subsequent session (or vice versa), indicating areas where price movements have skipped over, creating a gap. These gaps often signal potential price movement areas, as markets may move to "fill" these gaps. The FVG Oscillator is designed to quantify these occurrences and their potential impact on market direction.
Key Features of the FVG Oscillator:
- Adjustable Lookback Period: Traders can set the number of bars back (defaulted at 50) to adjust the sensitivity of the oscillator to recent market activity.
- Visual Area Representation: The option to display areas of positive and negative FVG occurrences provides a visual representation of market sentiment over the selected period.
- Color Customisation: Users can personalize the oscillator's appearance with color selections for positive and negative movements, enhancing readability and analysis.
- Volume and ATR Confirmation: Incorporates volume data and Average True Range (ATR) filtering to verify FVG occurrences, adding a layer of validation to the identified gaps.
Operational Mechanism:
The oscillator tallies bullish FVG occurrences as positive values and bearish FVG occurrences as negative values over the specified lookback period. It then applies volume and ATR criteria to confirm the significance of these gaps. The final output is an oscillator line that reflects the net value of bullish versus bearish FVGs, alongside histograms that show the width (or significance) of long and short patterns based on confirmed FVGs.
How to Use the FVG Oscillator:
- After adding the FVG Oscillator to your TradingView chart, adjust the 'Bars Back' input to tailor the oscillator's sensitivity to your trading strategy.
- Use the net value line to gauge the overall market sentiment based on FVG occurrences; a higher net value suggests bullish sentiment, while a lower value indicates bearish sentiment.
- The histograms provide an additional layer of insight, highlighting the relative strength and significance of confirmed bullish and bearish FVGs.
Application in Trading:
The FVG Oscillator is intended as an analytical tool to complement your existing trading strategy. By offering a unique perspective on FVG occurrences and their potential market implications, the oscillator can help inform your trading decisions. However, traders are encouraged to combine this tool with other forms of analysis and employ sound risk management practices.
Originality and Usefulness:
This oscillator is original in its integration of FVG analysis with traditional oscillator metrics, offering traders a novel tool for market analysis. Its usefulness lies in its ability to provide a quantitative and visual representation of FVGs, aiding traders in identifying potential market movements.
Disclaimer:
It is important for traders to understand that the financial markets are inherently unpredictable, and the FVG Oscillator is not a predictive tool nor does it guarantee trading success. It should be used as part of a comprehensive trading strategy, incorporating additional market analysis and risk management practices. Remember, past performance does not necessarily predict future results, and trading involves risks, including the potential loss of capital.
Fair Value Gaps Mitigation Oscillator [LuxAlgo]The Fair Value Gaps Mitigation Oscillator is an oscillator based on the traditional Fair Value Gaps (FVGs) imbalances. The oscillator displays the current total un-mitigated values for the number of FVGs chosen by the user.
The indicator also displays each New FVG as a bar representing the current ratio of the New FVG in relation to the current un-mitigated total for its direction.
🔶 USAGE
When an FVG forms, it is often interpreted as strong market sentiment in the direction of the gap. For example, an upward FVG during an uptrend is typically seen as a confirmation of the strength and continuation of the trend, as it indicates that buyers are willing to purchase at higher prices without much resistance, suggesting strong demand and positive sentiment.
By analyzing the mitigation (or lack thereof), we can visualize the increase of directional strength in a trend. This is where the proposed oscillator is useful.
🔶 DETAILS
The oscillator's values are expressed as Percentages (%). Each FVG is allocated 100% of the total of its width with a max potential value of 100 and minimum potential value of 0.
Based on the "FVG Lookback" Input, the FVGs are scaled to fit within the range of +1 to -1. Using a higher "FVG Lookback" value will allow you to get indications of longer-term trends.
A higher value of the normalized bullish FVG areas suggest a stronger and cleaner uptrend, while lower values of the bearish the normalized bullish FVG areas suggest a stronger and cleaner downtrend.
+1 or -1 indicates that there is a Full Lookback of FVGs, and each one is fully un-mitigated, and the opposite direction of FVGs is entirely Mitigated.
When the price closes over/under or within an FVG it begins to get mitigated, when this happens the % of mitigation is subtracted from the total.
When a New FVG is formed, a Histogram bar is created representing the ratio of the current FVG's width to the total width off all un-mitigated FVGs.
The entire bar represents 100% of total un-mitigated FVG Width.
The filled area represents the current FVG's width relative to the whole.
A 50% hash mark is also displayed for reference.
🔶 SETTINGS
FVG Lookback - Determines the number of FVGs (Bullish and Bearish Pairs) to keep in memory for analysis.

MACD by Take and TradeImproved version of MACD with asymmetrical BUY and SELL approaches.
This indicator is based on popular MACD one, but with some "tricks" designed to make it more applicable to the rapidly changing crypto market.
Key benefits:
Dynamic auto-adjusted threshold to filter out weak signals
Highlighted BUY/SELL signals with divergence (if a signal is accompanied by divergence, for example, price makes a new high while macd has a second high below the first, this signal is considered stronger and will be highlighted in a darker color)
Boost BUY signals on very slow market in accumulation phase
Not symmetric! It uses 2 different signal lines, which allows to obtain SELL signals earlier comparing to classic MACD approach
Classic concept of MACD
Classic MACD, in its simplest case, consists of two lines - macd line and signal line. Macd line is a difference between so-called "fast" and "slow" EMA lines (there are just a Exponential Moving Average lines with different windows: "12" for fast and "26" for slow). Signal line is just a smoothed "macd" line.
When macd line crosses signal line from bottom to up and intersection point < 0, this is "BUY" signal. And vise versa, when macd line crosses signal line from top to bottom, and intersection point > 0, this is "SELL" signal.
Parameters used in default configuration of classic MACD indicator:
Fast line: EMA-12
Slow line: EMA-26
Signal line: EMA-9
Problem of classic concept
Classic MACD indicator usually gives not bad "BUY" signals, especially if using them not for operational trading but for "investment" strategy. But "SELL" signalls usually generated too late. Simply because the market tends to fall much faster than it rises.
Possible solution (the main feature of our version of MACD)
To make indicator react faster on SELL condition, while still keeping it reliable for BUY signals, we decided to use two signal lines . Faster than default signal line (with window=6) for BUY signals and much faster than default (with window=2) for SELL signals.
This approach allowed us to receive sell signals earlier and exit deals on more favorable prices. Trade off of this change - is the number of SELL signals - there were more of them. However, this does not matter, since we receive the very first sell signal with a "very fast signal line" much earlier than with classic indicator settings.
Parameters we use in our improved MACD indicator:
Fast line: EMA-12
Slow line: EMA-24
Faster signal line: EMA-6
Much faster signal line: EMA-2
Removing noise (false triggerings)
Other drawback of classic MACD - it generates a lot of "weak" (false) signals. This signals are generated when macd crosses signal line much close to zero-line. And usually there are a lot of such intersections.
To remove this kind of noise, we added a trigger threshold, which by default is equal to 2.5% of the average asset price over a long period of time. Due to the link to the average price, this threshold automatically takes a specific value for each trading pair. Threshold 2.5% works perfect for all trading pairs for 1D timeframe. For other timeframes user can (and maybe will want) change it.
Boost weak BUY signals in a prolonged bear market
Signals on bearish stage are usually very weak, because there is no volatility, and no price impulse. And such signals will be filtered out as "noise" - see above. But this time is perfect time to buy! Therefore, we further boost the buy signals in a prolonged bear market so that they can pass through the filter and appear on the chart. Bearish period is the best time to invest!
Developed by Take and Trade. Enjoy using it!
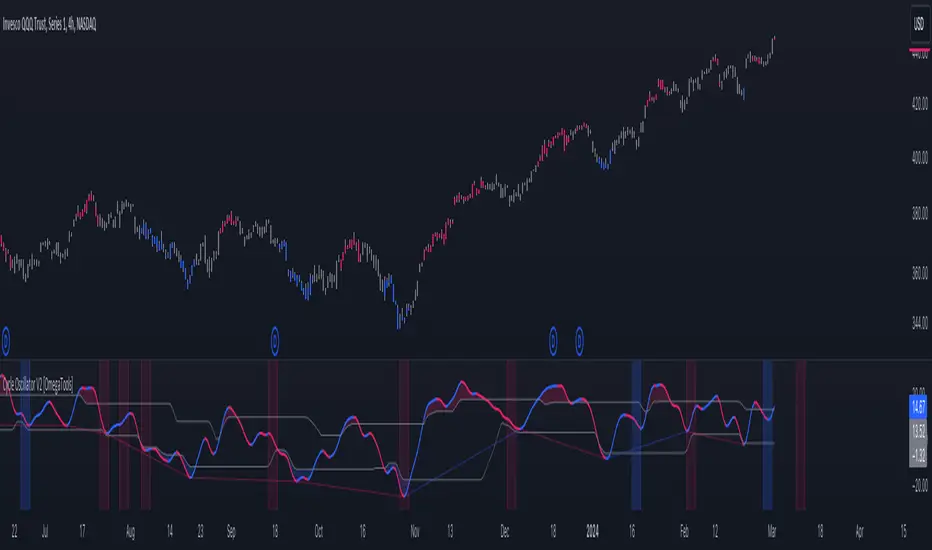
Cycle Oscillator V2 [OmegaTools]Introducing the "Cycle Oscillator" by OmegaTools, an innovative addition to your TradingView analysis toolkit. This script is designed to offer a unique approach to understanding market cycles without the need for volume data, making it versatile across various market conditions and asset classes.
Key Features:
- Cycle Length Customization: Tailor the cycle length from 10 to 200 bars to fit the specific rhythm of the market you're analyzing, ensuring relevance and precision.
- Smoothness Adjustment: Fine-tune the oscillator's smoothness to capture the essence of market movements with options ranging from 1 to 20.
- Aesthetic Flexibility: Choose your preferred colors for the oscillator's upward and downward movements, personalizing your chart to your liking.
- Historical Mode: Toggle the historical mode to either focus on real-time analysis or review past cycle data for backtesting and study.
- Candle Color Modes: Enhance your visual analysis with optional candle coloring based on trend, signals, or extensions, providing immediate insight into market conditions.
Usage Guide:
1. Setting Up: Easily adjust the cycle length and smoothness to match the market's current volatility and your trading style.
2. Understanding Market Cycles: The oscillator plots the average deviation from three distinct moving averages, offering a clear view of potential market turns or continuations.
3. Identifying Overbought/Oversold Conditions: Utilize the upper and lower bounds to recognize extreme market conditions, guiding your entry and exit decisions.
4. Visual Enhancements: Customize the visual aspects, including colors and candle coloring, to make your analysis both effective and aesthetically pleasing.
5. Anticipating Market Movements: The script provides forward-looking lines to suggest potential future highs or lows, aiding in predictive analysis.
Designed with both novice and experienced traders in mind, the "Cycle Oscillator" is a testament to OmegaTools' commitment to providing high-quality, innovative trading tools. Whether you're looking to refine your trading strategy or seeking new analytical perspectives, this script offers a comprehensive solution to navigating the ebbs and flows of the financial markets.
Join the community of traders enhancing their TradingView experience with the "Cycle Oscillator" by OmegaTools. Start exploring deeper market insights and unlock new trading opportunities today.
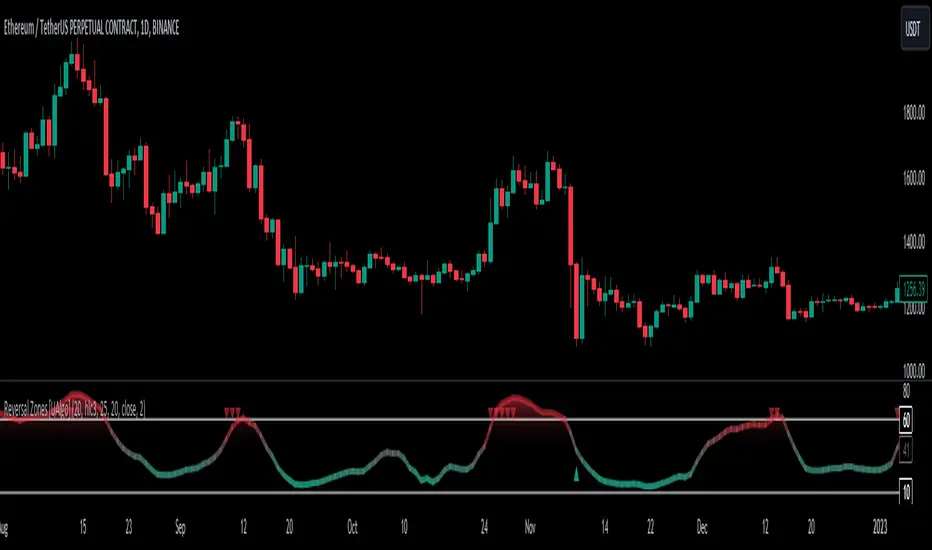
Reversal Zones [UAlgo]🔶Description:
"Reversal Zones " aims to identify potential reversal zones in price movements. The indicator provides visual signals on the chart, indicating potential overbought and oversold conditions based on the calculated values. It offers traders insights into possible turning points in the market, aiding in decision-making processes regarding entry and exit points.
🔶Key Features:
Bollinger Bands Percentile (BB Percentile):
Bollinger Bands Percentile is utilized in this script to gauge the current price position relative to its recent volatility. By calculating the percentile rank of the current price within the Bollinger Bands, traders can identify extreme price levels. This assists in recognizing potential overbought or oversold conditions, where price may be due for a reversal.
Choppiness Index (CI):
The Choppiness Index is employed here to measure the market's trendiness or choppiness. By evaluating the efficiency of the price movement, CI helps traders determine whether the market is trending or consolidating.
Commodity Channel Index (CCI):
The Commodity Channel Index is integrated into this script to capture price momentum. CCI quantifies the relationship between the current price, a moving average, and standard deviation. Traders use CCI to identify overbought or oversold conditions and potential trend reversals.
By averaging and smoothing these values, traders can obtain a clearer picture of potential turning points in the market. The final smoothed combination signal aims to reduce noise and provide more reliable insights.
🔶Disclaimer:
Please note that this script is provided for informational and educational purposes only and should not be considered as financial advice.
Trading in financial markets involves risk, and past performance is not necessarily indicative of future results.
Users should conduct their own research and analysis or consult with a qualified financial advisor before making any investment decisions based on this indicator.
The creators of this script are not liable for any losses incurred from trading activities.
Shadow Range IndexShadow Range Index (SRI) introduces a new concept to calculate momentum, shadow range.
What is range?
Traditionally, True Range (TR) is the current high minus the current low of each bar in the timeframe. This is often used successfully on its own in indicators, or as a moving average in ATR (Average True Range).
To calculate range, SRI uses an innovative calculation of current bar range that also considers the previous bar. It calculates the difference between its maximum upward and maximum downward values over the number of bars the user chooses (by adjusting ‘Range lookback’).
What is shadow range?
True Range (TR) uses elements in its calculation (the highs and lows of the bar) that are also visible on the chart bars. Shadow range does not, though.
SRI calculates shadow range in a similar formula to range, except that this time it works out the difference between the minimum upward and minimum downward movement. This movement is by its nature less than the maximums, hence a shadow of it. Although more subtle, shadow range is significant, because it is quantifiable, and goes in one direction or another.
Finally, SRI smoothes shadow range and plots it as a histogram, and also smoothes and plots range as a signal line. Useful up and down triangles show trend changes, which optionally colour the chart bars.
Here’s an example of a long trade setup:
In summary, Shadow Range Index identifies and traces maximum and minimum bar range movement both up and down, and plots them as centred oscillators. The dynamics between the two can provide insights into the chart's performance and future direction.
Credit to these authors, whose MA or filters form part of this script:
@balipour - Super Smoother MA
@cheatcountry - Hann window smoothing
@AlgoAlpha - Gaussian filter
MACD / Connectable [Azullian]Enhance your market insight with the MACD indicator. Monitor momentum to make more informed trading decisions, facilitating the development of stronger strategies.
This connectable MACD indicator is part of an indicator system designed to help test, visualize and build strategy configurations without coding. Like all connectable indicators , it interacts through the TradingView input source, which serves as a signal connector to link indicators to each other. All connectable indicators send signal weight to the next node in the system until it reaches either a connectable signal monitor, signal filter and/or strategy.
█ UNIFORM SETTINGS AND A WAY OF WORK
Although connectable indicators may have specific weight scoring conditions, they all aim to follow a standardized general approach to weight scoring settings, as outlined below.
■ Connectable indicators - Settings
• 🗲 Energy: Energy applies an ATR multiplier to the plotted shapes on the chart. A higher value plots shapes farther away from the candle, enhancing visibility.
• ☼ Brightness: Brightness determines the opacity of the shape plotted on the chart, aiding visibility. Indicator weight also influences opacity.
• → Input: Use the input setting to specify a data source for the indicator. Here you can connect the indicator to other indicators.
• ⌥ Flow: Determine where you want to receive signals from:
○ Both: Weights from this indicator and the connected indicator will apply
○ Indicator only: Only weights from this indicator will apply
○ Input only: Only weights from the connected indicator will apply
• ⥅ Weight multiplier: Multiply all weights in the entire indicator by a given factor, useful for quickly testing different indicators in a granular setup.
• ⥇ Threshold: Set a threshold to indicate the minimum amount of weight it should receive to pass it through to the next indicator.
• ⥱ Limiter: Set a hard limit to the maximum amount of weight that can be fed through the indicator.
■ Connectable indicators - Weight scoring settings
▢ Weight scoring conditions
• SM – Signal mode: Enable specific conditions for weight scoring
○ All: All signals will be scored.
○ Entries only: Only entries will score.
○ Exits only: Only exits will score.
○ Entries & exits: Both entries and exits will score.
○ Zone: Continuous scoring for each candle within the zone.
• SP – Signal period: Defines a range of candles within which a signal can score.
• SC - Signal count: Specifies the number of bars to retrospectively examine and score.
○ Single: Score for a single occurrence
○ All occurrences: Score for all occurrences
○ Single + Threshold: Score for single occurrences within the signal period (SP)
○ Every + Threshold: Score for all occurrences within the signal period (SP)
▢ Weight scoring direction
• ES: Enter Short weight
• XL: Exit long weight
• EL: Enter Long weight
• XS: Exit Short weight
▢ Weight scoring values
• Weights can hold either positive or negative scores. Positive weights enhance a particular trading direction, while negative weights diminish it.
█ MACD - INDICATOR SETTINGS
■ Main settings
• Enable/Disable Indicator: Toggle the entire indicator on or off.
• S - Source: Choose an alternative data source for the MACD calculation.
• T - Timeframe: Select an alternative timeframe for the MACD calculation.
• FL - Fast Length: Define the number of bars or periods used in the MACD calculation for the fast length.
• SL - Fast Length: Define the number of bars or periods used in the MACD calculation for the slow length.
• SM - Smoothing: Smooths the averaged MACD over a specified period.
• C - Condition Define the smoothing amount
○ Above/Below zero: : Trigger when the MACD line is above or below zero
○ All: : Trigger on all conditions
■ MACD Scoring functionality
• The MACD scores long entries when it crosses above its smoothed value and is below the zero line.
• The MACD scores long exits when it crosses below its smoothed value after a long entry.
• The MACD scores long zones the entire time the MACD line is above its smoothed value and below zero.
• The MACD scores short entries when it crosses below its smoothed value and is above the zero line.
• The MACD scores short exits when it crosses above its smoothed value after a short entry.
• The MACD scores short zones the entire time the MACD line is below its smoothed value and above zero.
█ PLOTTING
• Standard: Symbols (EL, XS, ES, XL) appear relative to candles based on set conditions. Their opacity and position vary with weight.
• Conditional Settings: A larger icon appears if global conditions are met. For instance, with a Threshold(⥇) of 12, Signal Period (SP) of 3, and Scoring Condition (SC) set to "EVERY", an MACD signaling over two times in 3 candles (scoring 6 each) triggers a larger icon.
█ USAGE OF CONNECTABLE INDICATORS
■ Connectable chaining mechanism
Connectable indicators can be connected directly to the signal monitor, signal filter or strategy , or they can be daisy chained to each other while the last indicator in the chain connects to the signal monitor, signal filter or strategy. When using a signal filter you can chain the filter to the strategy input to make your chain complete.
• Direct chaining: Connect an indicator directly to the signal monitor, signal filter or strategy through the provided inputs (→).
• Daisy chaining: Connect indicators using the indicator input (→). The first in a daisy chain should have a flow (⌥) set to 'Indicator only'. Subsequent indicators use 'Both' to pass the previous weight. The final indicator connects to the signal monitor, signal filter, or strategy.
■ Set up this indicator with a signal filter and strategy
The indicator provides visual cues based on signal conditions. However, its weight system is best utilized when paired with a connectable signal filter, monitor, or strategy .
Let's connect the MACD to a connectable signal filter and a strategy :
1. Load all relevant indicators
• Load MACD / Connectable
• Load Signal filter / Connectable
• Load Strategy / Connectable
2. Signal Filter: Connect the MACD to the Signal Filter
• Open the signal filter settings
• Choose one of the three input dropdowns (1→, 2→, 3→) and choose : MACD / Connectable: Signal Connector
• Toggle the enable box before the connected input to enable the incoming signal
3. Signal Filter: Update the filter signals settings if needed
• The default settings of the filter enable EL (Enter Long), XL (Exit Long), ES (Enter Short) and XS (Exit Short).
4. Signal Filter: Update the weight threshold settings if needed
• All connectable indicators load by default with a score of 6 for each direction (EL, XL, ES, XS)
• By default, weight threshold (TH) is set at 5. This allows each occurrence to score, as the default score in each connectable indicator is 1 point above the threshold. Adjust to your liking.
5. Strategy: Connect the strategy to the signal filter in the strategy settings
• Select a strategy input → and select the Signal filter: Signal connector
6. Strategy: Enable filter compatible directions
• Set the signal mode of the strategy to a compatible direction with the signal filter.
Now that everything is connected, you'll notice green spikes in the signal filter representing long signals, and red spikes indicating short signals. Trades will also appear on the chart, complemented by a performance overview. Your journey is just beginning: delve into different scoring mechanisms, merge diverse connectable indicators, and craft unique chains. Instantly test your results and discover the potential of your configurations. Dive deep and enjoy the process!
█ BENEFITS
• Adaptable Modular Design: Arrange indicators in diverse structures via direct or daisy chaining, allowing tailored configurations to align with your analysis approach.
• Streamlined Backtesting: Simplify the iterative process of testing and adjusting combinations, facilitating a smoother exploration of potential setups.
• Intuitive Interface: Navigate TradingView with added ease. Integrate desired indicators, adjust settings, and establish alerts without delving into complex code.
• Signal Weight Precision: Leverage granular weight allocation among signals, offering a deeper layer of customization in strategy formulation.
• Advanced Signal Filtering: Define entry and exit conditions with more clarity, granting an added layer of strategy precision.
• Clear Visual Feedback: Distinct visual signals and cues enhance the readability of charts, promoting informed decision-making.
• Standardized Defaults: Indicators are equipped with universally recognized preset settings, ensuring consistency in initial setups across different types like momentum or volatility.
• Reliability: Our indicators are meticulously developed to prevent repainting. We strictly adhere to TradingView's coding conventions, ensuring our code is both performant and clean.
█ COMPATIBLE INDICATORS
Each indicator that incorporates our open-source 'azLibConnector' library and adheres to our conventions can be effortlessly integrated and used as detailed above.
For clarity and recognition within the TradingView platform, we append the suffix ' / Connectable' to every compatible indicator.
█ COMMON MISTAKES, CLARIFICATIONS AND TIPS
• Removing an indicator from a chain: Deleting a linked indicator and confirming the "remove study tree" alert will also remove all underlying indicators in the object tree. Before removing one, disconnect the adjacent indicators and move it to the object stack's bottom.
• Point systems: The azLibConnector provides 500 points for each direction (EL: Enter long, XL: Exit long, ES: Enter short, XS: Exit short) Remember this cap when devising a point structure.
• Flow misconfiguration: In daisy chains the first indicator should always have a flow (⌥) setting of 'indicator only' while other indicator should have a flow (⌥) setting of 'both'.
• Hide attributes: As connectable indicators send through quite some information you'll notice all the arguments are taking up some screenwidth and cause some visual clutter. You can disable arguments in Chart Settings / Status line.
• Layout and abbreviations: To maintain a consistent structure, we use abbreviations for each input. While this may initially seem complex, you'll quickly become familiar with them. Each abbreviation is also explained in the inline tooltips.
• Inputs: Connecting a connectable indicator directly to the strategy delivers the raw signal without a weight threshold, meaning every signal will trigger a trade.
█ A NOTE OF GRATITUDE
Through years of exploring TradingView and Pine Script, we've drawn immense inspiration from the community's knowledge and innovation. Thank you for being a constant source of motivation and insight.
█ RISK DISCLAIMER
Azullian's content, tools, scripts, articles, and educational offerings are presented purely for educational and informational uses. Please be aware that past performance should not be considered a predictor of future results.

CCI / Connectable [Azullian]Sharpen your analysis of market trends with the CCI indicator. Effectively evaluate market cycles and identify potential reversals, enriching your strategic planning.
This connectable CCI indicator is part of an indicator system designed to help test, visualize and build strategy configurations without coding. Like all connectable indicators , it interacts through the TradingView input source, which serves as a signal connector to link indicators to each other. All connectable indicators send signal weight to the next node in the system until it reaches either a connectable signal monitor, signal filter and/or strategy.
█ UNIFORM SETTINGS AND A WAY OF WORK
Although connectable indicators may have specific weight scoring conditions, they all aim to follow a standardized general approach to weight scoring settings, as outlined below.
■ Connectable indicators - Settings
• 🗲 Energy: Energy applies an ATR multiplier to the plotted shapes on the chart. A higher value plots shapes farther away from the candle, enhancing visibility.
• ☼ Brightness: Brightness determines the opacity of the shape plotted on the chart, aiding visibility. Indicator weight also influences opacity.
• → Input: Use the input setting to specify a data source for the indicator. Here you can connect the indicator to other indicators.
• ⌥ Flow: Determine where you want to receive signals from:
○ Both: Weights from this indicator and the connected indicator will apply
○ Indicator only: Only weights from this indicator will apply
○ Input only: Only weights from the connected indicator will apply
• ⥅ Weight multiplier: Multiply all weights in the entire indicator by a given factor, useful for quickly testing different indicators in a granular setup.
• ⥇ Threshold: Set a threshold to indicate the minimum amount of weight it should receive to pass it through to the next indicator.
• ⥱ Limiter: Set a hard limit to the maximum amount of weight that can be fed through the indicator.
■ Connectable indicators - Weight scoring settings
▢ Weight scoring conditions
• SM – Signal mode: Enable specific conditions for weight scoring
○ All: All signals will be scored.
○ Entries only: Only entries will score.
○ Exits only: Only exits will score.
○ Entries & exits: Both entries and exits will score.
○ Zone: Continuous scoring for each candle within the zone.
• SP – Signal period: Defines a range of candles within which a signal can score.
• SC - Signal count: Specifies the number of bars to retrospectively examine and score.
○ Single: Score for a single occurrence
○ All occurrences: Score for all occurrences
○ Single + Threshold: Score for single occurrences within the signal period (SP)
○ Every + Threshold: Score for all occurrences within the signal period (SP)
▢ Weight scoring direction
• ES: Enter Short weight
• XL: Exit long weight
• EL: Enter Long weight
• XS: Exit Short weight
▢ Weight scoring values
• Weights can hold either positive or negative scores. Positive weights enhance a particular trading direction, while negative weights diminish it.
█ CCI - INDICATOR SETTINGS
■ Main settings
• Enable/Disable Indicator: Toggle the entire indicator on or off.
• S - Source: Choose an alternative data source for the CCI calculation.
• T - Timeframe: Select an alternative timeframe for the CCI calculation.
• LE - Length: Define the number of bars or periods used in the CCI calculation.
• OB - Overbought Level: Determine the CCI value at which overbought conditions are met.
• OS - Oversold Level: Specify the CCI value at which oversold conditions are met.
■ Scoring functionality
• The CCI scores long entries when the CCI enters OS: oversold area
• The CCI scores long exits when the CCI exits OS: oversold area
• The CCI scores long zones the entire time the CCI is in OS: oversold area
• The CCI scores short entries when the CCI enters OB: overbought area
• The CCI scores short exits when the CCI exits OB: overbought area
• The CCI scores short zones the entire time the CCI is in OB: overbought area
█ PLOTTING
• Standard: Symbols (EL, XS, ES, XL) appear relative to candles based on set conditions. Their opacity and position vary with weight.
• Conditional Settings: A larger icon appears if global conditions are met. For instance, with a Threshold(⥇) of 12, Signal Period (SP) of 3, and Scoring Condition (SC) set to "EVERY", an CCI signaling over two times in 3 candles (scoring 6 each) triggers a larger icon.
█ USAGE OF CONNECTABLE INDICATORS
■ Connectable chaining mechanism
Connectable indicators can be connected directly to the signal monitor, signal filter or strategy , or they can be daisy chained to each other while the last indicator in the chain connects to the signal monitor, signal filter or strategy. When using a signal filter you can chain the filter to the strategy input to make your chain complete.
• Direct chaining: Connect an indicator directly to the signal monitor, signal filter or strategy through the provided inputs (→).
• Daisy chaining: Connect indicators using the indicator input (→). The first in a daisy chain should have a flow (⌥) set to 'Indicator only'. Subsequent indicators use 'Both' to pass the previous weight. The final indicator connects to the signal monitor, signal filter, or strategy.
■ Set up this indicator with a signal filter and strategy
The indicator provides visual cues based on signal conditions. However, its weight system is best utilized when paired with a connectable signal filter, monitor, or strategy .
Let's connect the CCI to a connectable signal filter and a strategy :
1. Load all relevant indicators
• Load CCI / Connectable
• Load Signal filter / Connectable
• Load Strategy / Connectable
2. Signal Filter: Connect the CCI to the Signal Filter
• Open the signal filter settings
• Choose one of the three input dropdowns (1→, 2→, 3→) and choose : CCI / Connectable: Signal Connector
• Toggle the enable box before the connected input to enable the incoming signal
3. Signal Filter: Update the filter signals settings if needed
• The default settings of the filter enable EL (Enter Long), XL (Exit Long), ES (Enter Short) and XS (Exit Short).
4. Signal Filter: Update the weight threshold settings if needed
• All connectable indicators load by default with a score of 6 for each direction (EL, XL, ES, XS)
• By default, weight threshold (TH) is set at 5. This allows each occurrence to score, as the default score in each connectable indicator is 1 point above the threshold. Adjust to your liking.
5. Strategy: Connect the strategy to the signal filter in the strategy settings
• Select a strategy input → and select the Signal filter: Signal connector
6. Strategy: Enable filter compatible directions
• Set the signal mode of the strategy to a compatible direction with the signal filter.
Now that everything is connected, you'll notice green spikes in the signal filter representing long signals, and red spikes indicating short signals. Trades will also appear on the chart, complemented by a performance overview. Your journey is just beginning: delve into different scoring mechanisms, merge diverse connectable indicators, and craft unique chains. Instantly test your results and discover the potential of your configurations. Dive deep and enjoy the process!
█ BENEFITS
• Adaptable Modular Design: Arrange indicators in diverse structures via direct or daisy chaining, allowing tailored configurations to align with your analysis approach.
• Streamlined Backtesting: Simplify the iterative process of testing and adjusting combinations, facilitating a smoother exploration of potential setups.
• Intuitive Interface: Navigate TradingView with added ease. Integrate desired indicators, adjust settings, and establish alerts without delving into complex code.
• Signal Weight Precision: Leverage granular weight allocation among signals, offering a deeper layer of customization in strategy formulation.
• Advanced Signal Filtering: Define entry and exit conditions with more clarity, granting an added layer of strategy precision.
• Clear Visual Feedback: Distinct visual signals and cues enhance the readability of charts, promoting informed decision-making.
• Standardized Defaults: Indicators are equipped with universally recognized preset settings, ensuring consistency in initial setups across different types like momentum or volatility.
• Reliability: Our indicators are meticulously developed to prevent repainting. We strictly adhere to TradingView's coding conventions, ensuring our code is both performant and clean.
█ COMPATIBLE INDICATORS
Each indicator that incorporates our open-source 'azLibConnector' library and adheres to our conventions can be effortlessly integrated and used as detailed above.
For clarity and recognition within the TradingView platform, we append the suffix ' / Connectable' to every compatible indicator.
█ COMMON MISTAKES, CLARIFICATIONS AND TIPS
• Removing an indicator from a chain: Deleting a linked indicator and confirming the "remove study tree" alert will also remove all underlying indicators in the object tree. Before removing one, disconnect the adjacent indicators and move it to the object stack's bottom.
• Point systems: The azLibConnector provides 500 points for each direction (EL: Enter long, XL: Exit long, ES: Enter short, XS: Exit short) Remember this cap when devising a point structure.
• Flow misconfiguration: In daisy chains the first indicator should always have a flow (⌥) setting of 'indicator only' while other indicator should have a flow (⌥) setting of 'both'.
• Hide attributes: As connectable indicators send through quite some information you'll notice all the arguments are taking up some screenwidth and cause some visual clutter. You can disable arguments in Chart Settings / Status line.
• Layout and abbreviations: To maintain a consistent structure, we use abbreviations for each input. While this may initially seem complex, you'll quickly become familiar with them. Each abbreviation is also explained in the inline tooltips.
• Inputs: Connecting a connectable indicator directly to the strategy delivers the raw signal without a weight threshold, meaning every signal will trigger a trade.
█ A NOTE OF GRATITUDE
Through years of exploring TradingView and Pine Script, we've drawn immense inspiration from the community's knowledge and innovation. Thank you for being a constant source of motivation and insight.
█ RISK DISCLAIMER
Azullian's content, tools, scripts, articles, and educational offerings are presented purely for educational and informational uses. Please be aware that past performance should not be considered a predictor of future results.

Forex Multi-Factor IndicatorMoving Averages (MA):
Two moving averages are plotted on the chart: a fast MA (blue line) and a slow MA (red line).
The fast MA is calculated using a shorter period (10 periods by default), while the slow MA is calculated using a longer period (30 periods by default).
Moving averages help identify trends by smoothing out price fluctuations. When the fast MA crosses above the slow MA, it suggests a bullish trend, and when the fast MA crosses below the slow MA, it suggests a bearish trend.
Relative Strength Index (RSI):
The RSI indicator (orange line) is plotted on a separate axis.
RSI measures the speed and change of price movements and oscillates between 0 and 100.
RSI values above 70 are considered overbought, indicating a potential reversal to the downside, while RSI values below 30 are considered oversold, indicating a potential reversal to the upside.
Volume Moving Average (Volume MA):
The volume moving average (purple line) is plotted on the same axis as the volume.
The volume moving average is calculated over a specified period (20 periods by default).
Volume analysis provides insights into the strength of price movements. When the volume increases along with price movements, it suggests strong conviction from traders.
Buy and Sell Signals:
Buy signals (green triangle) are generated when all of the following conditions are met:
The fast MA crosses above the slow MA (indicating a bullish trend).
The RSI is below the oversold level (indicating potential upward momentum).
The current price is above the fast MA, and the volume is higher than the volume MA (indicating positive volume trend).
Sell signals (red triangle) are generated when all of the following conditions are met:
The fast MA crosses below the slow MA (indicating a bearish trend).
The RSI is above the overbought level (indicating potential downward momentum).
The current price is below the fast MA, and the volume is lower than the volume MA (indicating negative volume trend).
Overall, this multi-factor indicator combines moving averages, RSI, and volume analysis to identify potential buying and selling opportunities in the Forex market. Traders can use the signals generated by this indicator as part of their trading strategy, but it's important to consider other factors such as risk management and market conditions before making trading decisions

Wave Pendulum Trend [QuantraSystems]Wave Pendulum Trend
Introduction
The Wave Pendulum Trend (𝓟𝓮𝓷𝓭𝓾𝓵𝓾𝓶 𝓣𝓻𝓮𝓷𝓭) extrapolates market trends using physical principles derived from waves and pendulums. This indicator is a bespoke build, and its performance and behavior cannot be compared to existing indicators.
It is designed for trend following but is also effective for identifying mean reversions, momentum strength, and shows range-bound market periods within the dynamic bands.
In order to ascertain a smooth yet rapid trend direction of the market, the 𝓟𝓮𝓷𝓭𝓾𝓵𝓾𝓶 𝓣𝓻𝓮𝓷𝓭 combines several factors. A bespoke set of functions captures the momentum of price movements and dynamically weighs it over time. The indicator then extrapolates acceleration from the change in delta of price movements.
Legend
With bar coloring enabled, the price section mirrors current trend conditions. Please keep this feature disabled if you intend to use multiple indicators to avoid confusion.
The 𝓟𝓮𝓷𝓭𝓾𝓵𝓾𝓶 𝓣𝓻𝓮𝓷𝓭 presents extensive market insights. The purple and green bands around the oscillator signal the selected standard deviation (default σ = 2), for the trader to calculate how common the trending movements are in relation to the selected asset’s history.
The inner, dynamic thresholds, indicated by the blue “Range-bound market” label in the graphic above, border the area that signals a ranging market if both 𝓐𝓬𝓬𝓮𝓵𝓮𝓻𝓪𝓽𝓲𝓸𝓷 and 𝓜𝓸𝓶𝓮𝓷𝓽𝓾𝓶 signals remain inside. If either line exceeds these thresholds, care is advised as a shift in market behavior is underway.
“Trend strength” in the graphic provides a good estimate for the trending movements strength.
If the signal lines exceed the set standard deviation in non-classic mode, a reversal is very likely.
Case Study
As shown in the above case study we see two profitable swing trades on the 4H chart of Ethereum. Please note the display variant here is set to “Heikin-Ashi”.
We always recommend using a multitude of indicators to attain multiple signals on the likelihood of opening the correct position. However, this standalone scenario serves as an example on how the 𝓟𝓮𝓷𝓭𝓾𝓵𝓾𝓶 𝓣𝓻𝓮𝓷𝓭 added two profitable swing trades.
The first short trade was opened after the 𝓐𝓬𝓬𝓮𝓵𝓮𝓻𝓪𝓽𝓲𝓸𝓷 and 𝓜𝓸𝓶𝓮𝓷𝓽𝓾𝓶 reversed after crossing the threshold of standard deviation. This trade offered a late entry only, these two factors were followed late by the third signal in this case – the trend reversal. Such a trade would require additional indicators to signal at the same time, so the trader can get more confirmations. The trade was closed after 6D with an 8% gain on a 1x short position.
The second trade is a long position that enters in the same manner. The trader takes the reversal beyond the select standard deviation as a likely entry. After 7D a triple confirmation was received, as indicated by the triangle, that a reversal or at least a plateau is extremely likely. The trade was closed after 7D with a 17.23% gain on a 1x long position.
Recommended Settings
Trend Following / Investing (1D chart)
Please use the default settings!
Swing Trading (4H chart)
Wave MA - Type: TEMA
Wave MA – Length: 30
Display Variant: Heikin-Ashi
Bar Coloring: Off
Choose Mode for Coloring: Signal
Notes
Quantra Standard Value Contents:
The Heikin-Ashi (HA) candle visualization smoothes out the signal line to provide more informative insights into momentum and trends. This allows earlier entries and exits by observing the indicator values transformed by the HA.
Various visualization options are available to adjust the indicator to the user’s preference: Aside from HA, a classic line, or a hybrid of both.
A special feature of Quantra’s indicators is that they are probabilistically built - therefore they work well as confluence and can easily be stacked to increase signal accuracy.
To add to Quantra's indicators’ utility we have added the option to change the price bars colors based on different signals:
Settings: TEMA and DEMA length settings should be longer compared to other Moving Averages (MAs). Due to its complex calculations, the indicator requires a larger amount of historical data for accurate computation.
Sensitivity to Divergences: The Wave Pendulum Trend is particularly sensitive to divergences, making it a useful tool in spotting potential trend reversals or continuations.
Trend Following and Reversions: While it is primarily used for trend following, it also excels in identifying market reversions.
Momentum and Acceleration: The interaction between momentum and acceleration is a key feature of this indicator.
Visualization: The indicator offers various visualization options, including bar coloring based on HA Candles and extremes and trends. It also introduces a novel approach to visualizing the oscillator in the "Classic" mode and provides an adjustable Standard Deviation (SD) measure for reversal signals in non-classic modes.
Choose Mode for Coloring
Trend Following (Indicator above mid line counts as uptrend, below is downtrend)
Extremes (Everything beyond the SD bands is highlighted to signal mean reversion)
Candles (Color of HA candles as barcolor)
Reversions (Only for HA) (Reversion Signals via the triangles if HA candles change trend while beyond the SD bands, high probability entries/exits)
Methodology
The methodology behind the Wave Pendulum Trend is inspired by wave and pendulum theories to extrapolate market moves. By calculating the momentum and its acceleration from price data, it provides a nuanced view of the market trend.
Traders should observe the color coding, which reflects the interplay between momentum, acceleration, and set thresholds for acceleration. The Signal Mode is particularly useful for quickly identifying trend, momentum, and acceleration exhaustions.
Additionally, the indicator can help filter out ranges with insufficient momentum acceleration. Traders are encouraged to experiment with this mode and adjust the threshold settings to suit their strategies.

CBO (Candle Bias Oscillator)The Candle Bias Oscillator (CBO) with volume and ATR scaling is a unique technical analysis tool designed to capture market sentiment through the analysis of candlestick patterns, volume momentum, and market volatility. This indicator is built on the foundation of assessing the bias within a candlestick's body and wicks, adjusted for market volatility using the Average True Range (ATR), and further refined by comparing the Rate of Change (ROC) in volume and the adjusted bias. The culmination of these calculations results in the CBO, a smoothed oscillator that highlights potential market turning points through divergence analysis.
Key Features:
Bias Calculations: Utilizes the relationship between the candle's body and wicks to determine the market's immediate bias, offering a nuanced view beyond simple price action. Have you ever wanted to quantify exactly how bullish or bearish a particular candle or candlestick pattern is? Whether it's dojis, hammers, engulfing, gravestones, evening morning star, three soldiers etc. you don't have to memorize 50 candlestick patterns anymore.
Volatility Adjustment: Employs the ATR to adjust the bias calculation, ensuring the oscillator remains relevant across varying market conditions by accounting for volatility.
Momentum and Divergence: Measures the momentum in volume and bias through ROC calculations, identifying divergence that may signal reversals or significant price movements.
Signal Line: A smoothed version of the CBO, derived from its own values, serving as a benchmark for identifying potential crossovers and divergences.
Utility and Application:
The CBO with Divergence Scaling is developed for traders who seek a deeper understanding of market dynamics beyond price movements alone. It is particularly useful for identifying potential reversals or continuation patterns early, by highlighting divergence between market sentiment (as expressed through candlestick bias) and actual volume movements. In this way, it aligns us retail traders with institutional traders and smart money. This indicator is versatile and can be applied across various time frames and market instruments, offering value to both short-term traders and long-term investors.
How to Use:
Trend Identification: The direction and value of the CBO provide insights into the prevailing market trend. A positive oscillator value may indicate bullish sentiment, while a negative value suggests bearish sentiment.
Signal Line Crossovers: Crossovers between the CBO and its signal line can be used as potential buy or sell signals. A crossover above the signal line might indicate a buying opportunity, whereas a crossover below could suggest a selling point.
Divergence: Discrepancies between the CBO and price action (especially when confirmed by volume ROC) can highlight potential reversals.
Customization and Parameters: This script allows users to adjust several parameters, including oscillator periods, signal line periods, ATR periods, and ROC periods for divergence, to best fit their trading strategy and the characteristics of the market they are analyzing.
Conclusion:
The Custom Bias Oscillator with Divergence Scaling is a comprehensive tool designed to offer traders a multi-faceted view of market conditions, combining elements of price action, volatility, and momentum. By integrating these aspects into a single indicator, it aims to provide a more rounded and actionable insight into market trends and potential turning points.
To comply with best practices and ensure clarity regarding the informational nature of the Custom Bias Oscillator (CBO) tool, it's crucial to include a disclaimer about the non-advisory nature of the script. Here's a suitable disclaimer that you can add to the end of your script description or publication:
Disclaimer:
The Custom Bias Oscillator (CBO) with Divergence Scaling and its accompanying analysis are provided as tools for educational and informational purposes only and should not be construed as financial advice. The creator of this indicator does not guarantee any specific outcomes or profit, and all users should be aware of the risks involved in trading and investing. Users should conduct their own research and consult with a professional financial advisor before making any investment decisions. The use of this indicator is at the user's own risk, and the creator bears no responsibility for any direct or consequential loss arising from any use of this tool or the information provided herein.
Donchian Channel Trend MeterInspired by the Chande Trend Meter (this is not the Chande Trend Meter), this indicator aims to show the trend so you can make trading decisions accordingly. This is calculated by looking at Donchian Channels over a number of lengths (20, 40, 60 periods, etc.), converting them to percent, and then applying a weighting and smoothing similar to the Know Sure Thing Indicator. This results in smooth trend line that is not disturbed by large fluctuations in price action.
When the line is below 20%, you have a strong down trend. Values between 20 - 40% are a weak down trend. Values between 40 - 60% are no trend (slightly bullish or bearish if above or below 50%). Similarly, 60 - 80% is a weak uptrend, and above 80% is a strong uptrend. Trade signals can be turned on or off that correspond to crosses over 50%. It can be useful in spotting divergence.

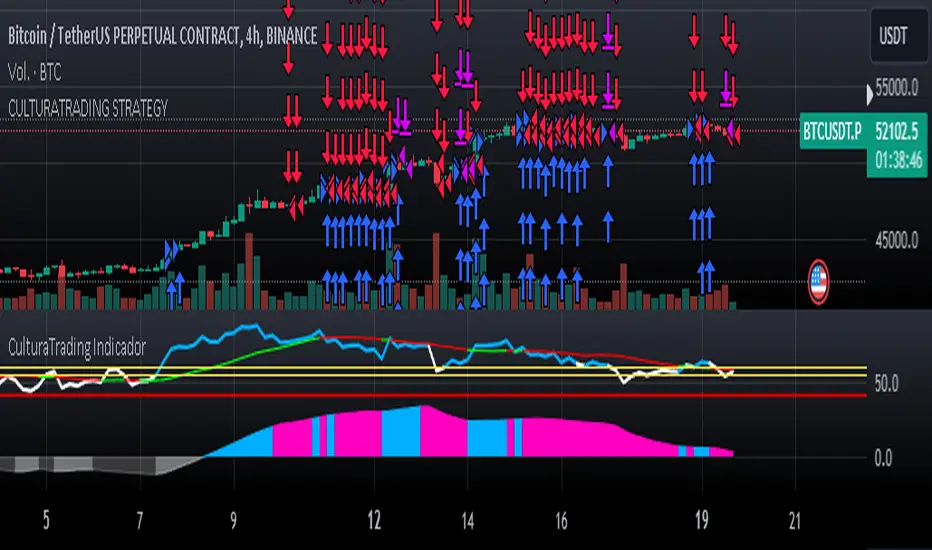
CulturaTrading IndicadorThe CULTURATRADING INDICATOR refines trading signals by integrating advanced analysis techniques across RSI, MACD, and ADX indicators. Here's a deep dive into its functionalities:
RSI Analysis:
Buying Signal Identification: The RSI component is calibrated not just to flag potential reversal points but to identify strong momentum. An RSI exceeding 60 is not merely an overbought signal; it indicates a robust buying momentum when it turns blue, aligning with CULTURATRADING STRATEGY's criteria for a potential long position.
Level 55 Significance: This level acts as a transitional threshold. When the RSI retreats below this point, it suggests a weakening momentum, prompting a reassessment of open positions.
Oversold Condition & Action: An RSI dipping below 40 signals an oversold condition, turning red, and aligning with a potential for a next long signal. staying alert when RSI stay over 40 level again and over on RSI Moving Average Following the idea CULTURATRADING STRATEGY.
Moving Average on RSI (MA RSI):
The inclusion of a Moving Average on the RSI serves as a trend filter. When the RSI is above the MA RSI, it underscores the strength of the current trend; conversely, if the RSI falls below the MA RSI, it calls for close all RSI long trade.
Volatility Histogram:
Color Coding & Market Response: The histogram changes colors based on market volatility and trend strength. Blue indicates a bullish trend continuation, where traders might consider entering long or holding positions. Rose suggests a market shift where traders should be vigilant, potentially taking profits from long or opening shorts positions. Grey denotes low volatility, signaling a period of market indecision where entering new trades may carry higher risk. staying out
Stop-Loss Placement: The histogram assists in identifying optimal stop-loss levels, providing visual cues for setting them just beyond the recent volatility extremes to protect against market whipsaws.
ADX Trend Strength Layer:
This layer offers a visual representation of the trend's strength. A rising ADX above the 25 level with a slope on the MACD line indicates a strong trend and defining directionality to trade (long if it close blue or short if its close rose), reinforcing the confidence in following the trend.
Usage & Importance:
While the CULTURATRADING STRATEGY provides a robust framework for trade execution, the CULTURATRADING INDICATOR is crucial for visualizing and confirming the signals it generates. It simplifies the complex interplay of various technical signals into a coherent visual format, aiding traders in making informed decisions.
The combination of RSI, MA RSI, and the volatility histogram offers a tri-layered approach to market analysis, enabling traders to discern between strong trends, pullbacks, and consolidations.
By integrating these elements, the CULTURATRADING INDICATOR serves as an indispensable tool for traders utilizing the CULTURATRADING STRATEGY, providing clarity and enhancing decision-making efficacy.
Disclaimer:
This indicator is designed for educational purposes to provide a visual aid in market analysis. Traders are advised to use it as part of a comprehensive risk-managed strategy. It is not intended as financial advice.