RPM StrategyAn original work, that use the formula for speed and a threshold for -/+ values to determine whether to buy or sell.
Ortalanmış Osilatörler

Momentum BFThe momentum strategy is simple, if price action is higher than it was for x bars back, and also higher than it was last candle, we have upwards momentum. This momentum will be positive until a candle closes lower than the previous candle and also lower than x bars back - at which point we have downwards momentum.
The concept behind the Momentum Strategy is that when the momentum crosses from negative to positive, we go long and when it crosses from positive to negative we go short. We stay in that position until momentum crosses back the opposite direction.
INSTRUCTIONS:
Go long at the green background on the chart
Go short at the red background on the chart
The yellow lines are where your stop loss should be for longs
The orange lines are where your stop loss should be for shorts
I have included the options in Settings to change the stop loss type between ATR derived and Fixed percentage based. The default stop loss is a fixed 7%.
You can also select if you want only longs, only shorts or both.
The backtest was done with BTCUSD on Coinbase 1D.

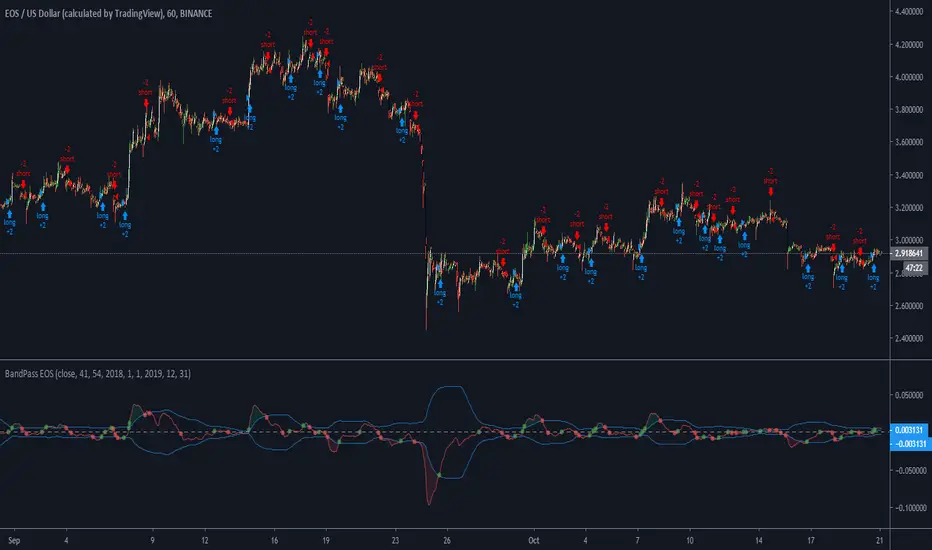
BandPass EOS - 1hThis is a strategy i made for EOS
Opens a long position if the PB line (the red line in the oscillator) crossover the low of the band, the zero line or the top of the band.
If the PB line makes a crossunder in the top of the band, the zero line or the bottom of the band it closes the long position and immediately opens a short position.
Also, the PB value must be higher than 5 candles before if it is a long position and PB must be lower than 5 candles before to open a short position
I got the BandPass Script from www.tradingview.com and made some changes in the configs to adapt the strategy.
If someone has any doubt i can answer below
∆MomentumStratUsing the intersection of momentum and its first DV to predict inflection points in price.

[BERA] POWER STRATEGYHey below my new strategy test, hope you like.
Work better with BTC
H1 and H4 timeframe.
How this work?
RSI based script.
-Modified length and different metrics for long and short.
Moving Averages.
-RSI panel below with color labels to identify the rsi levels.
-Simple trailing stop included.
Entry orders and exit orders for both -long and -short.
The default setup is the best perfomance i've find testing it.
If you are interest in the script contact me.

Histogram Trends Strategy by SedkurThis gives to you buy-sell signal with MACD's histogram trends.
Use "Fast and Slow length" and "Trend of Histogram Number" inputs to take less or more signal.
"Trend of Histogram Number" : This means how many histogram bars the trend continues before trading.

MACD Strategy by SedkurThis gives to you buy-sell signal with MACD histogram value.
Use "Fast and Slow length" and "Buy or Sell Histogram Value" inputs to take less or more signal.

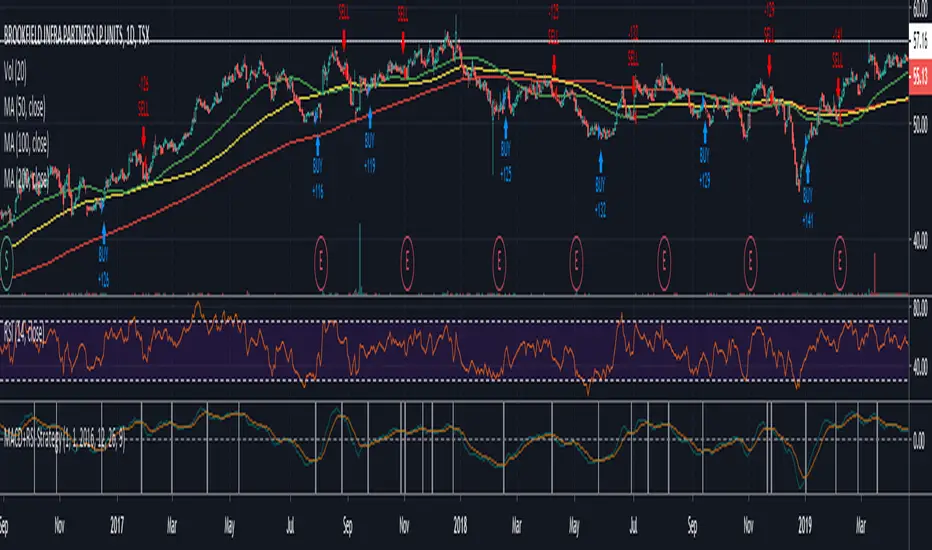
Easy to Use MACD+RSI Strategy
BEGINNERS REJOICE!
Easy to use strategy test using MACD with RSI as a confirming indicator. The code is structured to make it easy to manipulate the variables to your choosing.
EASY TO CHANGE CODE VARIABLES
LINE 2 = Change the amount you invest every trade and the currency
LINE 8/9/10 = Change the defval of each of these lines to backtest from a certain date
LINE 16/17/18 = Change the MACD sensitivity by changing the defval on each line
LINE 21 = Change the value after close toadjust the sensitivity of the RSI
LINE 37/39 = Change/remove the < and > variables for macdLine and rsivalue after the crossover/crossunder to adjust your buying point further.
As a beginner you may not feel comfortable with shorting stocks, therefore LINE 5 was added to only allows long positions.
Funny how a simple indicator can return such a high profitability. Couple this with some trend/exit strategies and you'll have something really special!
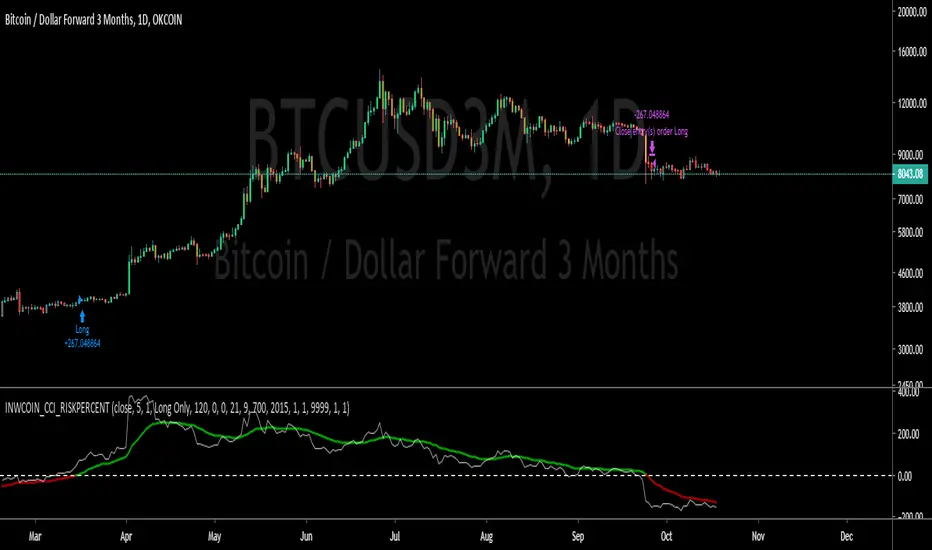
inwCoin CCI Risk% Strategy=========================
English
=========================
inwCoin CCI Risk% Strategy using CCI ( Commodity channel index ) and EMA of CCI to determine entry/ exit.
It's very good trend following strategy that it will not exit until the trend completely change.
Buy = EMA of CCI cross above 0
Sell = EMA of CCI cross under 0
You can adjust each parameters to see how's working for your setup.
==========================
Thai
==========================
inwCoin CCI Risk% Strategy ตัวนี้ผมเอา CCI มาช่วยในการหาจุดเข้าและจุดออก
โดยผมจะเอา EMA มาใส่ CCI ซ้อนไปอีกที เพื่อหาจุดเข้าและออกครับ
หลังจาก backtest แล้วก็พบว่า เป็นตัว trend following strategy ที่ค่อนข้างจับ trend ได้อยู่หมัด ( คือไม่ยอมออกง่ายๆ ถ้าราคาไม่หัวปักหนักๆ จริงๆ )
ตอนนี้ สำหรับ BTC ก็อย่างที่เห็น ว่า confirm trend ขาลงแล้ว .. หลังจากนี้ก็คงได้แต่รอการลงแรงๆ เพื่อปิดฉากขาลงสักรอบ แล้วค่อยขึ้นใหม่ 555
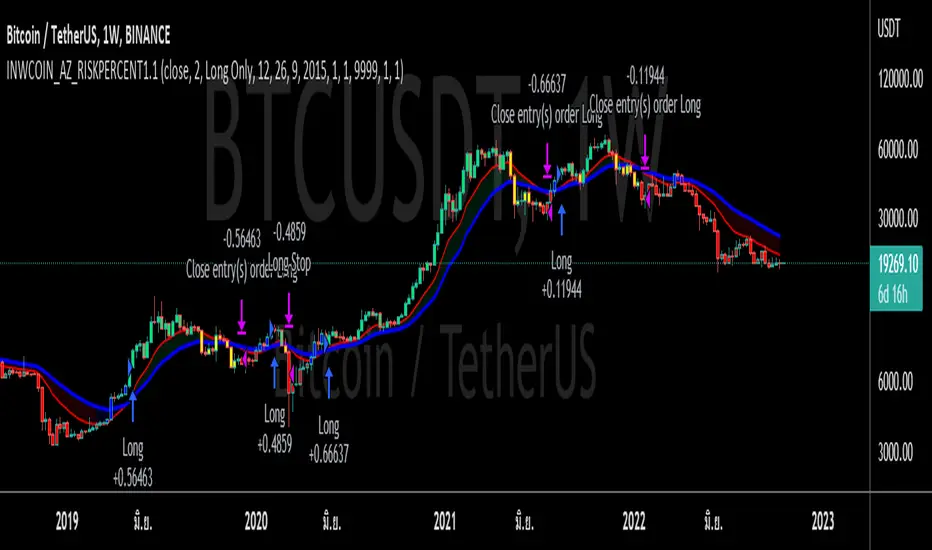
inwCoin ActionZone Risk% Strategy=========================
English
=========================
CDC Action Zone strategy with improved exit logic
Buy = Candle turn from blue to green
Sell = Price close below EMA 18
* Action Zone is just way to put MACD on chart for easily read
Original entry/exit logic is
Green = Buy
Red = Sell
Working great for BTC TF Daily.
==========================
Thai
==========================
"เทรดไรบ่อยๆ ปีนึงเทรดครั้งสองครั้งก็พอแล้ว -- มาเทรดเอาตัง ไม่ได้เอาเท่"
คำพูดสุดคลาสสิคของคุณลุงโฉลก ซึ่งเมื่อท่านเทรดไปบ่อยๆ ก็พบว่า ... เออ จริงของแก
เทรดไรบ่อยวะ นั่งทับมือ กันเฉยๆ น่ะเป็นไหม
ตัวนี้ผมเอา Action Zone เดิม มาปรับปรุง ให้เราสามารถเลือก Risk % ได้ จากเดิมที่เป็นการเข้าแบบทั้งก้อน ตอนนี้ก็ให้เข้าแบบ vary ได้แทน
inwCoin Know Sure Thing Risk% Strategy=========================
English
=========================
Just Know Sure Thing strategy for BTC.
Seem like it working great with daily TF so far..
Buy = KST cross above zero
Sell = KST cross under zero
==========================
Thai
==========================
หลังจากนั่ง แก้ไปแก้มาอยู่นานว่าควรใช้กลยุทธ Know Sure Thing ท่าไหนดี
ก็พบว่า ... ใช้ท่าตอนมันตัดเส้น 0 น่ะแหละ เพราะ cross กันนี่ผลห่วยแตกมาก
ค่า KST ผมใช้ค่า default ในการใช้งาน
รอบนี้น่าสนใจ เพราะ BTC มีสัญญาณให้ออกแล้ว
แต่ก็มาดูกันว่า จะมีให้เข้าใหม่อีกหรือเปล่า เพราะถ้ามีก็ไปต่อจ้า


MACD BF 🚀Customised MACD strategy with dynamic stop losses based on ATR.
Signals are generated when the delta value becomes positive or negative (when it crosses the zero line)
Stop losses are printed on the chart in yellow and orange. They are based on recent average True Range to allow for volatility.
INSTRUCTIONS
Green background = long
Red background = short
Yellow dotted line = stop loss placement for long
Orange dotted line = stop loss placement for short
White background = you have been stopped out, wait patiently for the next signal

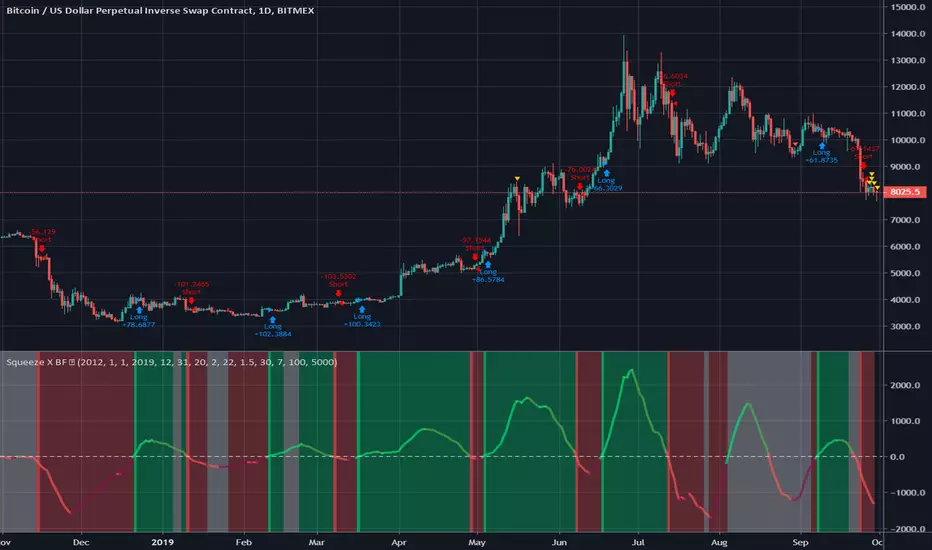
Squeeze X BF 🚀Credit to LazyBear and Kiasaki for code used in this indicator.
Squeeze Momentum indicator illustrates when a momentum squeeze is happening by calculating when Bollinger Bands are within a Keltner Channel.
This simple strategy is based on when the momentum is crossing positive or negative.
INSTRUCTIONS
Green = Long
Red = Short
White = No Trade
Decision BFFor XBT/USD pairs.
Based on Decision Point oscillator by LazyBear.
I added a Rate of Change component based on code by kiasaki - this stops trading in a sideways market.
You can adjust stop loss and take profit values in the settings.
INSTRUCTIONS
Go Long when the background turns from red to green
Go Short when the background turns from green to red
Do not trade when background is white since this is a sideways market

AlgoNinja RSI/MACDAlgoNinja buy/sell signal based on MADC/RSI/StochRSI data. BETA - Use at your own risk!

Combo Backtest 123 Reversal & CMOfilt This is combo strategies for get a cumulative signal.
First strategy
This System was created from the Book "How I Tripled My Money In The
Futures Market" by Ulf Jensen, Page 183. This is reverse type of strategies.
The strategy buys at market, if close price is higher than the previous close
during 2 days and the meaning of 9-days Stochastic Slow Oscillator is lower than 50.
The strategy sells at market, if close price is lower than the previous close price
during 2 days and the meaning of 9-days Stochastic Fast Oscillator is higher than 50.
Second strategy
This indicator plots a CMO which ignores price changes which are less
than a threshold value. CMO was developed by Tushar Chande. A scientist,
an inventor, and a respected trading system developer, Mr. Chande developed
the CMO to capture what he calls "pure momentum". For more definitive
information on the CMO and other indicators we recommend the book The New
Technical Trader by Tushar Chande and Stanley Kroll.
The CMO is closely related to, yet unique from, other momentum oriented
indicators such as Relative Strength Index, Stochastic, Rate-of-Change, etc.
It is most closely related to Welles Wilder`s RSI, yet it differs in several ways:
- It uses data for both up days and down days in the numerator, thereby directly
measuring momentum;
- The calculations are applied on unsmoothed data. Therefore, short-term extreme
movements in price are not hidden. Once calculated, smoothing can be applied to the
CMO, if desired;
- The scale is bounded between +100 and -100, thereby allowing you to clearly see
changes in net momentum using the 0 level. The bounded scale also allows you to
conveniently compare values across different securities.
WARNING:
- For purpose educate only
- This script to change bars colors.

trend_ultimateCan be used in any market , preferably 15 min. timeframe , take every signal and it will generate positive returns .
Note ** : Use it with anything which has daily standerd deviation gtreater than 2 for more positive result.

Combo Backtest 123 Reversal & CMOav This is combo strategies for get a cumulative signal.
First strategy
This System was created from the Book "How I Tripled My Money In The
Futures Market" by Ulf Jensen, Page 183. This is reverse type of strategies.
The strategy buys at market, if close price is higher than the previous close
during 2 days and the meaning of 9-days Stochastic Slow Oscillator is lower than 50.
The strategy sells at market, if close price is lower than the previous close price
during 2 days and the meaning of 9-days Stochastic Fast Oscillator is higher than 50.
Second strategy
This indicator plots average of three different length CMO's. This indicator
was developed by Tushar Chande. A scientist, an inventor, and a respected
trading system developer, Mr. Chande developed the CMO to capture what he
calls "pure momentum". For more definitive information on the CMO and other
indicators we recommend the book The New Technical Trader by Tushar Chande
and Stanley Kroll.
The CMO is closely related to, yet unique from, other momentum oriented
indicators such as Relative Strength Index, Stochastic, Rate-of-Change, etc.
It is most closely related to Welles Wilder?s RSI, yet it differs in several ways:
- It uses data for both up days and down days in the numerator, thereby directly
measuring momentum;
- The calculations are applied on unsmoothed data. Therefore, short-term extreme
movements in price are not hidden. Once calculated, smoothing can be applied to
the CMO, if desired;
- The scale is bounded between +100 and -100, thereby allowing you to clearly see
changes in net momentum using the 0 level. The bounded scale also allows you to
conveniently compare values across different securities.
WARNING:
- For purpose educate only
- This script to change bars colors.

Combo Backtest 123 Reversal & CMOabsThis is combo strategies for get a cumulative signal.
First strategy
This System was created from the Book "How I Tripled My Money In The
Futures Market" by Ulf Jensen, Page 183. This is reverse type of strategies.
The strategy buys at market, if close price is higher than the previous close
during 2 days and the meaning of 9-days Stochastic Slow Oscillator is lower than 50.
The strategy sells at market, if close price is lower than the previous close price
during 2 days and the meaning of 9-days Stochastic Fast Oscillator is higher than 50.
Second strategy
This indicator plots the absolute value of CMO. CMO was developed by Tushar
Chande. A scientist, an inventor, and a respected trading system developer,
Mr. Chande developed the CMO to capture what he calls "pure momentum". For
more definitive information on the CMO and other indicators we recommend the
book The New Technical Trader by Tushar Chande and Stanley Kroll.
The CMO is closely related to, yet unique from, other momentum oriented indicators
such as Relative Strength Index, Stochastic, Rate-of-Change, etc. It is most closely
related to Welles Wilder`s RSI, yet it differs in several ways:
- It uses data for both up days and down days in the numerator, thereby directly
measuring momentum;
- The calculations are applied on unsmoothed data. Therefore, short-term extreme
movements in price are not hidden. Once calculated, smoothing can be applied to
the CMO, if desired;
- The scale is bounded between +100 and -100, thereby allowing you to clearly see
changes in net momentum using the 0 level. The bounded scale also allows you to
conveniently compare values across different securities.
WARNING:
- For purpose educate only
- This script to change bars colors.

Lancelot RR StrategyDear all,
Free strategy again.
This strategy consists of 2 indicators I think works well with each other as a trend following strategy.
The 2 indicators are Renko chart and Relative Vigor Index.
This is a long-only breakout strategy that aims to capture the majority of the trend.
Works well on BTCUSD XBTUSD, as well as other major liquid Pair.
Please acknowledge my effort by like and follow.
And lastly,
Save Hong Kong, the revolution of our times.
