Candle Emotion Index (CEI)The Candle Emotion Index (CEI) is a comprehensive sentiment analysis indicator that combines three sub-oscillators—Indecision Oscillator, Fear Oscillator, and Greed Oscillator—to provide a single, unified measure of market sentiment. By analyzing bullish, bearish, and indecisive candlestick patterns, the CEI delivers a holistic view of market emotions and helps traders identify key turning points.
How It Works
Indecision Oscillator: Measures market uncertainty using Doji and Spinning Top candlestick patterns. Scores their presence and normalizes the results over a user-defined lookback period.
Fear Oscillator: Measures bearish sentiment using Shooting Star, Hanging Man, and Bearish Engulfing candlestick patterns. Scores their presence and normalizes the results over a user-defined lookback period.
Greed Oscillator: Measures bullish sentiment using Marubozu, Bullish Engulfing, Hammer, and Three White Soldiers candlestick patterns. Scores their presence and normalizes the results over a user-defined lookback period.
Candle Emotion Index Calculation: The CEI is calculated as the average of the Indecision, Fear, and Greed Oscillators: CEI = (Indecision Oscillator + Fear Oscillator + Greed Oscillator) / 3
Plotting: The CEI is plotted as a single line on the chart, representing overall market sentiment.
Reference lines are added to indicate Low Emotion, Neutral, and High Emotion levels.
The Candle Emotion Index provides a unified perspective on market sentiment by blending indecision, fear, and greed into one easy-to-interpret metric. It serves as a powerful tool for traders seeking to gauge market psychology and identify high-probability trading opportunities. For best results, use the CEI in conjunction with other technical indicators to confirm signals.
Mum Analizi

HTF CandlestickHTF Candlestick
This indicator that visualizes a specific candle from a user-defined timeframe (1D, 1H, etc.) and its associated properties on the chart. Below is a detailed explanation:
1 - Inputs and Initialization:
timeframeInput: Allows the user to select the desired timeframe (e.g., daily).
pos: Adjusts the horizontal position of the drawn candle on the chart.
2 - Custom Data Type (type bar):
The bar type stores data for the open, high, low, and close (OHLC) values, as well as the start time of the candle.
It also includes graphical elements like body, wick, and start lines.
3 - Logic:
A variable b is initialized to represent the custom candle.
The script checks for changes in the selected timeframe and creates a new bar when the timeframe changes.
4 - Methods:
update(): Updates the OHLC values of the bar if a new high or low occurs.
display(): Draws the candle on the chart, including:
The candle body.
The wick (shadow).
Labels showing the open, high, and low values.
Horizontal and vertical dotted lines for visual aid.
5 - Candle Redrawing:
The script clears all graphical elements (lines, labels, boxes) for the current candle on the last bar of the chart (barstate.islast) and redraws them using the display() method.
6 - Table Display:
A small table is displayed at the right-hand side of the chart showing:
The selected timeframe.
The opening value of the candle.
The difference between the close and open prices, highlighted with the appropriate color.
Kod Açıklaması
Bu Pine Script, kullanıcı tarafından seçilen bir zaman dilimine (1D, 1H vb.) ait bir mum çubuğunu ve onun özelliklerini grafik üzerinde görselleştiren özel bir indikatördür. İşte detaylı açıklaması:
1- Girdiler ve Başlangıç:
timeframeInput: Kullanıcının istediği zaman dilimini seçmesine olanak tanır (ör. günlük).
pos: Çizilen mumun grafikte yatay pozisyonunu ayarlamak için kullanılır.
2 - Özel Veri Tipi (type bar):
bar türü, açılış, yüksek, düşük ve kapanış (OHLC) değerlerini ve mumun başlangıç zamanını saklar.
Ayrıca, grafik öğeleri için body, wick ve start gibi alanlar içerir.
3- Mantık:
b değişkeni, seçilen mum çubuğunu temsil etmek için tanımlanmıştır.
Seçilen zaman diliminde bir değişiklik olup olmadığını kontrol eder ve değişiklik olduğunda yeni bir bar oluşturur.
4 - Metotlar:
update(): Daha yüksek bir zirve veya daha düşük bir dip meydana gelirse, mumun OHLC değerlerini günceller.
display(): Grafik üzerinde mum çubuğunu çizer. Bu işlem şunları içerir:
Mum gövdesi.
Fitil (gölge).
Açılış, yüksek ve düşük değerlerini gösteren etiketler.
Görsel yardım için yatay ve dikey kesik çizgiler.
5- Mum Yeniden Çizimi:
Grafik üzerindeki tüm grafiksel elemanları (çizgiler, etiketler, kutular) temizler ve mevcut mumun son çubuğunda (barstate.islast) bunları yeniden çizer.
6 - Tablo Görüntüsü:
Grafik üzerinde sağ tarafta küçük bir tablo gösterilir. Bu tabloda:
Seçilen zaman dilimi.
Mumun açılış değeri.
Kapanış ve açılış fiyatları arasındaki fark, uygun renkte vurgulanarak gösterilir.
Bu kod, kullanıcıya belirli bir zaman dilimindeki mum çubuğunun görsel bir analizini ve temel bilgilerini sağlar.

CHAKRA RISS ENGULFING CANDLESTICK STRATEGYChakra RISS Engulfing Candlestick Strategy
Type: Technical Indicator & Strategy
Platform: TradingView
Script Version: Pine Script v6
Overview:
The Chakra RISS Engulfing Candlestick Strategy combines a momentum-based approach using the Relative Strength Index (RSI) with Engulfing Candlestick Patterns to generate buy and sell signals. The strategy filters trades based on price movement relative to a 50-period Simple Moving Average (SMA), making it a trend-following strategy.
The indicator uses color-coded bars to visually represent market conditions, helping traders easily identify bullish and bearish trends. The strategy is designed to be dynamic, adapting to changing market conditions and filtering out noise using key technical indicators.
How It Works:
RSI-Based Color Conditions:
Green Bars: When the RSI crosses above a specified UpLevel (default: 50), indicating a bullish momentum and signaling potential buy conditions.
Red Bars: When the RSI crosses below a specified DownLevel (default: 50), indicating a bearish momentum and signaling potential sell conditions.
Buy Signal:
Triggered when the following conditions are met:
RSI crosses from below the UpLevel (default: 50) to above it, signaling increasing bullish momentum.
The close price is above the 50-period Simple Moving Average (SMA), confirming an uptrend.
The Buy Signal is plotted below the bar with a green arrow and a "BUY" label.
Sell Signal:
Triggered when the following conditions are met:
RSI crosses from above the DownLevel (default: 50) to below it, signaling increasing bearish momentum.
The close price is below the 50-period Simple Moving Average (SMA), confirming a downtrend.
The Sell Signal is plotted above the bar with a red arrow and a "SELL" label.
Stop Loss and Take Profit:
For long trades (buy signals), the stop loss is placed below the previous bar's low, and the take profit is set at 3% above the entry price.
For short trades (sell signals), the stop loss is placed above the previous bar's high, and the take profit is set at 3% below the entry price.
Dynamic Bar Coloring:
The bar colors change dynamically based on RSI levels:
Green Bars: Indicating a potential uptrend (bullish).
Red Bars: Indicating a potential downtrend (bearish).
These visual cues help traders quickly identify market trends and potential reversals.
Trend Filtering:
The 50-period Simple Moving Average (SMA) is used to filter trades based on the overall market trend:
Buy signals are only considered when the price is above the moving average, indicating an uptrend.
Sell signals are only considered when the price is below the moving average, indicating a downtrend.
Alerting System:
Alerts can be set for both buy and sell signals. These alerts notify traders in real-time when potential trades are generated, allowing them to act promptly.
Alerts can be configured to send notifications through email, SMS, or a webhook for integration with other services like IFTTT or Zapier.
Key Features:
RSI and Moving Average-Based Signals: Combines RSI with a moving average for more accurate trade signals.
Stop Loss and Take Profit: Dynamic risk management with custom stop loss and take profit levels based on previous high and low prices.
Buy and Sell Alerts: Provides real-time alerts when a buy or sell signal is triggered.
Trend Confirmation: Uses the 50-period Simple Moving Average to filter signals and confirm the direction of the trend.
Visual Bar Color Changes: Makes it easy to identify bullish or bearish trends with color-coded bars.
Usage:
This strategy is suitable for traders who prefer a trend-following approach and want to combine momentum indicators (RSI) with price action (Engulfing Candlestick patterns). It is particularly useful in volatile markets where quick identification of trend changes can lead to profitable trades.
Best Used For: Day trading, swing trading, and trend-following strategies.
Timeframes: Works well on various timeframes, from 1-minute charts for scalping to daily charts for swing trading.
Markets: Can be applied to any market with sufficient liquidity (stocks, forex, crypto, etc.).
Settings:
UpLevel: The RSI level above which the market is considered bullish (default: 50).
DownLevel: The RSI level below which the market is considered bearish (default: 50).
SMA Length: The period of the Simple Moving Average used to filter trades (default: 50).
Risk Management: Customizable stop loss and take profit settings based on price action (default: 3% above/below the entry price).

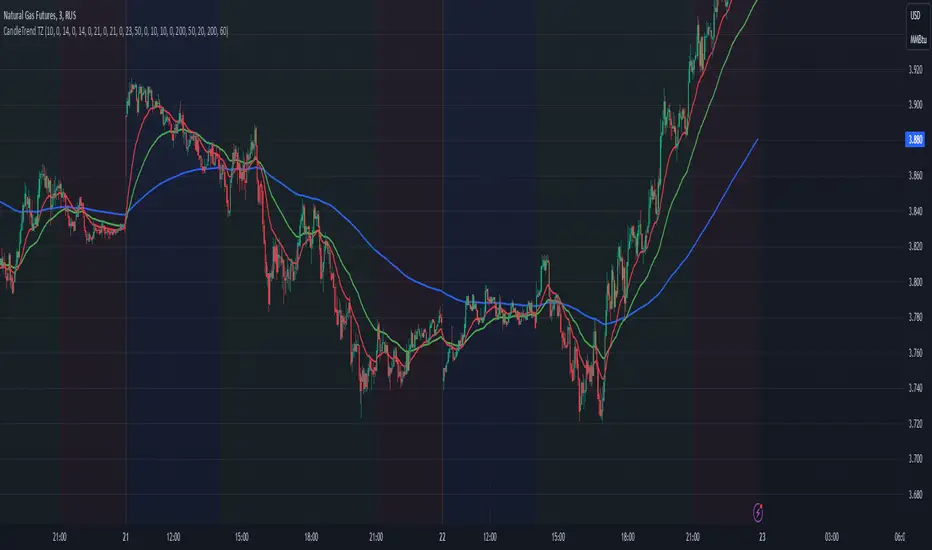
Dynamic Time Zone EMA with Candle Trend AnalysisCandleTrend TZ is a powerful analytical tool that integrates time zones, exponential moving averages (EMA), and custom candle coloring based on trend direction. This indicator is ideal for traders looking to analyze market trends within specific time sessions effectively.
Key Features:
Time Zones:
Divides the chart into four distinct time intervals, each highlighted with a unique background color.
Fully customizable start and end times for each interval, allowing for adaptation to various trading schedules.
Exponential Moving Averages (EMA):
Displays three EMAs with user-defined lengths:
EMA 200 (blue) for long-term trends.
EMA 50 (green) for medium-term trends.
EMA 20 (red) for short-term trends.
Helps identify trend direction and strength.
Custom Candle Coloring:
Utilizes smoothed Heiken Ashi and Triple EMA (TEMA) calculations for enhanced candle coloring:
Green candles indicate an upward trend.
Red candles signal a downward trend.
Filters out market noise, providing a clear visual representation of market dynamics.
Customization Options:
Time Zones:
Adjustable start and end times for each of the four sessions:
Input hour and minute for start and end times (e.g., Interval 1 Start/End Hour/Minute).
Background colors are pre-defined but can be modified in the code.
EMAs:
User-defined lengths for each EMA:
EMA 200 Length (default: 200)
EMA 50 Length (default: 50)
EMA 20 Length (default: 20)
TEMA Settings:
Parameters for trend smoothing:
TEMA Length (default: 55)
EMA Length (default: 60)
Use Cases:
Intraday Session Analysis:
Use time zones to differentiate between morning, afternoon, and evening market activity.
The background colors make it easy to track session-specific trends.
Trend Trading:
Analyze EMA crossings and their slopes to confirm market direction.
Green candles indicate buying opportunities, while red candles highlight selling signals.
Noise Reduction:
TEMA smoothing removes market noise, allowing you to focus on the primary market trend.
Adaptation to Custom Strategies:
By adjusting time intervals, you can tailor the indicator to specific trading styles or market conditions.
Benefits:
Versatility for both trending and sideways markets.
Intuitive and user-friendly setup.
Suitable for traders of all skill levels, from beginners to professionals.
CandleTrend TZ is an indispensable tool for understanding market dynamics, enhancing your trading precision, and making well-informed decisions. 🚀
RSI MACD Combined Color StrategyOverview
This indicator combines RSI and MACD signals to create a powerful visual trading system, inspired by TrendSpider's AI Strategy Coder examples. It colors candles based on the alignment of three key technical conditions, providing clear visual signals for potential trend strength and direction.
Technical Components
Core Conditions
RSI (Relative Strength Index) > 50
Indicates bullish momentum when price is trading above the centerline
Traditional indicator of trend strength
MACD Line > Signal Line
Shows positive momentum
Classic signal for potential upward movement
MACD Line > 0
Confirms bullish territory
Indicates overall positive momentum
Color Coding System
🟢 Green Candles: All three conditions are met
Strongest bullish signal
Suggests high probability trading opportunities
⚪ Grey Candles: One or two conditions are met
Neutral or transitioning market
Suggests caution or waiting for stronger confirmation
🔴 Red Candles: No conditions are met
Bearish signal
Suggests potential downward pressure
How to Use This Indicator
For Entry Signals
Look for transitions from red or grey to green candles
Green candles suggest strong bullish alignment
Consider entering long positions when candles turn green
For Exit Signals
Watch for color transitions from green to grey or red
Consider taking profits when candles change from green to grey
Consider stop losses when candles turn red
Risk Management
Use color transitions as part of your broader strategy
Don't rely solely on color changes for trading decisions
Combine with other technical analysis tools and risk management practices
Customizable Parameters
RSI Length (default: 14)
MACD Fast Length (default: 12)
MACD Slow Length (default: 26)
MACD Signal Length (default: 9)
Best Practices
Use multiple timeframes for confirmation
Look for confluences with support/resistance levels
Consider volume and market context
Start with default settings and adjust based on your trading style
Backtest different parameter combinations
Notes
This indicator works best in trending markets
Grey candles can indicate transition periods
Consider market conditions and volatility when interpreting signals
Credits
Inspired by TrendSpider's AI Strategy Coder examples and adapted for TradingView using Pine Script v5.
Disclaimer
This technical indicator is for informational purposes only. Always conduct your own analysis and consider risk management principles before making trading decisions. Past performance does not guarantee future results.

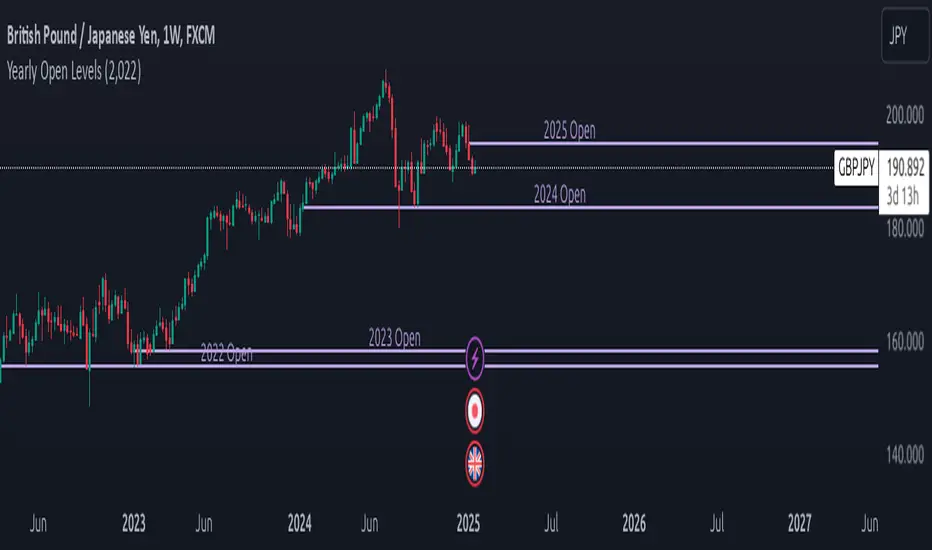
Yearly Open LevelsThe Yearly Open Levels indicator is designed to help traders visualize the opening price of each year on a price chart.
Key Features:
Yearly Open Display: Automatically calculates and displays the opening price for each year starting from a user-defined starting year. This helps traders quickly spot where the price opens each year.
Customizable Start Year: Users can set a specific year to begin displaying opening levels. The default starting year is 2022, but this can be adjusted based on individual trader needs.
Visual Lines and Labels: Each yearly open is represented by a horizontal line that extends to the right of the chart, making it easy to see the level throughout the year.
A label is placed next to the line, indicating the year and the opening price, enhancing clarity and reference while analyzing price movements.
Color Customization: Traders can choose the color of the lines and labels to fit their charting style or preferences, enhancing the visual representation on different market charts.
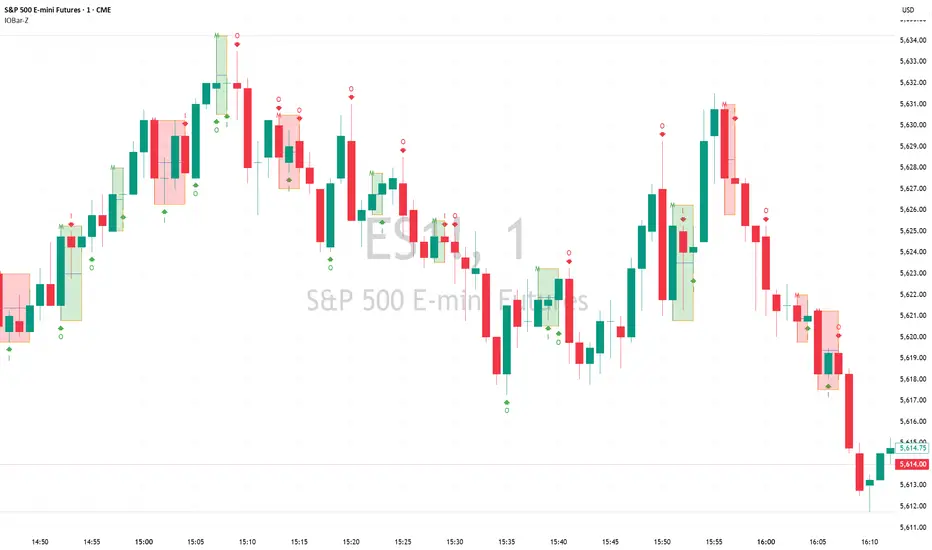
Inside Bar/Outside Bar/Mother Bar Box By SmartTrader888This Indicator shows:
1. Inside Bar
2. Outside Bar
3. Mother Bar box (Box the mother bar and all subsequent inside bars)
This indicator handles correctly the edge conditions such as:
1. bar close = bar open
2. current bar low equals to mother bar low or current bar high equals mother bar high
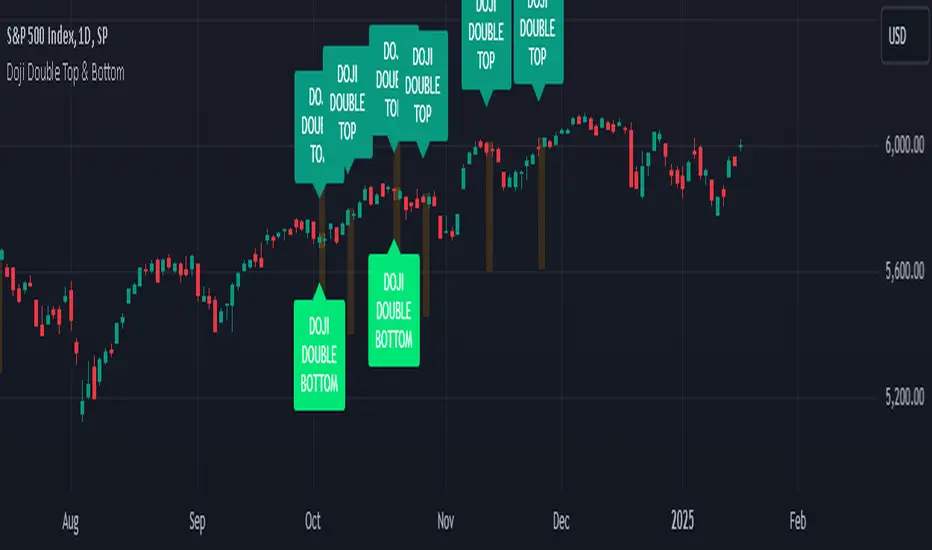
Doji Double Top & Double Bottom
FUNCTION :
This indicator checks if 2 consecutive candlesticks are formed in such a way that both the lows or both the highs of the consecutive candlesticks are almost at the same level and either of them is a doji
TIMEFRAMES :
it works on daily, weekly, monthly and higher timeframes
CRITERIA :
There is maximum difference value between 2 consecutive candlesticks' lows or 2 consecutive candlesticks' highs
Minimum value of the doji's wick size
Maximum value of the doji's body size
These 3 conditions need to be fulfilled for the 2 consecutive candlesticks to be considered as a Double top or Double bottom by this indicator
EXAMPLES :
Here the indicator is giving only double Bottom signals on CRUDE OIL chart
Here the indicator is giving only double top signals on GOLD chart
Here the indicator gives both double top & double bottom signals on EUR/USD Daily chart
Here the indicator is giving both double top & double bottom signals on EUR/USD Half-Yearly chart
DEFINITIONS :
There are 2 types -
DOJI DOUBLE BOTTOM - if the lows of 2 consecutive candlesticks are almost at the same level & either of them is doji then it is called Double Bottom and market is supposed to go higher after forming it.
DOJI DOUBLE TOP - if the highs of 2 consecutive candlesticks are almost at the same level & either of them is doji then it is called Double Top and market is supposed to go lower after forming it.
SETTINGS :
There are options to change the value of each of the 3 parameters within the indicator's settings for daily, weekly & monthly chart [
LIMITATIONS :
You should not trade based on the signals from this indicator solely, you should check other parameters too before making trading decision
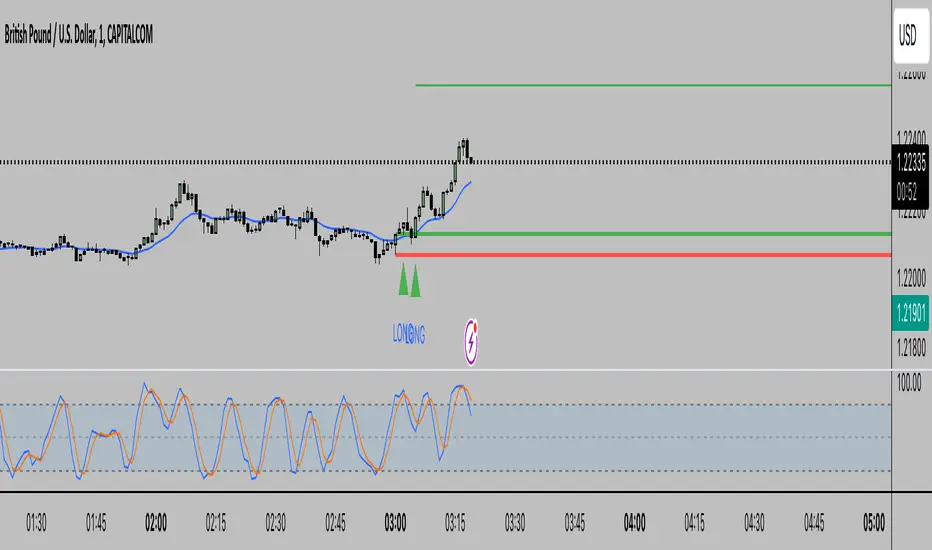
Candle 1 2 3 on XAUUSD (by Veronica)Description
Discover the Candle 1 2 3 Strategy, a simple yet effective trading method tailored exclusively for XAUUSD on the 15-minute timeframe. Designed by Veronica, this strategy focuses on identifying key reversal and continuation patterns during the London and New York sessions, making it ideal for traders who prioritise high-probability entries during these active market hours.
Key Features:
1. Session-Specific Trading:
The strategy operates strictly during London (03:00–06:00 UTC) and New York (08:30–12:30 UTC) sessions, where XAUUSD tends to show higher volatility and clearer price movements.
Pattern Criteria:
- Works best if the first candle is NOT a pin bar or a doji.
- Third candle should either:
a. Be a marubozu (large body with minimal wicks).
a. Have a significant body with wicks, ensuring the close of the third candle is above Candle 2 (for Buy) or below Candle 2 (for Sell).
Callout Labels and Alerts:
Automatic Buy and Sell labels are displayed on the chart during qualifying sessions, ensuring clarity for decision-making.
Integrated alerts notify you of trading opportunities in real-time.
Risk Management:
Built-in Risk Calculator to estimate lot sizes based on your account size, risk percentage, and stop-loss levels.
Customizable Table:
Displays your calculated lot size for various stop-loss pip values, making risk management seamless and efficient.
How to Use:
1. Apply the indicator to XAUUSD (M15).
2. Focus on setups appearing within the London and New York sessions only.
3. Ensure the first candle is neither a pin bar nor a doji.
4. Validate the third candle's body placement:
For a Buy, the third candle’s close must be above the second candle.
For a Sell, the third candle’s close must be below the second candle.
5. Use the generated alerts to streamline your entry process.
Notes:
This strategy is meant to complement your existing knowledge of market structure and price action.
Always backtest thoroughly and adjust parameters to fit your personal trading style and risk tolerance.
Credit:
This strategy is the intellectual property of Veronica, developed specifically for XAUUSD (M15) traders seeking precision entries during high-volume sessions.

BarbellFX ORBThe Opening Range Breakout (ORB) strategy is a popular day trading method that focuses on the first few minutes or hours of trading. Here's how it works:
The opening range is defined as a specific time period after the market opens (commonly the first 15-30 minutes)
Traders identify the high and low prices during this opening range
These prices become support and resistance levels
Trading signals are generated when the price breaks above or below these levels:
A breakout above the opening range high suggests going long
A break below the opening range low suggests going short
PENTAD THEORY 30 MINUTE INITIAL BALANCE With Candle HighlightThis indicator is designed to highlight the 30-minute initial balance range, visualize key retracement levels, and provide insights into market behavior based on defined conditions. It also enhances clarity by applying specific color changes to the :06 and :36 minute candle in relative 30-minute intervals.
Key Features:
Initial Balance Box:
Automatically creates a price range (box) representing the first 6 minutes of each 30-minute interval.
The box dynamically updates during this period to capture the high and low prices.
Color-Coded Zones:
Inside the Box: Yellow background indicates price trading within the range.
Above the Box: Green background shows price breaking above the range.
Below the Box: Red background reflects price breaking below the range.
EMA Overlay:
Plots 3 customizable EMAs (default lengths: 9, 21, 55).
Each EMA can be toggled on/off and colored individually for trend analysis.
Retracement Levels:
Automatically calculates and displays key Fibonacci retracement levels (61.8% and 38.2%) based on the box size.
Adds a midline for additional price reference.
Candle Highlighting:
The :06 and :36 minute candle in relative 30-minute intervals is highlighted with a customizable blue color to draw attention to specific market activity.
The break above or below the 6 minute candle or the close of the 6 minute candle outside the box can help determine the direction of the 30-minute interval.
How to Use:
Trend Confirmation:
Use the EMAs to identify overall trend direction. For example, a bullish trend is indicated when shorter EMAs (e.g., 9 EMA) are above longer ones (e.g., 55 EMA).
Breakout and Retracement Analysis:
Watch for price breaking out of the initial balance box.
Observe retracement levels (61.8% and 38.2%) as potential areas for reversal or continuation.
Candle Highlight:
Pay special attention to the :06 or :36 minute candle, which is highlighted to signify its relevance in the relative 30-minute cycle.
Customization:
Adjust colors and EMA settings via the input menu to align with your trading style and chart aesthetics.
Ideal For:
Intraday traders looking to analyze initial balance ranges.
Traders focused on breakout, retracement, and trend-following strategies.
Those who benefit from visual clarity and real-time market insights.
Notes:
Ensure your chart is set to a 3-minute timeframe or lower for optimal performance.
This indicator is most effective when combined with other confluence factors, such as support/resistance zones and volume analysis.

Candles Volume HeatMap [BigBeluga]Candles Volume HeatMap
The Candle Volume HeatMap indicator is a unique and advanced tool that visualizes lower timeframe volume activity within higher timeframe candles, offering traders a granular perspective on volume distribution.
⚠️Important note: before using the indicator, it is necessary to apply it to the candles
🔵Key Features:
Volume HeatMap Visualization: The indicator breaks down each higher timeframe candle into 10 equal vertical segments (boxes) based on its high-to-low range. Each box represents a lower timeframe candle's volume activity, with more intense colors indicating stronger volume levels.
Lower Timeframe Integration: Automatically uses a timeframe 10x lower than the current chart. For example, on a 10-hour chart, it uses 1-hour candles to extract volume data.
POC (Point of Control): The highest volume box within each candle is marked with the volume value. The indicator also plots a horizontal POC line at the level of this box, highlighting significant areas of price interest. The POC line is removed once the price crosses it, ensuring the chart stays clean.
Delta Display (Optional): Traders can enable the Delta feature to analyze buyer vs. seller activity within each higher timeframe candle.
Delta is calculated by summing 10 lower timeframe candles: a bullish candle adds to buyers, while a bearish candle adds to sellers. Displays the net Delta percentage: positive values (white) indicate buyer dominance, while negative values (red) indicate seller dominance.
Dynamic Volume Scaling: The highest volume value in each candle is displayed inside its respective box, providing quick insights into critical price-volume levels.
🔵How It Works:
For each higher timeframe candle, the indicator analyzes 10 lower timeframe candles and maps their volume into 10 segments (boxes) between the high and low of the current candle.
The intensity of each box's color corresponds to the relative volume of the lower timeframe candle it represents.
The POC highlights the price level with the highest concentration of volume, aiding in identifying potential support/resistance zones.
Delta analysis offers additional insights into market sentiment by breaking down buyer and seller activity in each candle.
🔵Use Cases:
Spotting key volume areas within higher timeframe candles to identify support and resistance levels.
Analyzing volume concentration for potential breakout or reversal zones.
Leveraging Delta analysis to gauge market sentiment and confirm volume-based trends.
This indicator is ideal for traders seeking to combine volume analysis with price action, offering precise insights into volume distribution and market dynamics.

HTF CandlesHTF Candles, Plot of a Higher/Lower Timeframe Candles on any chart.
This HTF / LTF candle plot displays the previous 3 daily candles with the current update of the price with reference to a lower time frame.
Candles includes 3 Candles of HTF
last HTF candle includes 4 previous candles from LTF
Candle High Low Open Close are plotted.
these OHLC values act as Support and Resistance With reference to current Price.
very useful in making HTF and LTF analysis with reference to current timeframe.

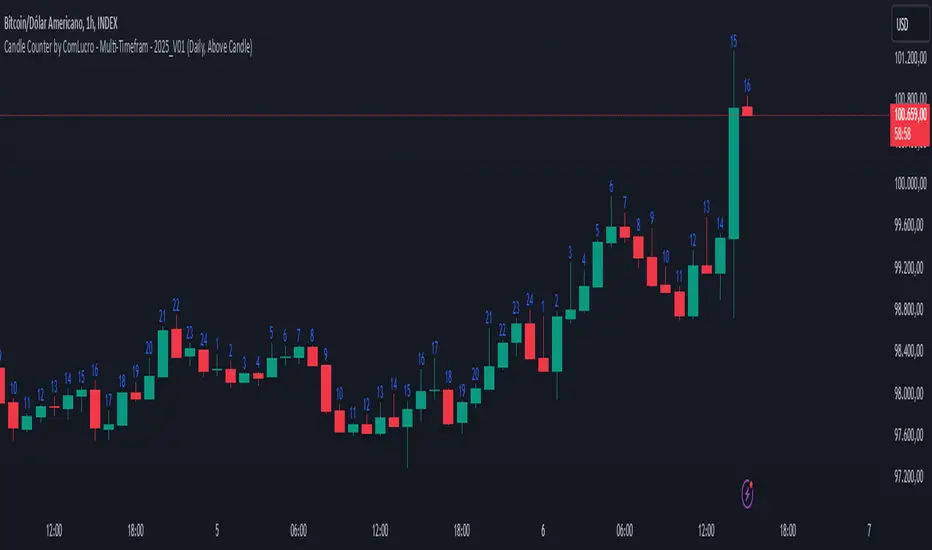
Candle Counter by ComLucro - Multi-Timefram - 2025_V01Candle Counter by ComLucro - Multi-Timeframe - 2025_V01
The Candle Counter by ComLucro - Multi-Timeframe is a highly customizable tool designed to help traders monitor the number of candles across various timeframes directly on their charts. Whether you're analyzing trends or tracking specific market behaviors, this indicator provides a seamless and efficient way to enhance your technical analysis.
Key Features:
Flexible Timeframe Selection: Track candle counts on yearly, monthly, weekly, daily, or hourly intervals to suit your trading style.
Dynamic Label Positioning: Choose to display labels above or below candles, offering greater control over your chart layout.
Customizable Colors: Adjust label text colors to match your chart's aesthetics and improve visibility.
Clean and Organized Visualization: Automatically generates labels for each candle without overcrowding your chart.
How It Works:
Select a Timeframe: Choose from yearly, monthly, weekly, daily, or hourly intervals based on your analysis needs.
Automatic Counting: The indicator calculates and displays the number of candles for the selected period directly on your chart.
Label Customization: Adjust the position (above or below the candles) and color of the labels to align with your preferences.
Why Use This Indicator?
This script is perfect for traders who need a clear and visual representation of candle counts in specific timeframes. Whether you're monitoring trends, evaluating price action, or developing strategies, the Candle Counter by ComLucro adapts to your needs and helps you make informed decisions.
Disclaimer:
This script is intended for educational and informational purposes only. It does not constitute financial advice. Always practice responsible trading and ensure this tool aligns with your strategies and risk management practices.
About ComLucro:
ComLucro is dedicated to providing traders with practical tools and educational resources to improve decision-making in the financial markets. Discover other scripts and strategies developed to enhance your trading experience.
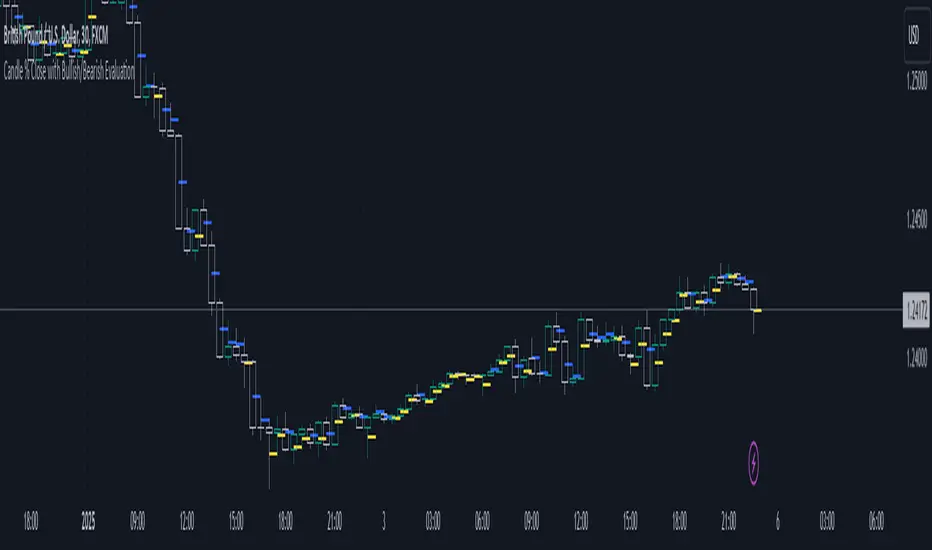
Candle % Close with Bullish/Bearish EvaluationI created the indicator to more quickly define the polarity of candles. For a large number of candles, it is straightforward to determine whether a candle is bullish or bearish. However, candles with long wicks often appear, making it uncertain whether the candle is bullish or bearish from a price action perspective. It is not a rule that a red candle is bearish and a green candle is bullish.
From a more advanced price action standpoint, how these candles close is important. Therefore, I created the 'Percent range' input. By default, it is set to 50% (high-low)/2. This way, the indicator precisely determines 50% of the candle's entire range. This allows us to determine whether a bearish candle truly closed below 50% of its range. If not, such a candle is considered bullish, even if it is a negative candle. The same applies to bullish candles, but conversely. If a positive candle closes below 50% of its range, from a price action perspective, it is considered a bearish candle.
Since in price action it is common for the price to return to 50% of the previous candle and, after filling, to continue in the established trend, I added the line extension option. Whatever high value you enter, the line extension follows the current candle. This option works only when the stop line checkbox is enabled. This way, you can plot 50% of the candle's range that the market has historically not returned to due to a strong trend. Often, this line is plotted on a candle where there is also an FVG, which can help you more easily find a point of interest.
Stop line extension : Ensures the interruption of line plotting when the candle is touched by the body or wick.
PreannFXExplanation of the PreannFX indicator:
Candle Body Size:
The body of the current candle is larger than the previous candle.
Bullish Engulfing:
The current candle closes higher than the previous candle's high.
The body size is larger than the previous candle.
Bearish Engulfing:
The current candle closes lower than the previous candle's low.
The body size is larger than the previous candle.
Entry and Exit:
Bullish: Enter at the previous candle's open or high, stop loss at the previous low, and take profit is 1:1 with the stop loss.
Bearish: Enter at the previous candle's open or low, stop loss at the previous high, and take profit is 1:1 with the stop loss.
Visualization:
Green upward arrows for bullish engulfing patterns.
Red downward arrows for bearish engulfing patterns.

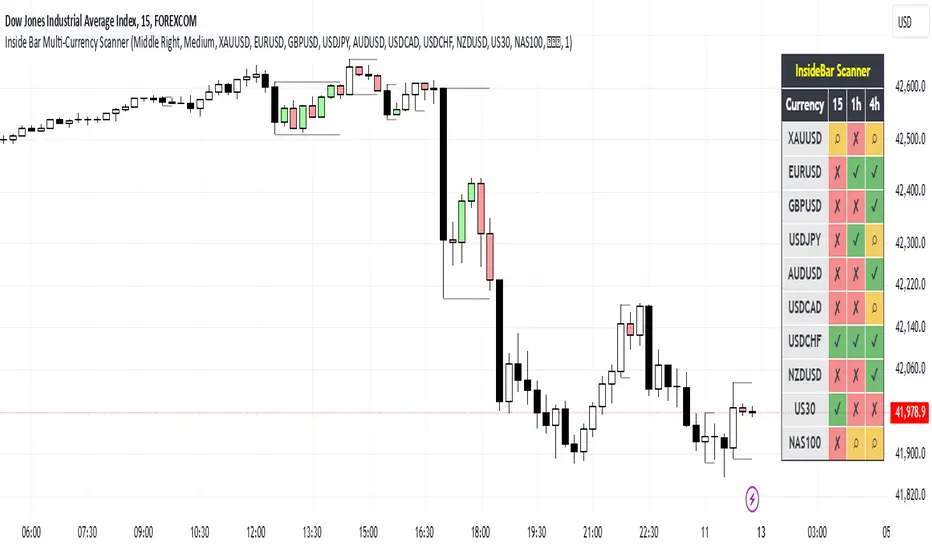
Inside Bar Multi-Currency ScannerDescription:
This script is an Inside Bar Scanner that allows you to monitor multiple currency pairs across different timeframes (15 minutes, 1 hour, and 4 hours). Its main features include:
Inside Bar Detection:
An Inside Bar is a candlestick where both the High and Low are within the range of the previous candle.
The script automatically identifies Inside Bars and displays the results in a table.
Customizable Timeframes:
Supports scanning in 15-minute, 1-hour, and 4-hour timeframes.
Results are displayed for each timeframe separately.
Multi-Currency Support:
Scan up to 10 currency pairs simultaneously.
Currency pairs are customizable and selected by the user.
Candle Coloring:
Inside Bars are highlighted with colors:
Semi-transparent green for bullish Inside Bars.
Semi-transparent red for bearish Inside Bars.
Colors are customizable and selected by the user.
Alerts:
Custom alerts for detecting Inside Bars in selected timeframes.
Receive notifications when an Inside Bar is detected in any of the selected currency pairs.
How to Use:
Select your desired currency pairs from the Scanner Currencies section.
Enable your preferred timeframes in the Scanner Timeframe section.
The script will display a table of results with Inside Bar information for each currency pair and timeframe.
Optionally, customize the candle colors in the Scanner InsideBar Color section.
Additional Explanation for Timeframe Status:
In each selected timeframe, there are three possible states for the candles:
Previous Candle is an Inside Bar:
Displayed with a green background and the symbol ✔.
Previous Candle is NOT an Inside Bar:
Displayed with a red background and the symbol ✘.
Current Candle is an Inside Bar:
Displayed with an orange background and the symbol ⌕.
These visual indicators provide a clear and quick overview of the Inside Bar status for each selected currency pair and timeframe.
Sunil Spinning Top IndicatorThe spinning top is single candlestick pattern can be used as a reversal pattern.
Long Entry ->
If formed near the support go long on the next candle crossing over the high of the spinning top candle.
Stop Loss = Low of the Spinning Top Candle
If formed near the Resistance go short on the next candle crossing under the low of the spinning top candle.
Stop Loss = High of the Spinning Top Candle
Back test and give your feedback.

HTF Candles Overlay [Trendoscope®]🎲 HTF Candles Overlay is a simple indicator where you can overlay higher timeframe candles on current timeframe chart.
Most of the code is encapsulated in the library HTFCandlesLib . After publishing the library as open source, many people requested to convert that into an indicator. Based on this, we decided to publish this small code for the use of community.
🎯 Usage
The indicator is simple, it helps users visualise higher timeframe candles. We majorly use this for debugging or validating our implementations based on higher timeframe. Instead of switching back and forth to different timeframes, it helps us visualise higher timeframe candles on the same chart when we are validating the implementation that involves higher timeframe calculations.
🎯 Components
The indicator provides two types of displays
Candles - overlay candles built through lines and labels
Plot - close price of higher timeframe plotted on chart
🎯 Candles
The behaviour of the candles are similar to that of hollow candles. The color of the body and the border+wick demonstrates the movement of the candle.
Body color is lime if the HTF close is higher than HTF open. Body color is orange if the HTF close is lower than the HTF open.
Wick and border color is lime if HTF close price is higher than previous HTF close price. And they are orange if HTF close price is lower than the previous HTF close price
In most cases body color will be same as the wick color. In case of stocks and indices, it may happen that the open price is too far away from previous close price due to gaps. This can lead to close price being relatively in different direction when compared to open and previous close.
Wicks are not at the centre of the candle. Instead wicks are drawn on the current chart timeframe position where the current timeframe has reached the highest or lowest point within the given HTF candle
Candles also list OHLC price of HTF candle along with HTF bar index and the range of LTF bar index that the candle spawns
Here are some pictorial representations that can help understand better.
Here are the examples of candles with gaps where body and wick/border are in different directions (colours)
🎯 Indicator Settings
Simple settings allow users to select the timeframe, whether to display candles and plots and their specific colors.
🎯 Possible inconsistencies
The overlay can show inconsistent data in certain situations. Here are some of the scenarios where the indicator may not show consistent display of the data.
When the HTF data from request.security does not match that of combined LTF data . In such cases, HTF candles may not form inline with the current timeframe candles. This happens when there is a data issue of different OHLC data available in tradingview.
When using weekly candle as either chart timeframe or higher timeframe - end of week may not coincide with end of month or other timeframes. This can cause some inconsistencies in the visuals of the indicator.
When open and close time of either LTF or HTF falls under different day due to time zone used. - time is always the time on which the candle close. So, when we use time zone that causes the exchange day to open and close on different days, that can cause some inconsistencies in the candles being drawn.

Did it move?That is the eternal question in trading.: Is the price moving? This indicators aims to answer that question. It is based on concepts from 2 Bars from "The Strat". This indicator measures the distance the current price is above the previous high or below the previous low and on two timeframes. The assumption is that the price is moving as long as the price is above or below the previous bar.
The distance the price moved is normalized by the standard deviation. This serves the trader in two ways: 1) you can quickly determine if a price movement is significant (score > 1), and 2) you can plan exits when the score falls below 1 (e.g., movement become insignificant). Movement upwards are colored green and down movements are red. When the price is also above the higher timeframe high (below the HTF low), the color are more intense. When the price is not moving, the background is highlighted.
Finally, there are two alert setting. One is for then the price stops moving (movement score falls below a threshold. The other is a exit/reversal warning. For example if there is a strong move in the opposite it will trigger that alert.

Top-Down Trend and Key Levels with Swing Points//by antaryaami0
Overview
The “Top-Down Trend and Key Levels with Swing Points” indicator is a comprehensive tool designed to enhance your technical analysis by integrating multiple trading concepts into a single, easy-to-use script. It combines higher timeframe trend analysis, key price levels, swing point detection, and ranging market identification to provide a holistic view of market conditions. This indicator is particularly useful for traders who employ multi-timeframe analysis, support and resistance levels, and price action strategies.
Key Features
1. Higher Timeframe Trend Background Shading:
• Purpose: Identifies the prevailing trend on a higher timeframe to align lower timeframe trading decisions with the broader market direction.
• How it Works: The indicator compares the current higher timeframe close with the previous one to determine if the trend is up, down, or ranging.
• Customization:
• Trend Timeframe: Set your preferred higher timeframe (e.g., Daily, Weekly).
• Up Trend Color & Down Trend Color: Customize the background colors for uptrends and downtrends.
• Ranging Market Color: A separate color to indicate when the market is moving sideways.
2. Key Price Levels:
• Previous Day High (PDH) and Low (PDL):
• Purpose: Identifies key support and resistance levels from the previous trading day.
• Visualization: Plots horizontal lines at PDH and PDL with labels.
• Customization: Option to show or hide these levels and customize their colors.
• Pre-Market High (PMH) and Low (PML):
• Purpose: Highlights the price range during the pre-market session, which can indicate potential breakout levels.
• Visualization: Plots horizontal lines at PMH and PML with labels.
• Customization: Option to show or hide these levels and customize their colors.
3. First 5-Minute Marker (F5H/F5L):
• Purpose: Marks the high or low of the first 5 minutes after the market opens, which is significant for intraday momentum.
• How it Works:
• If the first 5-minute high is above the Pre-Market High (PMH), an “F5H” label is placed at the first 5-minute high.
• If the first 5-minute high is below the PMH, an “F5L” label is placed at the first 5-minute low.
• Visualization: Labels are placed at the 9:35 AM candle (closing of the first 5 minutes), colored in purple by default.
• Customization: Option to show or hide the marker and adjust the marker color.
4. Swing Points Detection:
• Purpose: Identifies significant pivot points in price action to help recognize trends and reversals.
• How it Works: Uses left and right bars to detect pivot highs and lows, then determines if they are Higher Highs (HH), Lower Highs (LH), Higher Lows (HL), or Lower Lows (LL).
• Visualization: Plots small markers (circles) with labels (HH, LH, HL, LL) at the corresponding swing points.
• Customization: Adjust the number of left and right bars for pivot detection and the size of the markers.
5. Ranging Market Detection:
• Purpose: Identifies periods when the market is consolidating (moving sideways) within a defined price range.
• How it Works: Calculates the highest high and lowest low over a specified period and determines if the price range is within a set percentage threshold.
• Visualization: Draws a gray box around the price action during the ranging period and labels the high and low prices at the end of the range.
• Customization: Adjust the range detection period and threshold, as well as the box color.
6. Trend Coloring on Chart:
• Purpose: Provides a visual cue for the short-term trend based on a moving average.
• How it Works: Colors the candles green if the price is above the moving average and red if below.
• Customization: Set the moving average length and customize the uptrend and downtrend colors.
How to Use the Indicator
1. Adding the Indicator to Your Chart:
• Copy the Pine Script code provided and paste it into the Pine Script Editor on TradingView.
• Click “Add to Chart” to apply the indicator.
2. Configuring Inputs and Settings:
• Access Inputs:
• Click on the gear icon next to the indicator’s name on your chart to open the settings.
• Customize Key Levels:
• Show Pre-Market High/Low: Toggle on/off.
• Show Previous Day High/Low: Toggle on/off.
• Show First 5-Minute Marker: Toggle on/off.
• Set Trend Parameters:
• Trend Timeframe for Background: Choose the higher timeframe for trend analysis.
• Moving Average Length for Bar Color: Set the period for the moving average used in bar coloring.
• Adjust Ranging Market Detection:
• Range Detection Period: Specify the number of bars to consider for range detection.
• Range Threshold (%): Set the maximum percentage range for the market to be considered ranging.
• Customize Visuals:
• Colors: Adjust colors for trends, levels, markers, and ranging market boxes.
• Label Font Size: Choose the size of labels displayed on the chart.
• Level Line Width: Set the thickness of the lines for key levels.
3. Interpreting the Indicator:
• Background Shading:
• Green Shade: Higher timeframe is in an uptrend.
• Red Shade: Higher timeframe is in a downtrend.
• Gray Box: Market is ranging (sideways movement).
• Key Levels and Markers:
• PDH and PDL Lines: Represent resistance and support from the previous day.
• PMH and PML Lines: Indicate potential breakout levels based on pre-market activity.
• F5H/F5L Labels: Early indication of intraday momentum after market open.
• Swing Point Markers:
• HH (Higher High): Suggests bullish momentum.
• LH (Lower High): May indicate a potential bearish reversal.
• HL (Higher Low): Supports bullish continuation.
• LL (Lower Low): Indicates bearish momentum.
• Ranging Market Box:
• Gray Box Around Price Action: Highlights consolidation periods where breakouts may occur.
• Range High and Low Labels: Provide the upper and lower bounds of the consolidation zone.
4. Applying the Indicator to Your Trading Strategy:
• Trend Alignment:
• Use the higher timeframe trend shading to align your trades with the broader market direction.
• Key Levels Trading:
• Watch for price reactions at PDH, PDL, PMH, and PML for potential entry and exit points.
• Swing Points Analysis:
• Identify trend continuations or reversals by observing the sequence of HH, HL, LH, and LL.
• Ranging Market Strategies:
• During ranging periods, consider range-bound trading strategies or prepare for breakout trades when the price exits the range.
• Intraday Momentum:
• Use the F5H/F5L marker to gauge early market sentiment and potential intraday trends.
Practical Tips
• Adjust Settings to Your Trading Style:
• Tailor the indicator’s inputs to match your preferred timeframes and trading instruments.
• Combine with Other Indicators:
• Use in conjunction with volume indicators, oscillators, or other technical tools for additional confirmation.
• Backtesting:
• Apply the indicator to historical data to observe how it performs and refine your settings accordingly.
• Stay Updated on Market Conditions:
• Be aware of news events or economic releases that may impact market behavior and the effectiveness of technical levels.
Customization Options
• Time Zone Adjustment:
• The script uses “America/New_York” time zone by default. Adjust the timezone variable in the script if your chart operates in a different time zone.
var timezone = "Your/Timezone"
• Session Times:
• Modify the Regular Trading Session and Pre-Market Session times in the indicator settings to align with the trading hours of different markets or exchanges.
• Visual Preferences:
• Colors: Personalize the indicator’s colors to suit your visual preferences or to enhance visibility.
• Label Sizes: Adjust label sizes if you find them too intrusive or not prominent enough.
• Marker Sizes: Further reduce or enlarge the swing point markers by modifying the swing_marker_size variable.
Understanding the Indicator’s Logic
1. Higher Timeframe Trend Analysis:
• The indicator retrieves the closing prices of a higher timeframe using the request.security() function.
• It compares the current higher timeframe close with the previous one to determine the trend direction.
2. Key Level Calculation:
• Previous Day High/Low: Calculated by tracking the highest and lowest prices of the previous trading day.
• Pre-Market High/Low: Calculated by monitoring price action during the pre-market session.
3. First 5-Minute Marker Logic:
• At 9:35 AM (end of the first 5 minutes after market open), the indicator evaluates whether the first 5-minute high is above or below the PMH.
• It then places the appropriate label (F5H or F5L) on the chart.
4. Swing Points Detection:
• The script uses ta.pivothigh() and ta.pivotlow() functions to detect pivot points.
• It then determines the type of swing point based on comparisons with previous swings.
5. Ranging Market Detection:
• The indicator looks back over a specified number of bars to find the highest high and lowest low.
• It calculates the percentage difference between these two points.
• If the difference is below the set threshold, the market is considered to be ranging, and a box is drawn around the price action.
Limitations and Considerations
• Indicator Limitations:
• Maximum Boxes and Labels: Due to Pine Script limitations, there is a maximum number of boxes and labels that can be displayed simultaneously.
• Performance Impact: Adding multiple visual elements (boxes, labels, markers) can affect the performance of the script on lower-end devices or with large amounts of data.
• Market Conditions:
• False Signals: Like any technical tool, the indicator may produce false signals, especially during volatile or erratic market conditions.
• Not a Standalone Solution: This indicator should be used as part of a comprehensive trading strategy, including risk management and other forms of analysis.
Conclusion
The “Top-Down Trend and Key Levels with Swing Points” indicator is a versatile tool that integrates essential aspects of technical analysis into one script. By providing insights into higher timeframe trends, highlighting key price levels, detecting swing points, and identifying ranging markets, it equips traders with valuable information to make more informed trading decisions. Whether you are a day trader looking for intraday opportunities or a swing trader aiming to align with the broader trend, this indicator can enhance your chart analysis and trading strategy.
Disclaimer
Trading involves significant risk, and it’s important to understand that past performance is not indicative of future results. This indicator is a tool to assist in analysis and should not be solely relied upon for making trading decisions. Always conduct thorough research and consider seeking advice from financial professionals before engaging in trading activities.

TechniTrend: CandleMetrics🟦 Overview
The TechniTrend: CandleMetrics Indicator is a powerful tool designed to give traders an in-depth analysis of candlestick structures. This indicator allows users to identify potential reversal points, trend continuations, and other crucial market behaviors by examining key ratios between candle components—such as body, shadow, and overall range—alongside volume conditions. The advanced filtering options offer flexibility for both novice and experienced traders, enabling tailored setups to suit different trading strategies.
🟦 Key Features
🔸Customizable Ratios: Set thresholds for Body-to-Range, Shadow-to-Range, Upper Shadow-to-Range, and Lower Shadow-to-Range ratios.
🔸Volume-Based Filters: Integrate volume conditions to strengthen the reliability of signals.
🔸Flexible Conditions: Choose whether filters should work independently or in combination, allowing for precise pattern identification.
🔸Visual Markers: Mark potential signals with a distinct background color and symbols on the chart.
🔸Alerts: Receive notifications for each selected condition, ensuring you never miss an opportunity.
🟦 How It Works
The CandleMetrics Indicator operates by analyzing the relationship between different components of each candlestick, combined with volume data to determine the strength of signals. Here’s a detailed breakdown of each feature:
🔸 Body to Range Ratio:
This filter compares the size of the candle's body to its total range (from high to low).
Example Setting: If you’re interested in spotting candles with small bodies relative to their total range, you might set the Body-to-Range Ratio to “Less than 0.3.”
🔸 Shadow to Range Ratio:
This examines the combined size of both shadows (upper and lower) relative to the entire candle range.
Example Setting: Use a Shadow-to-Range Ratio set to “More than 0.8” to find candles with significant wick lengths, suggesting market indecision.
🔸 Upper Shadow to Range Ratio:
This filter assesses the proportion of the upper shadow (wick) in relation to the candle’s full range.
Example Setting: “Less than 0.05” can help identify situations where the upper shadow is minimal, indicating strong downward pressure.
🔸 Lower Shadow to Range Ratio:
It measures the lower shadow compared to the entire candle range.
Example Setting: “More than 0.7” is useful for detecting potential rejection patterns at lower prices, hinting at a possible bullish reversal.
🔸 Volume Filter:
Integrates volume data to verify the reliability of each candle pattern.
Example Setting: Apply a Volume Filter Length of 100 with an SMA type to smooth volume data over a longer period, filtering out short-term noise and focusing on significant volume shifts.
🟦 Combining Filters
The indicator offers an option to Combine Filters. When this setting is enabled, all selected conditions must be met simultaneously for a candle to be marked. If disabled, each condition functions independently, allowing more flexibility in detecting diverse patterns.
🟦 Examples & Use Cases
🔸Example 1: Spotting Reversal Opportunities
I used the following configuration to find potential bullish reversals:
Upper Shadow to Range Ratio: “Less than 0.05” – Looking for candles with almost no upper shadow.
Lower Shadow to Range Ratio: “More than 0.7” – Highlighting candles with a significant lower shadow.
Volume Filter Length: 100 with SMA.
This setup effectively highlights candles where price rejection is happening at lower levels, suggesting a potential trend reversal to the upside.
🔸Example 2: Detecting Market Uncertainty
If you want to focus on candles showing market hesitation, try:
Shadow to Range Ratio: “More than 0.85” – Emphasizing long-wick candles that could indicate indecision.
Disable Combine Filters to allow flexibility, marking any candle meeting the above criteria.
🟦 Detailed Explanation of Each Option
Here’s a clear and concise breakdown of each option for a better understanding:
1. Body to Range Ratio
Purpose: This ratio shows how significant the candle's body is compared to its overall range. A smaller body-to-range ratio can indicate a potential reversal if the market appears indecisive.
How to Use: Increase the ratio to filter for stronger trend candles; decrease it to identify reversal or indecision candles.
2. Shadow to Range Ratio
Purpose: This filter captures the size of both shadows relative to the candle's total range. A larger ratio often points to market hesitation, while a smaller ratio suggests a decisive move.
How to Use: Adjust this filter to focus on candles with long wicks (indecision) or short wicks (decisiveness).
3. Upper Shadow to Range Ratio
Purpose: Helps to identify candles with strong downward moves by focusing on the upper wick length. A small upper shadow can imply sellers' dominance.
How to Use: Lower the ratio to detect candles with minimal upward rejection.
4. Lower Shadow to Range Ratio
Purpose: Targets candles with strong buying pressure by analyzing the lower shadow. A larger lower shadow may indicate a bullish reversal.
How to Use: Increase the ratio to spot rejection candles with significant lower shadows.
5. Volume Filter
Purpose: Adds a volume component to verify the validity of each candlestick pattern. Higher-than-average volume often signifies the strength of a move.
How to Use: Adjust the filter length and type to smooth out volume fluctuations based on your trading timeframe.
🟦 Indicator Alerts
Each filter has its own alert configuration, enabling traders to stay updated on market conditions that meet their selected criteria. You can customize alerts to trigger whenever a condition is met, helping to manage trades even when away from the screen.
Market GhostGhost Candles: Volume-Based Transparency Indicator
Before adding the indicator to the chart, hide the chart candles (the chart would get blank) otherwise no changes will be visible on your chart due to the display of the original candles (transparencies won't be visible because the full-opaque candles cover them)
This unique indicator dynamically adjusts the transparency of candles based on their volume relative to the past X candles. Candles with low volume become more transparent, while those with higher volume appear more opaque, creating a smooth gradient effect. This allows for a visual representation of market activity where low-volume candles "fade" into the background, making high-volume candles stand out more clearly.
Customizable Lookback Period: Adjust the lookback period (X candles) to suit your analysis.
Volume-Based Visualization: A smooth gradient of transparency helps to visualize volume strength relative to recent market activity.
Unique Aesthetic: Adds a unique, "ghostly" aesthetic to the chart, ideal for identifying volume trends without the clutter of traditional indicators.
This script is perfect for traders who want to visually highlight volume strength while maintaining a clean, easy-to-read chart.
