Last Candle RangeCalculates the size of the last candle on whatever timeframe you are watching (high - low)
Candle

Mark specific candle (e.g. bar 20)This Pine Script indicator, "Mark specific candle (e.g. bar 20)" (short title "Mark candle"), is a simple yet powerful tool to visually highlight a particular candle on your chart.
What it does:
It marks a specific candle (e.g., the 20th, 10th, or any number you choose) counting backwards from the most recent candle on your chart. The marked candle will be colored in a subtle light grey and also feature a tiny, matching grey arrow pointing down from above it.
Why it's useful:
This indicator helps you quickly identify and track a consistent reference point in recent price action. It's great for strategies that depend on fixed look-back periods or for simply keeping an eye on a specific historical candle's position as new data comes in.
Key Features:
Adjustable Candle Number: Easily change which candle is marked (e.g., 20th, 10th, 5th) directly from the indicator settings using the "Candle Number to Mark (from end)" input.
Clear Visuals: Both the candle color and a small arrow provide a subtle, yet effective, visual cue.
How to use:
Simply add this script to your TradingView chart. Then, open the indicator's settings to set your desired candle number.

Smart Bar Counter with Alerts🚀 Smart Bar Counter with Alerts 🚀
-----------------------------------------------------
Overview
-----------------------------------------------------
Ever wanted to count a specific number of bars from a key point on your chart—such as after a Break of Structure (BOS), the start of a new trading session, or from any point of interest— without having to stare at the screen?
This "Smart Bar Counter" indicator was created to solve this exact problem. It's a simple yet powerful tool that allows you to define a custom "Start Point" and a "Target Bar Count." Once the target count is reached, it can trigger an Alert to notify you immediately.
-----------------------------------------------------
Key Features
-----------------------------------------------------
• Manual Start Point: Precisely select the date and time from which you want the count to begin, offering maximum flexibility in your analysis.
• Custom Bar Target: Define exactly how many bars you want to count, whether it's 50, 100, or 200 bars.
• On-Chart Display: A running count is displayed on each bar after the start time, allowing you to visually track the progress.
• Automatic Alerts: Set up alerts to be notified via TradingView's various channels (pop-up, mobile app, email) once the target count is reached.
-----------------------------------------------------
How to Use
-----------------------------------------------------
1. Add this indicator to your chart.
2. Go to the indicator's Settings (Gear Icon ⚙️).
- Select Start Time: Set the date and time you wish to begin counting.
- Number of Bars to Count: Input your target number.
3. Set up the Alert ( Very Important! ).
- Right-click on the chart > Select " Add alert ."
- In the " Condition " dropdown, select this indicator: Smart Bar Counter with Alerts .
- In the next dropdown, choose the available alert condition.
- Set " Options " to Once Per Bar Close .
- Choose your desired notification methods under " Alert Actions ."
- Click " Create ."
-----------------------------------------------------
Use Cases
-----------------------------------------------------
• Post-Event Analysis: Count bars after a key event like a Break of Structure (BOS) or Change of Character (CHoCH) to observe subsequent price action.
• Time-based Analysis: Use it to count bars after a market open for a specific session (e.g., London, New York).
• Strategy Backtesting: Useful for testing trading rules that are based on time or a specific number of bars.
-----------------------------------------------------
Final Words
-----------------------------------------------------
Hope you find this indicator useful for your analysis and trading strategies! Feel free to leave comments or suggestions below.

LRCLRC (Linear Regression Candle)
Overview
The LRC (Linear Regression Candle) indicator applies linear regression to the open, high, low, and close prices, creating smoothed "candles" that help filter market noise. It provides trend-confirmation signals and highlights potential reversal points based on regression crossovers.
Key Features
Smoothed Candles: Uses linear regression to calculate synthetic OHLC values, reducing noise.
Multi-Timeframe Support: Optional higher timeframe analysis for better trend confirmation.
Visual Signals: Color-coded candles and labels highlight bullish/bearish control zones.
Customizable Settings: Adjustable regression length, colors, and timeframe options.
How to Use
Signals & Interpretation
🟢 Bullish Signal (BUY): When the regression open crosses above the regression close (green candle).
🔴 Bearish Signal (SELL): When the regression open crosses below the regression close (red candle).
Control Zones:
Strong Bullish (Controlbull): Confirmed uptrend (bright green).
Bullish (Bull): Regular uptrend (light green).
Strong Bearish (Controlbear): Confirmed downtrend (dark red).
Bearish (Bear): Regular downtrend (orange).
Neutral (Gray): No clear trend.
Recommended Settings
Linear Regression Length: Default 8 (adjust for sensitivity).
Timeframe: Default current chart, but can switch to higher timeframes (e.g., 1D, 1W).
Bar Colors: Toggle on/off for visual clarity.
Labels: Displays "Control" markers at key reversal points.
Example Use Cases
Trend Confirmation: Use higher timeframe LRC to validate the primary trend.
Reversal Signals: Watch for BUY/SELL crossovers with strong color confirmation.
Noise Reduction: Helps avoid false breakouts in choppy markets.

Candle Breakout Oscillator [LuxAlgo]The Candle Breakout Oscillator tool allows traders to identify the strength and weakness of the three main market states: bullish, bearish, and choppy.
Know who controls the market at any given moment with an oscillator display with values ranging from 0 to 100 for the three main plots and upper and lower thresholds of 80 and 20 by default.
🔶 USAGE
The Candle Breakout Oscillator represents the three main market states, with values ranging from 0 to 100. By default, the upper and lower thresholds are set at 80 and 20, and when a value exceeds these thresholds, a colored area is displayed for the trader's convenience.
This tool is based on pure price action breakouts. In this context, we understand a breakout as a close above the last candle's high or low, which is representative of market strength. All other close positions in relation to the last candle's limits are considered weakness.
So, when the bullish plot (in green) is at the top of the oscillator (values above 80), it means that the bullish breakouts (close below the last candle low) are at their maximum value over the calculation window, indicating an uptrend. The same interpretation can be made for the bearish plot (in red), indicating a downtrend when high.
On the other hand, weakness is indicated when values are below the lower threshold (20), indicating that breakouts are at their minimum over the last 100 candles. Below are some examples of the possible main interpretations:
There are three main things to look for in this oscillator:
Value reaches extreme
Value leaves extreme
Bullish/Bearish crossovers
As we can see on the chart, before the first crossover happens the bears come out of strength (top) and the bulls come out of weakness (bottom), then after the crossover the bulls reach strength (top) and the bears weakness (bottom), this process is repeated in reverse for the second crossover.
The other main feature of the oscillator is its ability to identify periods of sideways trends when the sideways values have upper readings above 80, and trending behavior when the sideways values have lower readings below 20. As we just saw in the case of bullish vs. bearish, sideways values signal a change in behavior when reaching or leaving the extremes of the oscillator.
🔶 DETAILS
🔹 Data Smoothing
The tool offers up to 10 different smoothing methods. In the chart above, we can see the raw data (smoothing: None) and the RMA, TEMA, or Hull moving averages.
🔹 Data Weighting
Users can add different weighting methods to the data. As we can see in the image above, users can choose between None, Volume, or Price (as in Price Delta for each breakout).
🔶 SETTINGS
Window: Execution window, 100 candles by default
🔹 Data
Smoothing Method: Choose between none or ten moving averages
Smoothing Length: Length for the moving average
Weighting Method: Choose between None, Volume, or Price
🔹 Thresholds
Top: 80 by default
Bottom: 20 by default

VWAP + Candle-Rating SELL (close, robust)This multi‐timeframe setup first scans the 15-minute chart for strong bearish candles (body position in the bottom 40% of their range, i.e. rating 4 or 5) that close below the session VWAP. When it finds the first such “setup” of a trading period, it pins the low of that 15-minute candle as a trigger level and draws a persistent red line there. On the 5-minute chart, the strategy then waits for a similarly strong bearish candle (rating 4 or 5) to close below that marked low—at which point it emits a one‐time SELL signal. The trigger level remains in place (and additional sell signals are locked out) until the market “rescues” the price: a 15-minute bullish candle (rating 1 or 2) closing back above VWAP clears the old setup and allows the next valid bearish 15-minute candle to form a new trigger. This design ensures you only trade the most significant breakdowns after a clear bearish bias and avoids repeated signals until a genuine bullish reversal resets the system.

Moving Average Candles**Moving Average Candles — MA-Based Smoothed Candlestick Overlay**
This script replaces traditional price candles with smoothed versions calculated using various types of moving averages. Instead of plotting raw price data, each OHLC component (Open, High, Low, Close) is independently smoothed using your selected moving average method.
---
### 📌 Features:
- Choose from 13 MA types: `SMA`, `EMA`, `RMA`, `WMA`, `VWMA`, `HMA`, `T3`, `DEMA`, `TEMA`, `KAMA`, `ZLEMA`, `McGinley`, `EPMA`
- Fully configurable moving average length (1–1000)
- Color-coded candles based on smoothed Open vs Close
- Works directly on price charts as an overlay
---
### 🎯 Use Cases:
- Visualize smoothed market structure more clearly
- Reduce noise in price action for better trend analysis
- Combine with other indicators or strategies for confluence
---
> ⚠️ **Note:** Since all OHLC values are based on moving averages, these candles do **not** represent actual market trades. Use them for trend and structure analysis, not trade entries based on precise levels.
---
*Created to support traders seeking a cleaner visual representation of price dynamics.*

CRT with Trend FilterExplanation of Functionality
The CRT RED DOG with Trend Filter indicator is a tool used to identify buy and sell signals on a price chart. It filters signals based on the market trend to ensure higher accuracy.
Main Components of the Indicator
Moving Average (EMA) Settings
Users can set the moving average (EMA) length as desired, with a default value of 50 days.
This moving average is used to determine the market trend.
Determining Market Trend
Uptrend: Occurs when the closing price is above the moving average.
Downtrend: Occurs when the closing price is below the moving average.
Identifying Buy and Sell Signals
Buy Signal: Occurs when the current bar's low is lower than the previous bar's low, and the closing price is higher than the previous bar's close, during an uptrend.
Sell Signal: Occurs when the current bar's high is higher than the previous bar's high, and the closing price is lower than the previous bar's close, during a downtrend.
Displaying Signals on the Chart
Buy signals are displayed with a green arrow below the candlestick.
Sell signals are displayed with a red arrow above the candlestick.
Time frame Day >> 15M

Big Candles FilterHow It Works
A candle is considered "big" only if its body (distance from open to close) exceeds the barHeight value.
** NOT calculated by Range !!!
Features :
Bullish candles (close > open) are marked with a green "Buy" triangle if the body is large enough.
Bearish candles (close < open) are marked with a red "Sell" triangle if the body is large enough.
The bars are colored for big candles, and optional labels show the open and close prices.

BBr1 Candle Range Volitility Gap IndicatorModified Candle Range Volatility Gap Indicator
1. Useful to analyze bars body and wicks and volatility of security.
2. Added a Percentage Option - easier to analyze across different securities.
2. Added a Standard Deviation ("1 std dev= 68.2%, 2 std dev=95.4%, 3 std dev=99.7%, etc") based upon user defined lookback period.
3. Added the ability to include Gaps in Analysis. (Gaps are when the prior closing cost does not equal opening price)
4. Possible Uses setting up stop losses, trailing entries/exits (inside range or outside range).
5. Use it with other indicators in determining if to make an entry or close entry.
Reposted Original Description by © ka66 Kamal Advani
Visually shows the Body Range (open to close) and Candle Range (high to low).
Semi-transparent overlapping area is the full Candle Range, and fully-opaque smaller area is the Body Range. For aesthetics and visual consistency, Candle Range follows the direction of the Body Range, even though technically it's always positive (high - low).
The different plots for each range type also means the UI will allow deselecting one or the other as needed. For example, some strategies may care only about the Body Range, rather than the entire Candle Range, so the latter can be hidden to reduce noise.
Threshold horizontal lines are plotted, so the trader can modify these high and low levels as needed through the user interface. These need to be configured to match the instrument's price range levels for the timeframe. The defaults are pretty arbitrary for +/- 0.0080 (80 pips in a 4-decimal place forex pair). Where a range reaches or exceeds a threshold, it's visually marked as well with a shape at the Body or Candle peak, to assist with quicker visual potential setup scanning, for example, to anticipate a following reversal or continuation.

EBP Candle Marker### **EBP Candle Marker – TradingView Indicator**
The **EBP Candle Marker** is a specialized TradingView indicator designed to identify and highlight potential liquidity sweep candles. This indicator visually emphasizes key price action patterns where the market sweeps previous highs or lows and closes in the opposite direction, often signaling potential reversals or liquidity grabs.
---
### 📊 **Indicator Logic:**
1. **Bullish Sweep:**
- The current candle’s **low** is lower than the previous candle’s **low** (indicating a liquidity sweep).
- The **close** is above both the **open** and **close** of the previous candle.
2. **Bearish Sweep:**
- The current candle’s **high** is higher than the previous candle’s **high** (indicating a liquidity sweep).
- The **close** is below both the **open** and **close** of the previous candle.
---
### 🎨 **Visual Representation:**
- **Yellow Candle Body:** Highlights any candle meeting the bullish or bearish sweep conditions.
---
### 🔔 **Alert Functionality:**
The indicator supports setting custom alerts in TradingView for:
- **Bullish Sweep Detected** – Notifies when a bullish sweep occurs.
- **Bearish Sweep Detected** – Notifies when a bearish sweep occurs.
These alerts are compatible across any timeframe, providing flexibility to monitor key market conditions.
---
### 📈 **Use Cases:**
- **Liquidity Sweep Detection:** Identify areas where the market may be triggering stop-loss orders or liquidity hunts.
- **Reversal Confirmation:** Enhance trade confirmation by identifying potential reversal zones.
- **Scalping & Swing Trading:** Suitable for both short-term and long-term trading strategies across multiple timeframes.

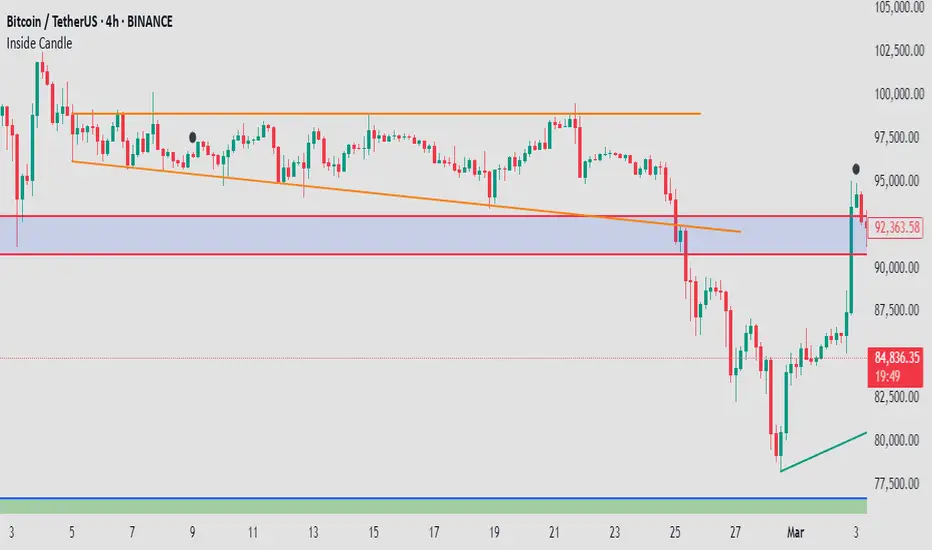
Mushir's Inside Candle IndicatorThis indicator detects inside candle formations on the chart’s current timeframe. It highlights when a candle’s range is fully engulfed by the previous candle’s range, provided the previous candle meets specific criteria.
How It Works ?
It shows the formation of inside candle on the charts to help in find trades.
Mother Candle Validation
The previous candle must be a “leg candle” with a strong body and minimal wicks relative to its body size, ensuring a robust structure.
Inside Candle Detection
The current candle qualifies as an inside candle if:
Its high is ≤ the previous candle’s high.
Its low is ≥ the previous candle’s low.
Why Use This Indicator?
Adapts to the chart’s current timeframe—no manual adjustments needed.
Easily gives you the identification of inside candles
Minimalistic Design
Better results in trending market
How to use it?
- when the inside candle is formed there are certain conditions:
1. if the next candle first crosses the high of inside candle, look for a potential buy trade with RR as 2:1 while stoploss being just below the low of inside candle.
2. if the next candle first crosses the low of inside candle, look for a potential sell trade with RR as 2:1 while stoploss being just above the high of inside candle.
3. if 2:1 is achieved, then increase the partial target to 3:1 while bringing the stoploss to the entry point.
4. if the high is crossed first and then the low is crossed or vice versa then the trade is invalidated.
Happy Trading!
Candle Momentum ExhaustionCandle Momentum Exhaustion
The Candle Momentum Exhaustion indicator is designed to help traders spot potential turning points in a trend by identifying when the prevailing momentum may be “running on empty.” The indicator works by comparing the size of each candle’s body (the absolute difference between the open and close) to the average body size over a recent period. When a candle’s body exceeds a user‐defined multiple of this average, it is flagged as an “exhaustion” candle.
• A bullish exhaustion (shown with a red down–facing triangle above the bar) occurs when a very large bullish candle (close > open) is detected, suggesting that buyers may have pushed the price too far and the rally could be near its end.
• A bearish exhaustion (shown with a green up–facing triangle below the bar) occurs when a very large bearish candle (close < open) is detected, implying that selling pressure might be overdone.
These signals can alert you to a potential reversal or consolidation point. The script also includes alert conditions so that you can set up notifications whenever an exhaustion signal is generated.
How It Works
1. Average Candle Body:
The script computes a simple moving average (SMA) of the absolute candle bodies over a user-defined period (default is 14 bars).
2. Exhaustion Candidate:
A candle is flagged as an exhaustion candidate if its body size exceeds the average by more than the set multiplier (default is 2.0).
3. Signal Identification:
• If the exhaustion candle is bullish (close > open), it is marked with a red down–facing triangle above the bar.
• If it is bearish (close < open), it is marked with a green up–facing triangle below the bar.
4. Alerts:
The built-in alertcondition() calls allow you to set alerts (via TradingView’s alert system) so that you can be notified when an exhaustion event occurs.
Risk Disclaimer:
This indicator is provided for educational and informational purposes only and does not constitute financial, investment, or trading advice. Trading and investing involve significant risk, and you should not rely solely on this indicator when making any trading decisions. Past performance is not indicative of future results. Always perform your own due diligence and consult with a qualified financial advisor before making any financial decisions. The creator of this indicator shall not be held responsible for any losses incurred through its use.

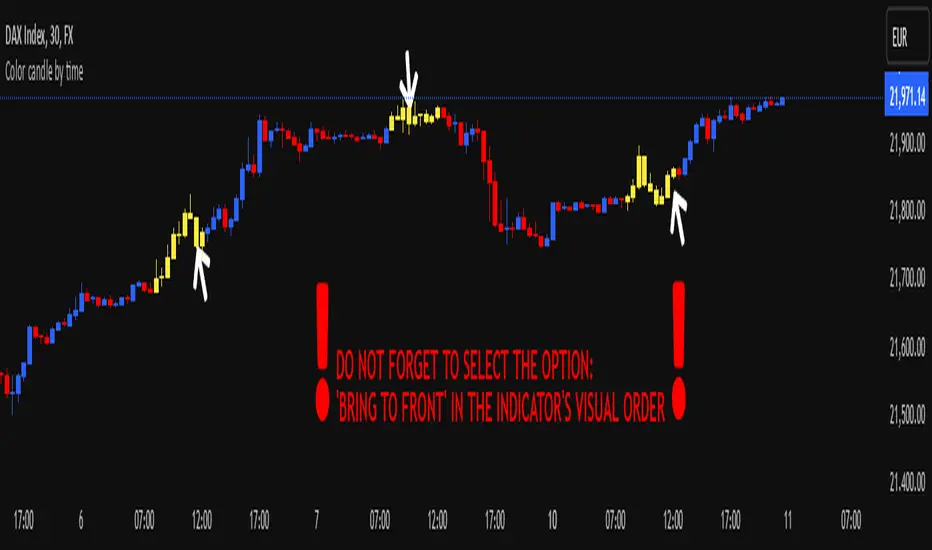
Color candle by time
This indicator, written in Pine Script v5, allows you to highlight candles (using a user-selected color) that fall within a user-defined time range. Candles outside this range maintain their original appearance.
How it Works and Key Benefits:
- Time Interval Customization: By specifying start and end hours/minutes, you can emphasize only the desired market session.
- Choice of Preferred Color: The body, wicks, and borders of the candles within the selected range are uniformly colored, based on the user’s chosen tone.
- Enhanced Focus on Price Action: By focusing on the most relevant trading hours, your analysis becomes more streamlined and intuitive, without altering the rest of the session’s candle appearance.
!! DO NOT FORGET TO SELECT THE OPTION: 'BRING TO FRONT' IN THE INDICATOR'S VISUAL ORDER !!
BullDozz MA-CandlesticksBullDozz MA-Candlesticks 🏗️📊
The BullDozz MA-Candlesticks indicator transforms traditional candlesticks by replacing their Open, High, Low, and Close values with various types of Moving Averages (MAs). This helps traders visualize market trends with smoother price action, reducing noise and enhancing decision-making.
🔹 Features:
✅ Choose from multiple MA types: SMA, EMA, WMA, DEMA, TEMA, LSMA
✅ Customizable MA period for flexibility
✅ Candlestick colors based on trend: Green for bullish, Red for bearish
✅ Works on any market and timeframe
This indicator is perfect for traders who want a clearer perspective on price movement using moving average-based candlesticks. 🚀 Try it now and refine your market analysis! 📈🔥

Bull vs Bear CandlesThe Bull vs Bear Candles indicator helps you analyze market sentiment by counting and comparing bullish and bearish candles. It tracks the number of bullish candles and calculates their percentage, then does the same for bearish candles. Based on this data, the indicator determines whether bulls or bears are in control. Additionally, it counts the total number of candles within the selected range, giving you a clearer picture of price action. Use this tool to quickly assess market trends and make more informed trading decisions. 🚀

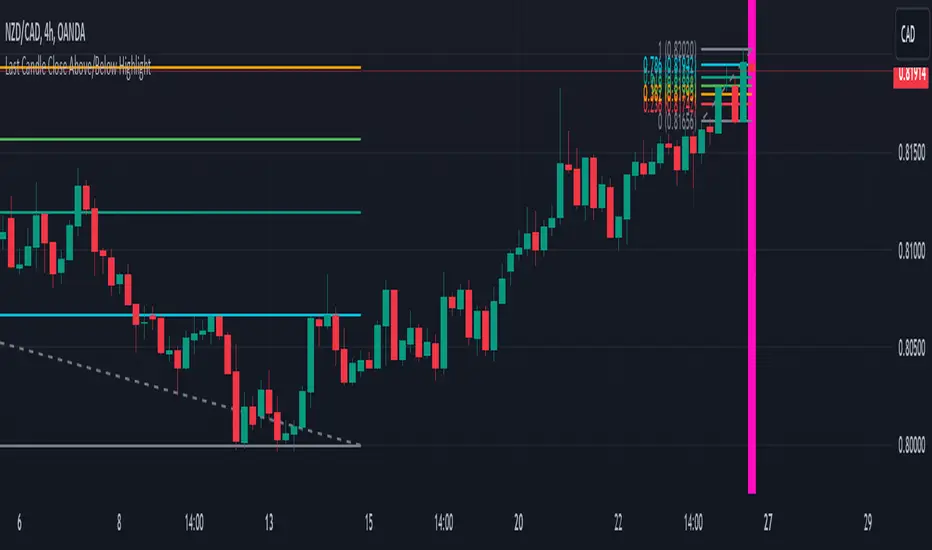
Last Candle Close Above/Below AlertHow it works:
The script calculates whether the close of each candle is above or below the close of the previous candle, same as the initial code.
isLastBar is checked and the last candle to be created is the only one that will receive the condition from this variable.
If a highlight is needed it will use this criteria and apply the correct color for the last candle only, and any other candle will not be colored.
If alerts are enabled they will only work for the last bar too.
How to Use:
Add this script to your TradingView chart.
Use the inputs to set the desired timeframe to analyze, whether you want an alert for candles closing above or closing below and the background colors.
The last candle will highlight yellow when the close is higher or lower than the previous candle.
Alerts will be triggered on the last candle if you enable the alert conditions.
Key Features:
Timeframe Selection: You can choose a different timeframe in the settings.
Candle Highlight: Candles that close above or below the previous candle are highlighted in yellow.
Alerts: Alerts are configurable to trigger for "Close Above" or "Close Below" conditions, based on your selection in the settings.
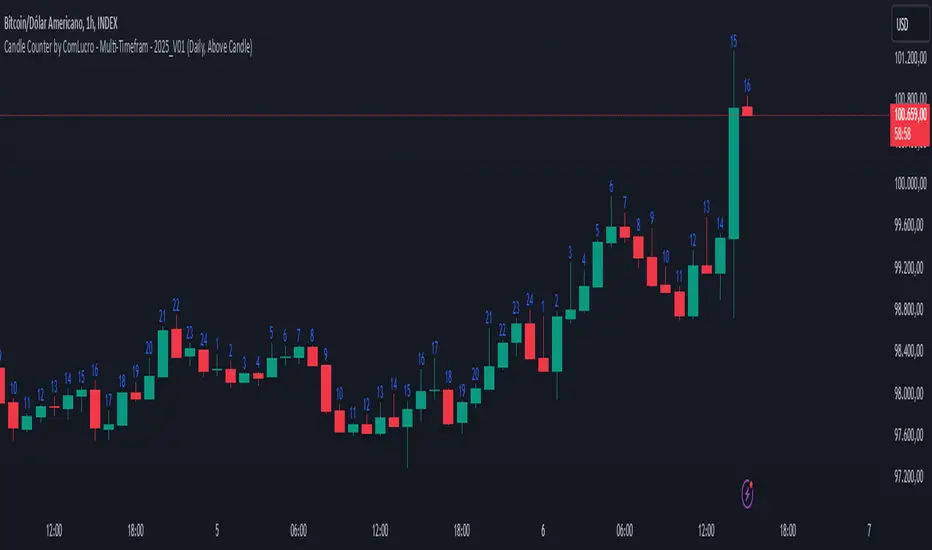
Candle Counter by ComLucro - Multi-Timefram - 2025_V01Candle Counter by ComLucro - Multi-Timeframe - 2025_V01
The Candle Counter by ComLucro - Multi-Timeframe is a highly customizable tool designed to help traders monitor the number of candles across various timeframes directly on their charts. Whether you're analyzing trends or tracking specific market behaviors, this indicator provides a seamless and efficient way to enhance your technical analysis.
Key Features:
Flexible Timeframe Selection: Track candle counts on yearly, monthly, weekly, daily, or hourly intervals to suit your trading style.
Dynamic Label Positioning: Choose to display labels above or below candles, offering greater control over your chart layout.
Customizable Colors: Adjust label text colors to match your chart's aesthetics and improve visibility.
Clean and Organized Visualization: Automatically generates labels for each candle without overcrowding your chart.
How It Works:
Select a Timeframe: Choose from yearly, monthly, weekly, daily, or hourly intervals based on your analysis needs.
Automatic Counting: The indicator calculates and displays the number of candles for the selected period directly on your chart.
Label Customization: Adjust the position (above or below the candles) and color of the labels to align with your preferences.
Why Use This Indicator?
This script is perfect for traders who need a clear and visual representation of candle counts in specific timeframes. Whether you're monitoring trends, evaluating price action, or developing strategies, the Candle Counter by ComLucro adapts to your needs and helps you make informed decisions.
Disclaimer:
This script is intended for educational and informational purposes only. It does not constitute financial advice. Always practice responsible trading and ensure this tool aligns with your strategies and risk management practices.
About ComLucro:
ComLucro is dedicated to providing traders with practical tools and educational resources to improve decision-making in the financial markets. Discover other scripts and strategies developed to enhance your trading experience.
Volume Delta Candles HTF [TradingFinder] LTF Volume Candles 🔵 Introduction
In financial markets, understanding the concepts of supply and demand and their impact on price movements is of paramount importance. Supply and demand, as fundamental pillars of economics, reflect the interaction between buyers and sellers.
When buyers' strength surpasses that of sellers, demand increases, and prices tend to rise. Conversely, when sellers dominate buyers, supply overtakes demand, causing prices to drop. These interactions play a crucial role in determining market trends, price reversal points, and trading decisions.
Volume Delta Candles offer traders a practical way to visualize trading activity within each candlestick. By integrating data from lower timeframes or live market feeds, these candles eliminate the need for standalone volume indicators.
They present the proportions of buying and selling volume as intuitive colored bars, making it easier to interpret market dynamics at a glance. Additionally, they encapsulate critical metrics like peak delta, lowest delta, and net delta, allowing traders to grasp the market's internal order flow with greater precision.
In financial markets, grasping the interplay between supply and demand and its influence on price movements is crucial for successful trading. These fundamental economic forces reflect the ongoing balance between buyers and sellers in the market.
When buyers exert greater strength than sellers, demand dominates, driving prices upward. Conversely, when sellers take control, supply surpasses demand, and prices decline. Understanding these dynamics is essential for identifying market trends, pinpointing reversal points, and making informed trading decisions.
Volume Delta Candles provide an innovative method for evaluating trading activity within individual candlesticks, offering a simplified view without relying on separate volume indicators. By leveraging lower timeframe or real-time data, this tool visualizes the distribution of buying and selling volumes within a candle through color-coded bars.
This visual representation enables traders to quickly assess market sentiment and understand the forces driving price action. Buyer and seller strength is a critical concept that focuses on the ratio of buying to selling volumes. This ratio not only provides insights into the market's current state but also serves as a leading indicator for detecting potential shifts in trends.
Traders often rely on volume analysis to identify significant supply and demand zones, guiding their entry and exit strategies. Delta Candles translate these complex metrics, such as Maximum Delta, Minimum Delta, and Final Delta, into an easy-to-read visual format using Japanese candlestick structures, making them an invaluable resource for analyzing order flows and market momentum.
By merging the principles of supply and demand with comprehensive volume analysis, tools like the indicator introduced here offer unparalleled clarity into market behavior. This indicator calculates the relative strength of supply and demand for each candlestick by analyzing the ratio of buyers to sellers.
🔵 How to Use
The presented indicator is a powerful tool for analyzing supply and demand strength in financial markets. It helps traders identify the strengths and weaknesses of buyers and sellers and utilize this information for better decision-making.
🟣 Analyzing the Highest Volume Trades on Candles
A unique feature of this indicator is the visualization of price levels with the highest trade volume for each candlestick. These levels are marked as black lines on the candles, indicating prices where most trades occurred. This information is invaluable for identifying key supply and demand zones, which often act as support or resistance levels.
🟣 Trend Confirmation
The indicator enables traders to confirm bullish or bearish trends by observing changes in buyer and seller strength. When buyer strength increases and demand surpasses supply, the likelihood of a bullish trend continuation grows. Conversely, decreasing buyer strength and increasing seller strength may signal a potential bearish trend reversal.
🟣 Adjusting Timeframes and Calculation Methods
Users can customize the indicator's candlestick timeframe to align with their trading strategy. Additionally, they can switch between moving average and current candle modes to achieve more precise market analysis.
This indicator, with its accurate and visual data display, is a practical and reliable tool for market analysts and traders. Using it can help traders make better decisions and identify optimal entry and exit points.
🔵 Settings
Lower Time Frame Volume : This setting determines which timeframe the indicator should use to identify the price levels with the highest trade volume. These levels, displayed as black lines on the candlesticks, indicate prices where the most trades occurred.
It is recommended that users align this timeframe with their primary chart’s timeframe.
As a general rule :
If the main chart’s timeframe is low (e.g., 1-minute or 5-minute), it is better to keep this setting at a similarly low timeframe.
As the main chart’s timeframe increases (e.g., daily or weekly), it is advisable to set this parameter to a higher timeframe for more aligned data analysis.
Cumulative Mode :
Current Candle : Strength is calculated only for the current candlestick.
EMA (Exponential Moving Average) : The strength is calculated using an exponential moving average, suitable for identifying longer-term trends.
Calculation Period : The default period for the exponential moving average (EMA) is set to 21. Users can modify this value for more precise analysis based on their specific requirements.
Ultra Data : This option enables users to view more detailed data from various market sources, such as Forex, Crypto, or Stocks. When activated, the indicator aggregates and displays volume data from multiple sources.
🟣 Table Settings
Show Info Table : This option determines whether the information table is displayed on the chart. When enabled, the table appears in a corner of the chart and provides details about the strength of buyers and sellers.
Table Size : Users can adjust the size of the text within the table to improve readability.
Table Position : This setting defines the table’s placement on the chart.
🔵 Conclusion
The indicator introduced in this article is designed as an advanced tool for analyzing supply and demand dynamics in financial markets. By leveraging buyer and seller strength ratios and visually highlighting price levels with the highest trade volume, it aids traders in identifying key market zones.
Key features, such as adjustable analysis timeframes, customizable calculation methods, and precise volume data display, allow users to tailor their analyses to market conditions.
This indicator is invaluable for analyzing support and resistance levels derived from trade volumes, enabling traders to make more accurate decisions about entering or exiting trades.
By utilizing real market data and displaying the highest trade volume lines directly on the chart, it provides a precise perspective on market behavior. These features make it suitable for both novice and professional traders aiming to enhance their analysis and trading strategies.
With this indicator, traders can gain a better understanding of supply and demand dynamics and operate more intelligently in financial markets. By combining volume data with visual analysis, this tool provides a solid foundation for effective decision-making and improved trading performance. Choosing this indicator is a significant step toward refining analysis and achieving success in complex financial markets.

Dynamic Time Period CandlesThis indicator gives the dynamic history of the current price over various time frames as a series of candles on the right of the display, with optional lines on the chart, so that you can assess the current trend more easily.
In the library I found lots of indicators that looked at the previous xx time period candle, but they then immediately switched to the new xx time candle when it started to be formed. This indicator looks back at the rolling previous time period. With this indicator, you can clearly see how price has been behaving over time.
IMPORTANT SETUP INFO:
Initially, you must go into the settings and select the timeframe (in minutes) that your chart is displaying. If you don't do this then the indicator will look back the wrong number of candles and give you totally wrong results.
You can then setup how high you want the candle labels to be on the chart.
Then you can select settings for each candle that you want displayed. Anywhere between 1 and 5 different timeframes can be displayed on the chart at once.
I initially published an indicator called 'Dynamic 4-Hour Candle (Accurate Highs and Lows)', but this new indicator is so different that it needs to be forked and published as a separate indicator. The reasons for this are below:
The original indicator only looked at the previous 4 hour time period. This indicator allows the user to select any time period that they choose.
The original indicator only looked at one time period. This indicator allows to select between one and five time periods on the chart at once.
The original indicator did not put lines on the chart to show the lookback period and the highs and lows of that time period. This indicator does both those things.
The name of the original indicator in no way now describes what this new indicator is capable of, and would be very misleading to anyone who came across it. This new indicator has a name that much more accurately reflects what its' purpose and functionality is.

First 5 Minutes Open/Close LinesThis very simple indicator paints lines at the high and low of the first 5m candle of the session. It is primarily intended for big cap NYSE traded stocks with high volume. I wrote this indicator to save me the trouble of manually drawing the lines each day.
The lines drawn at the 5m high/low will remain constant regardless of which timeframe you switch to. In the example screenshot, we are looking at the 1m timeframe. This helps us switch effortlessly between different timeframes to see if a given price movement meets our entry criteria.
In addition to drawing lines at the first 5m high/low, it will optionally paint two zones, one each around the high and low. The boundaries of this zone are configurable and expressed as a percentage of the total movement of the first 5m bar. By default, it is set to 25%.
This indicator is based on the concept that the first 5m bar always has massive volume which helps us infer that price may react around the extremes of that movement. The basic strategy works something like this:
- You identify the high timeframe (HTF) trend direction of the stock
- You wait for the first 5m candle of the session to close
- You wait for price to puncture through the outer boundary of the zone marked by the indicator.
- You enter when price retraces to the high, or low, which marks the midpoint of the punctured zone.
- Only enter long on stocks in a HTF uptrend, and short on stocks in an HTF downtrend.
- Use market structure to identify stop loss and take profit targets
Note: Use at your own risk. This indicator and the strategy described herein are not in any way financial advice, nor does the author of this script make any claims about the effectiveness of this strategy, which may depend highly on the discretion and skill of the trader executing it, among many other factors outside of the author's control. The author of this script accepts no liability, and is not responsible for any trading decisions that you may or may not make as a result of this indicator. You should expect to lose money if using this indicator.

ICT Setup 02 [TradingFinder] Breaker Blocks + Reversal Candles🔵 Introduction
The "Breaker Block" concept, widely utilized in ICT (Inner Circle Trader) technical analysis, is a crucial tool for identifying reversal points and significant market shifts. Originating from the "Order Block" concept, Breaker Blocks help traders pinpoint support and resistance levels. These blocks are essential for understanding market trends and recognizing optimal entry and exit points.
A Breaker Block is essentially a failed Order Block that changes its role when price action breaks through it. When an Order Block fails to hold as a support or resistance level, it reverses its function, becoming a Breaker Block.
There are two primary types : Bullish Breaker Blocks and Bearish Breaker Blocks. These Breaker Blocks align with the prevailing market trend and indicate potential entry points after a liquidity sweep or a shift in market structure.
Understanding and applying the Breaker Block strategy enables traders to capitalize on the behavior of institutional investors, enhancing their trading outcomes.
Bullish Setup :
Bearish Setup :
🔵 How to Use
The ICT Setup 02 indicator designed to automate the identification of Bullish and Bearish Breaker Blocks. This tool enables traders to easily spot these blocks on a chart and utilize them for entering or exiting trades. Below is a breakdown of how to use this indicator in both bullish and bearish setups.
🟣 Bullish Breaker Block Setup
A Bullish Breaker Block setup is identified in an uptrend, where it serves as a potential entry point. This setup occurs when a Bearish Order Block fails and the price moves above the high of that Order Block. In this scenario, the previously bearish Order Block turns into a Bullish Breaker Block, which now acts as a support level for the price.
To trade a Bullish Breaker Block, wait for the price to retest this newly formed support level. Confirmation of the uptrend can be achieved by analyzing lower time frames for further market structure shifts or other bullish indicators.
A successful retest of the Bullish Breaker Block provides a high-probability entry point for a long trade, as it signals institutional support. Traders often place their stop-loss below the low of the Breaker Block zone to minimize risk.
🟣 Bearish Breaker Block Setup
A Bearish Breaker Block setup, conversely, is used in a downtrend to identify potential sell opportunities. This setup forms when a Bullish Order Block fails, and the price moves below the low of that Order Block.
Once this Order Block is broken, it reverses its role and becomes a Bearish Breaker Block, providing resistance to the price as it pushes downward. For a Bearish Breaker Block trade, wait for the price to retest this resistance level.
A confirmation of the downtrend, such as a market structure shift on a lower time frame or additional bearish signals, strengthens the setup. The Bearish Breaker Block retest provides an opportunity to enter a short position, with a stop-loss placed just above the high of the Breaker Block zone.
🔵 Settings
Pivot Period : This setting controls the look-back period used to identify pivot points that contribute to the detection of Order Blocks. A higher period captures longer-term pivots, while a lower period focuses on more recent price action. Adjusting this parameter allows traders to fine-tune the indicator to match their trading time frame.
Breaker Block Validity Period : This setting defines how long a Breaker Block remains valid based on the number of bars elapsed since its formation. Increasing the validity period keeps Breaker Blocks active for a longer duration, which can be useful for higher time frame analysis.
Mitigation Level BB : This option lets traders choose the level of the Order Block at which the price is expected to react. Options like "Proximal," "50% OB," and "Distal" adjust the zone where a reaction may occur, offering flexibility in setting up the entry and stop-loss levels.
Breaker Block Refinement : The refinement option refines the Breaker Block zone to display a more precise range for aggressive or defensive trading approaches. The "Aggressive" mode provides a tighter range for risk-tolerant traders, while the "Defensive" mode expands the zone for those with a more conservative approach.
🔵 Conclusion
The Breaker Block indicator provides traders with a sophisticated tool for identifying key reversal zones in the market. By leveraging Breaker Blocks, traders can gain insights into institutional order flow and predict critical support and resistance levels.
Using Breaker Blocks in conjunction with other ICT concepts, like Fair Value Gaps or liquidity sweeps, enhances the reliability of trading signals. This indicator empowers traders to make informed decisions, aligning their trades with institutional moves in the market.
As with any trading strategy, it is crucial to incorporate proper risk management, using stop-losses and position sizing to minimize potential losses. The Breaker Block strategy, when applied with discipline and thorough analysis, serves as a powerful addition to any trader’s toolkit.

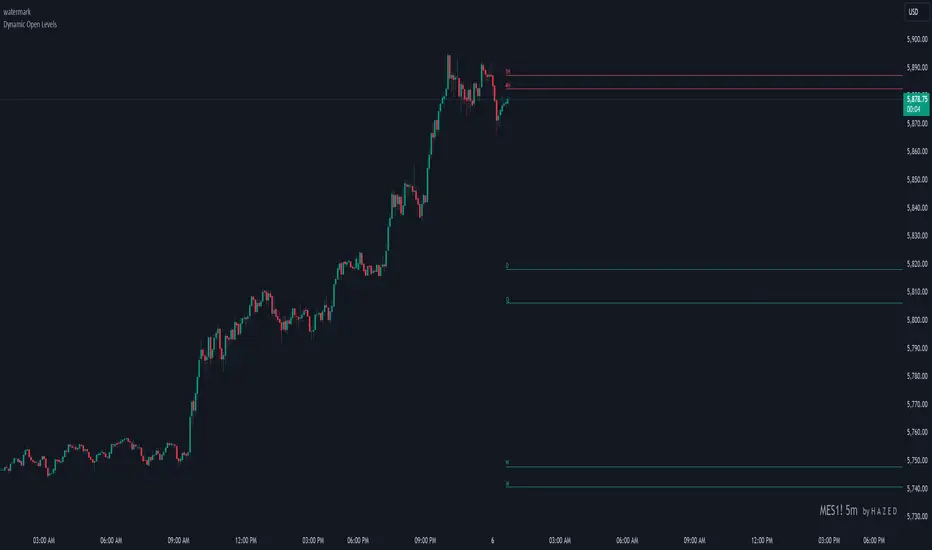
Dynamic Open Levels# Dynamic Open Levels Indicator v1.0
Release Date: November 5, 2024
Introducing the Dynamic Open Levels indicator on TradingView! This tool helps traders visualize and analyze key opening price levels across multiple timeframes, making your market analysis more effective.
---
### Key Features
- Multiple Timeframes : Yearly, Quarterly, Monthly, Weekly, Daily, 4H, and 1H levels available.
- Visibility Controls : Easily toggle visibility for each timeframe to suit your trading style.
- Line Customization : Set custom thickness and colors for lines, making charts easy to interpret.
- Monthly: Purple
- Weekly: Blue
- Daily: Green
- 4H: Red
- 1H: Orange
- Dynamic Coloring : Lines adjust color based on market conditions—teal for bullish (`rgb(34, 171, 148)`) and coral for bearish (`rgb(247, 82, 95)`).
### Labels & Customization
- Real-Time Labels : Each level is labeled for easy identification (e.g., Y for Yearly, Q for Quarterly).
- Label Settings : Customize opacity, text color, size, and position for clarity without cluttering your chart.
- Sizes : Choose from tiny, small, normal, large, to huge.
- Offset : Set labels from 1 to 10 to position them precisely.
- Color Management : Organize all colors under a dedicated Line Colors group for easy adjustments.
### Advanced Plotting & Performance
- Real-Time Updates : Levels are updated dynamically with the latest open prices.
- Extended Lines : Lines extend to the right, offering a consistent reference for future price movement.
- Optimized Performance : Handles up to 500 lines efficiently to maintain smooth performance.
---
### Installation Instructions
1. Add to Chart :
- Go to the Indicators section in TradingView.
- Search for Dynamic Open Levels and add it to your chart.
2. Customize Settings :
- Line Thickness : Adjust to suit your preference.
- Visibility : Toggle timeframes like Yearly, Monthly, Weekly, etc., as needed.
- Labels : Configure opacity, text color, size, and offset under the Label Settings group.
---
### Documentation & Support
For guidance on using the Dynamic Open Levels indicator, visit our Documentation (#). If you need assistance, check out our Support Channel (#).
---
Thank you for choosing Dynamic Open Levels . Stay tuned for future updates that will continue to improve your trading experience!
H A Z E D