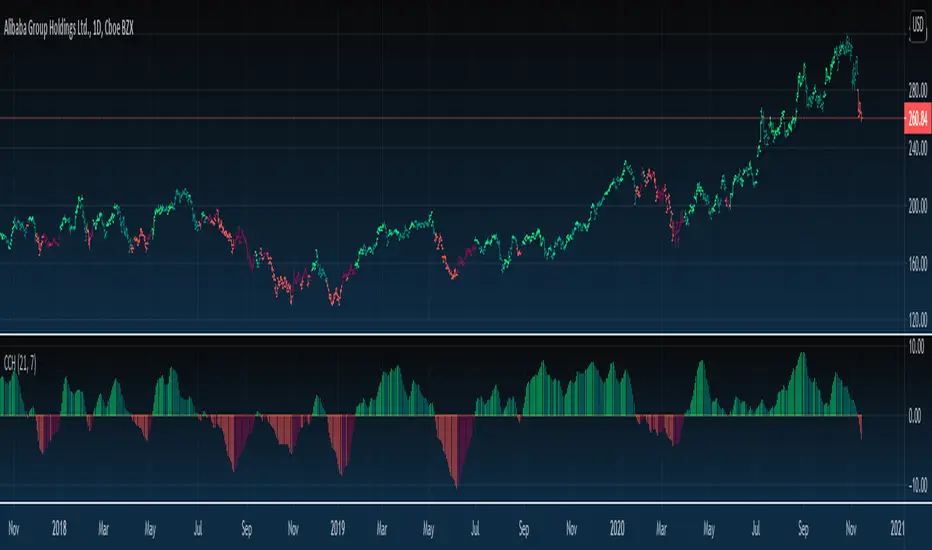
Close Counter HistogramAn interesting experiment to make an indicator act as a counter. I call it CCH - Close Counter Histogram.
It adds 1 when current close is higher than previous close and reduces -1 when current close is lower than previous close.
In the CCH settings you set how many bars to look back and use EMA to smooth the results or disable EMA smoothing.
Disable the EMA smoothing and you'll see the real deal (pure counter).
The higher the GREEN columns the more higher closes and the lower the RED columns the more lower closes.
In case columns are declining above 0 a more darker green will appear.
In case columns are declining below 0 a more darker red will appear.
Supports bar coloring (disabled by default).
Feel free to comment and Like if you like.
Enjoy :)
Calculator
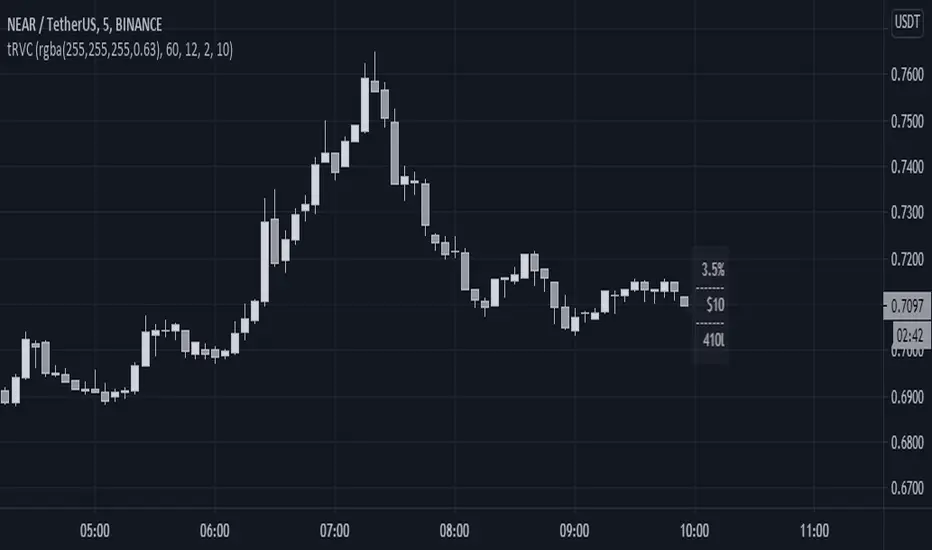
Risk Volume CalculatorBid volume calculation from average volatility
On label (top to bot):
Percents - averaged by moving in timeframe resolution
Cash - selected risk volume in usdt
Lots - bid volume in lots wich moving in Percents with used leverage is Cash
U can switch on channels to visualise volatility*2 channel or stakan settings
Position CalculatorThis script calculates how much cryptos or dollars you have to bet with 4 variables : Risk Loss , Leverage, Entry and Stop Loss.
When you want to open a position, just complete the parameters and the script will tell you how much you have to bet in dollars or cryptos units, depending the way you're trading.
Note : don't foreget that you have to pay fees on exchanges whose are not included here, specially with high leverage trades.

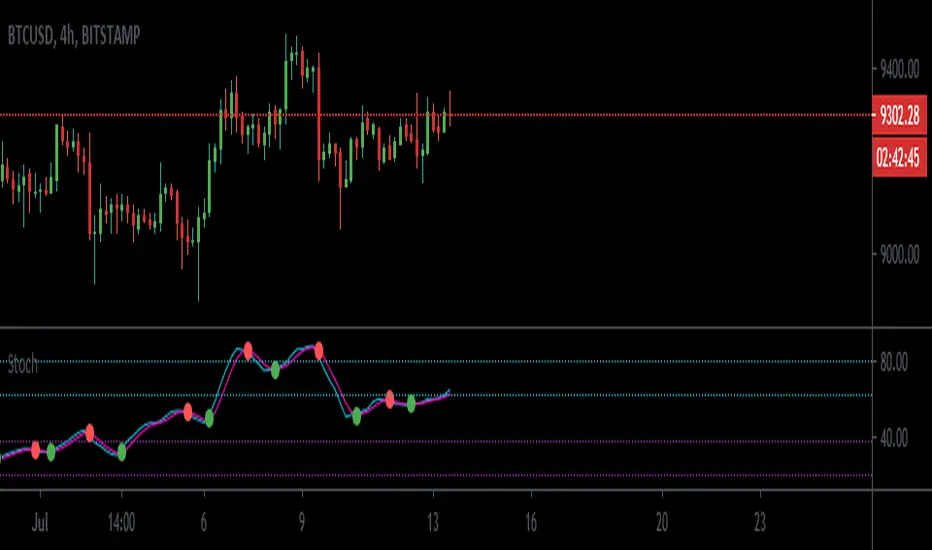
Stochastic cross up/dn calculator (Picte)This indicator will calculate the estimated price needed for the stochastic oscillator to change direction. I also included some important horizontal levels for the oscillator. When the oscillator is stuck under the upper purple horizontal we are generally bearish and when it is stuck above the lower blue horizontal we are generally bullish.
The way i like to trade with this oscillator is to see it break a particular support/resistance line and buy/sell it on a retest. I will include some photos of signals i like to take with this indicator below.
I found it useful in the Forex market and also with bitcoin. The traditional market has yet to be tested. I would recommend it being used on time frames above the hourly. It does not mean that lower time frames can not work it is just that higher time frames offer better risk/reward ratio.
signal examples:
ENJOY :)
Cracking Cryptocurrency - Quadrigo Position SizingCracking Cryptocurrency - Quadrigo Position Sizing
This indicator is designed to work in conjunction with our position sizing calculations pursuant to the Quadrigo Indicator.
This indicator will allow a trader to input their Account Balance and desired Risk % that they have decided, through their statistical analysis, provides them the greatest Return on Equity balanced against minimal draw down.
Once inputted, the Data Window will display the recommended USD Position Size. It will also pull the current price of Bitcoin, so that a recommended BTC Position Size will be calculated as well, making orders very easy to enter on exchanges that deal in BTC values for order value.
This indicator is optimized for the aesthetics of traders using TradingView's mobile app. With a simple glance you can determine your proper position size for any trade. This is helpful because the larger Quadrigo indicator can take up a lot of screen real estate when on mobile version.

Cracking Cryptocurrency - QuadrigoCracking Cryptocurrency - Quadrigo
An objective method of determining an initial Take Profit and Stop Loss, based on true market volatility and not arbitrary price levels. This indicator gives the user a powerful range of input variation, from Average to Median True Range and a myriad permutations of smoothing and look back lengths, to build an objective value from which to measure profit and stop levels.
This indicator also automatically calculates a recommended position size based on our position sizing methodology. Simply input your capital amount and desired risk level. This indicator will display your optimum position size in USD or BTC, even giving you the flexibility to select your desired exchange for BTC/USD conversion calculations.
Features & Functions
Set custom multipliers for Take Profit and Stop Loss Levels.
Select between Average or Median True Range Calculations.
Select smoothing type and look back length for True Range.
Input custom True Range Level for dialing in precise measurements.
Position Size Calculator.
Aesthetically pleasing display of Take Profit and Stop Loss Levels.
Aesthetically pleasing dashboard display of all relevant trade information including Potential Loss, Distance to Stop Loss, and TR Percentage, among other data.
Indicator displays quantity of position to be removed at each take profit for convenient order setting flow.
---
Purpose
To give clear objective stop losses and take profit levels based off price volatility rather than arbitrary price levels, percentage points, ticks, pips, etc.

LotSizeCalc_v1 (EUR)Hey there,
here I like to publish my first TradingView Script for the Indicator "LotSizeCalc" which calculates the LotSize for the currency '€' for e.g. the MT4-App depending on the following parameters:
- Stop Loss in pips (example: 30 pips)
- Account Balance in EUR (example: 500€)
- Risk in % (example: 1%)
It is very similar to the MyFxBook Calculator on their website, where you can compare the results for the lotsize.
You receive the calculated value next to the indicator, and - for mobile device - it also shows a label with the calculated lotsize (which you can deacivate via settings if you like).
The indicator works for the included common foreign Forex pairs (AUD, CAD, CHF, JPY, JPY, GBP, NZD, USD) in order to calculate the risk to a EUR-Trading Account.
Actually, the Script allows in general some adaptations due to your trading system. This one is the most basic version.
Happy pips and I wish you safe and risk-calculated trading!
Marcel :)

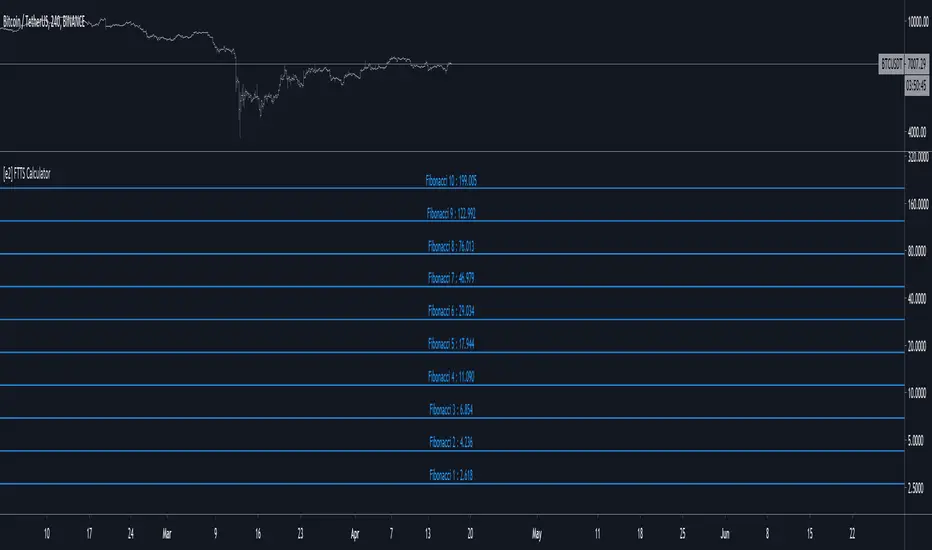
[e2] Fibonacci, Tribonacci, Tetranacci Sequence CalculatorThe script is a simple calculator to obtain numbers of Fibonacci, Tribonacci or Tetranacci Sequence.
The script contain calculations for constants (up to 16 digits) that could be used as one of the sequence's number.
The Calculator has 3 modes. Users can define the numbers to initialize the sequence in the options:
- The Fibonacci Sequence is the series of numbers, every next number is found by adding up the two numbers before it.
xn = xn-1 + xn-2
fiConst variable = Fibonacci Constant(Golden Ratio) - 1.61803...
"Classic" Sequence initialize with numbers {0, 1}. Output: 1,2,3,5,8,13,21...
To Calculate the Fibonacci Extensions the sequence should be initialized with {1, fiConst}. Output: 2.618, 4.236, 6.854...
- The Tribonacci Sequence is the series of numbers, every next number is found by adding up the three numbers before it.
xn = xn-1 + xn-2 + xn-3
trConst variable = Tribonacci Constant - 1.83929...
"Classic" Sequence initialize with numbers {0, 0, 1}. Output: 1,2,4,7,13,24...
To Calculate the Tribonacci Extensions the sequence should be initialized with {0, 1, trConst}. Output: 2.839, 5.679, 10.357...
- The Tetranacci Sequence is the series of numbers, every next number is found by adding up the four numbers before it.
xn = xn-1 + xn-2 + xn-3 + xn-4
teConst variable = Tetranacci Constant - 1.92756...
"Classic" Sequence initialize with numbers {0, 0, 0, 1}. Output: 1,2,4,8,15,29,56...
To Calculate the Tetranacci Extensions the sequence should be initialized with {0, 0, 1, teConst}. Output: 2.928, 5.855, 11.710...
The Calculator can return a single number or a set of numbers based on the selected sequence mode.
The script is made for other scripts integration rather than stand-alone usage.
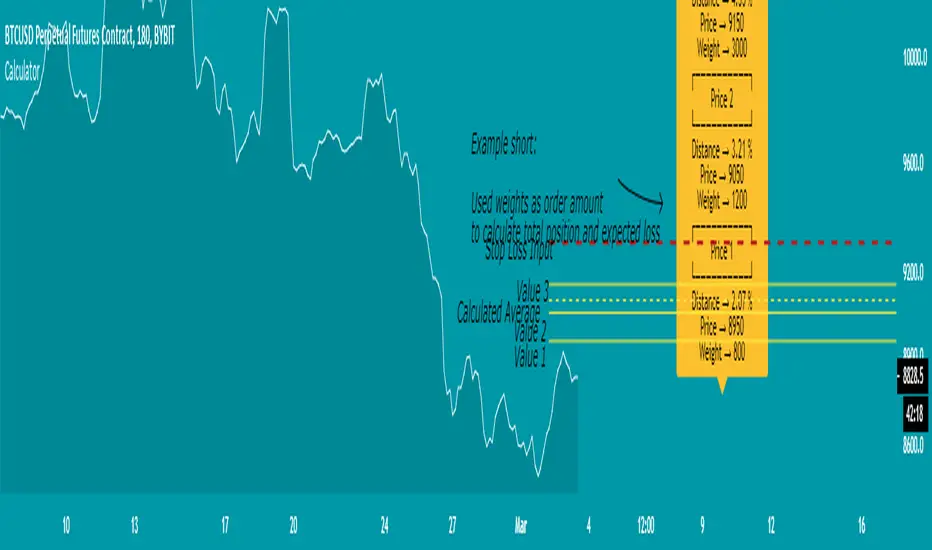
Weighted Average Calculator - evoTest version of a weighted average calculator, will make an update later with more functions and a better view.
For now it's mainly useful for getting an average value and see how you can ladder into your position,
if you use the weights as the amount you want to order, you can see the total value and expected loss in the label.
You can use the weights as percentage or any numbers you like, but expected loss won't apply to that for now (before update)
5 values and weights available
If you have ideas to add anything or find mistakes send me a message.
Megalodon Pro Advance Data CalculatorIt is designed to combine price, volume and indicator data from different brokers/exchanges. This helps us to have a more accurate data, so that we can have a better picture of the price/volume/indicators.
Features
It may combine up to 18 different data sources.
It can print indicators such as MFI, RSI, OBV, BB, Williams%R. If you have any suggestions, write them in the comment section below.
Usage
Just select the data points you would like to combine in the setting to view price, volume or indicators data.
Settings
Setting 1 defines the source you would like to use to view Only Price information.
Setting 2 defines the indicator you would like to print. OnlyPrice is the default setting which views the source information defined.
Setting 3 defines the length for RSI.
Setting 4 defines the length for MFI.
Setting 5 defines the length for Bollinger Band(BB).
Setting 6 defines the Bollinger Bands' standard deviation.
Setting 7 defines the length for Williams%R.
I hope you will find some VALUE $
~Bo
Enlightening the modern investors
Hendo's Drawdown CalculatorAre you particularly good at buying tops and selling bottoms while being terrible at math?
Then here's your solution:
A basic script that automatically calculates and plots the drawdown between the highest high (or open/close) and the current price.
Best used on the higher time frames (so you can easily see where the "top is derived from". If it's used on an asset that hasn't topped out yet (unlike 90% of the altcoins) the calculations will not work (since it's not in drawdown).
Comes with 1 setting: The source that should be used to calculate the highest point in price. Options are: High, Close or Open. I've purposely left out "low" and "HL2/OHLC4" because they don't make much sense for a script like this.
Considerate use is advised for people with weak hands. Since the numbers can be overwhelming.
If you encounter any bugs or errors feel free to leave a comment. Enjoy!

Calculator (weighted) - evoA tool to calculate the average price and position size.
The "Risk Amount" input means the amount of dollars you lose if the trade gets stopped out (it should be based on a small percentage of your account).
TIPS
- If you use the weights to calculate an average price, make sure it adds up to 100% in total or you will get a weird number.
- Keep an eye on the risk amount if you take a trade, if I ever update the script it might set back to default which will change your position size.
- I tested it all but you might trade in a different way than me, so do your own calculation for every new thing you try with it.
If you find any bug please tell me so that no one ends up with a weird calculation or position size.

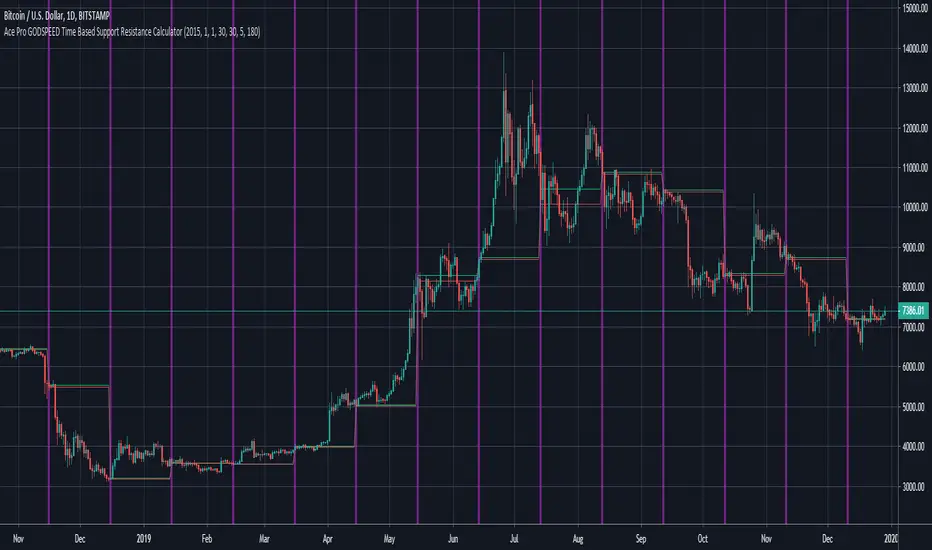
Ace Pro GODSPEED Time Based Support Resistance Calculator [FREE]The Ace Pro GODSPEED Time Based Support Resistance Calculator has two functions.
Please note that this indicator is COMPLETELY CUSTOMIZABLE - TRADERS CAN INPUT THEIR OWN VALUES TO CALCULATE S/R.
Function 1: It marks intervals of time on the daily time-frame with vertical lines as specified by the user
Function 2: It can mark support and resistances with horizontal lines as defined by a set of candles for a specified time interval
Function 1 Explanation:
To mark the intervals on the daily time-frame, traders should utilize the following options:
Start Year
Start Month
Start Date
Days Frequency
Traders can select the start date and duration of each interval. The indicator will automatically mark these intervals on the daily chart with a vertical line.
----------------------------------------------------------------------------------------------------------
Function 2 Explanation:
To mark support and resistances, traders should utilize the following options
Low Time Frame
Low Time Frame Value
High Time Frame Value
Low Time Frame = Specify the time frame on which you would like to VIEW the S/R lines
Low Time Frame Value = Select the value of the candle to take into account. For example, if you want the indicator to calculate using 5-minute candles, specify “5” as the input value. However if you want the indicator to calculate using 10-minute candles, specify “10” as the input value.
High Time Frame Value = Specify the total duration you would like S/R values calculated for before the indicator resets its calculation. For example, if you want each calculation to reset after 180 minutes, use the input value of “180”. However, if you want each calculation to reset after 90 minutes, use the input value of “90”.
IMPORTANT NOTICE: SOME EXCHANGES (CRYPTOCURRENCY) ARE MISSING DATA FOR CERTAIN DATES/PERIODS. THIS MAY AFFECT YOUR CALCULATION. THIS IS ESPECIALLY TRUE ON HIGHER TIME-FRAMES (SUCH AS THE DAILY). PLEASE DO KEEP THIS IN MIND.
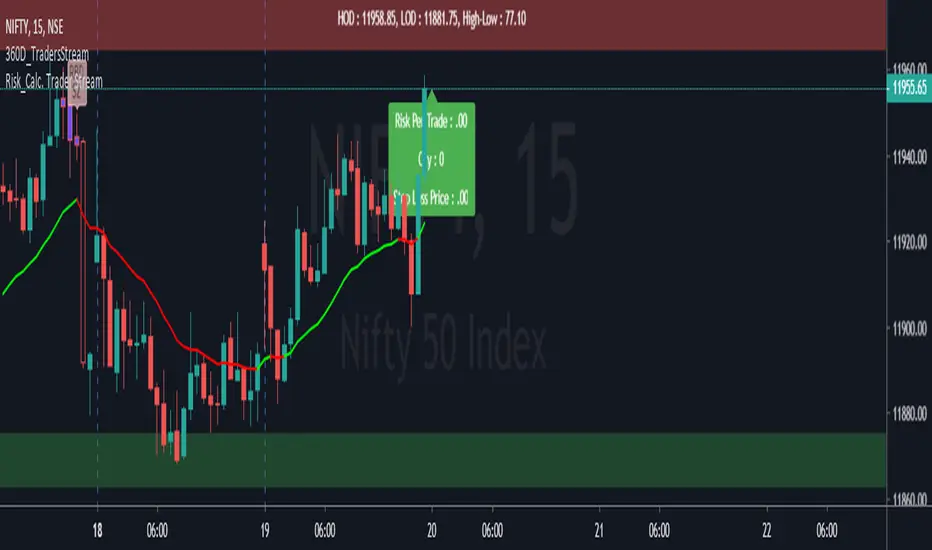
Risk Calculator_Traders StreamHello Guys here we introducing another important tool, in that you can calculate how much Risk you want to take for that trade and what is the wiggle room for Stop Loss from your Distal line. Not only that now you can get how much qty you have to buy as per risk calculation. Please comment below for any information.......
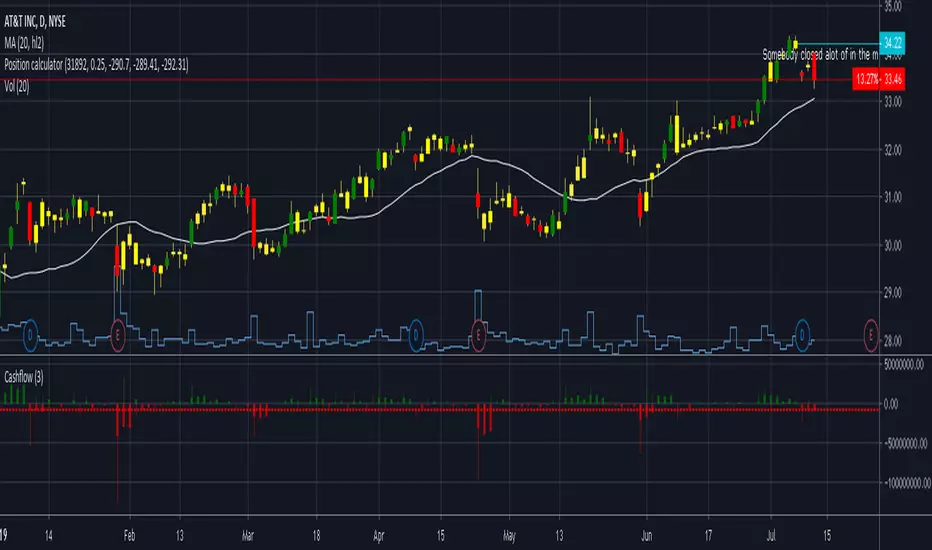
Position calculatorThis position calculator can be used to see if the potential trade is a good one. Enter the values as inputs and the output will be listed next to the settings of the indicator. Nearest support/resistance is meant to be your price target. I have found running this analysis prior to a trade to be helpful. This will output number of shares to buy/sell based on your risk percent and then also give a potential profit factor. I wish the outputs in Tradingview were cleaner but this works for now. Let me know if you have any questions or suggestions. Happy trading!
Bitmex Dollar Value CalculatorWith this indicator you can easily calculate either the bitcoin value of a certain amount of dollars or the dollar value of your bitcoin (particularly helpful when trading on bitmex)
Tipjar : 38uGQJDDZDL6wX48x4gYTccPeQ3ZHVYmY4 (btc)

[SSABU] Satoshi Calculator
✅ Satoshi Calculator Indicators.
This indicator is a supplementary index that tells you the price of the alt coin when you enter the price of the key currency and the appropriate satoshi.
Once you have entered the original price of the bit as an input value, you can enter the price of the satco of the desired altcoin to get the original price of the altcoin.
(Same in dollar terms)
✅ Satoshi Calculator 지표 입니다.
본 지표는 기축통화의 가격과 그에 맞는 사토시를 입력하면 알트코인의 가격을 알려주는 보조지표 입니다.
인풋값으로 비트의 원화가격을 입력한 뒤에 원하는 알트코인의 사토시의 가격을 입력하면 알트코인의 원화 가격을 알 수 있습니다.
(달러기준으로 하여도 똑같음)
✅ 매매에 도움되는 다른 보조지표
Basel major swing ver 2.21

Percent Change per CandleThis indicator allows you to quickly view the true % change per candlestick (prev close > current close), but it also has 3 other customizable values for you to set your own % change conditions (such as open > high). Feel free to edit the script to suit your own needs as well.
(Dollar Based ) FOREX Position Size CalculatorThe FOREX calculator uses the Adaptive Channel lines to determine your initial stop. You can input your portfolio value, % risk per trade and it will determine the number of lots. It will automatically recalculate when you switch to a different currency pair. You can choose to go long or short the currency pair and the number of lots will recalculate. There is also an option to choose your own initial stop value. Helps you stay consistent with position sizing and risk management.
The Adaptive channels can also work as entry points and to follow the trend of the trade until it reverses. The calculator works on any time frame from 5 minute charts to weekly charts.
This version uses the U.S. dollar as its base currency when calculating pip value and position size. It also calculates on roughly 30+ pairs. It doesn't convert to other currencies yet, but the plan is to add other base currencies in the near future.

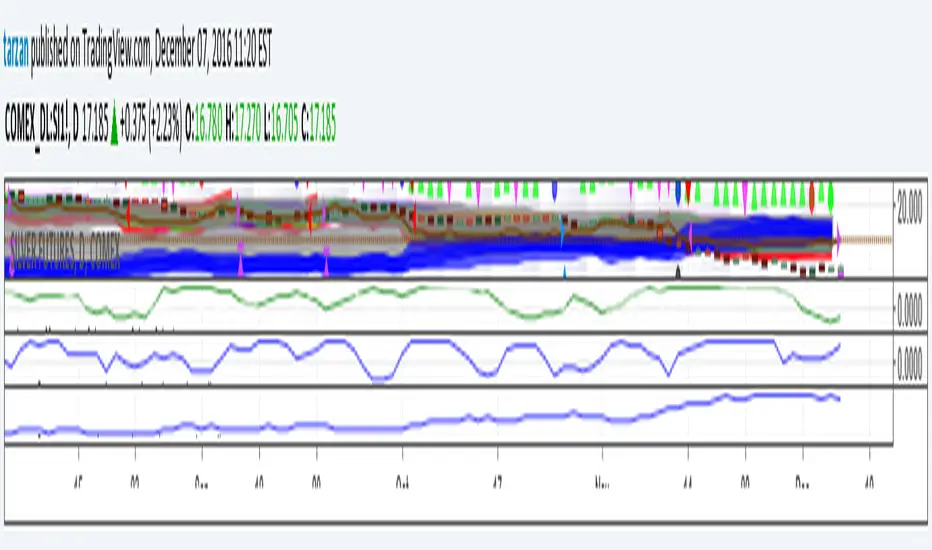
Tarzan's spread ratio indicator - DeLuxeThis indicator plots any two securities as a spread ratio using either +,-,/, or *.
It also allows you to use a simple moving average of length 1 to n for your spread ratio.
If you know what you want to do but don't know how to code it, we can work it out, you can float me some cheese on paypal and I'll do a nice job. This indicator is yours for free.
Tarzan = noprism@hushmail.com
Peace