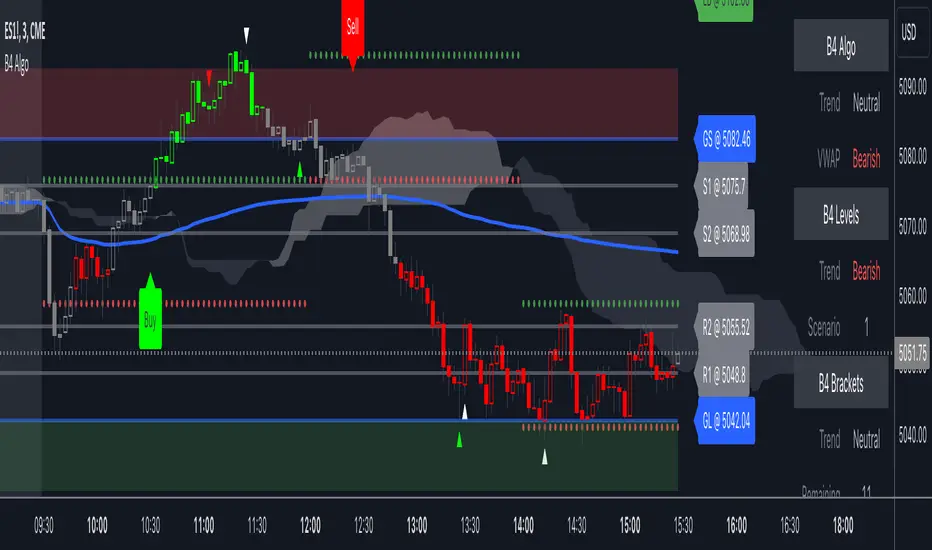
B4Signals Algo PremiumB4Signals Algo indicator is made up of more than 7+ innovative indicators carefully designed to generate high probability buy and sell signals while reducing risk. It derives its entries and exits from the B4Signals Indicator with added trend detection and volatility containment.
B4Signals Algo indicator detects the direction of trends for any asset and on any timeframe allowing traders to increase their confidence in positions, follow trends and stay in positions longer. Profit taking is up to the trader.
B4Signals Algo features:
Automatically generated buy and sell signals
Algo model selection in settings
Algo sensitivity selection in settings
Background chart shading for market hours
B4Signals Algo has two modes to choose from; each with an aggressive and a conservative approach to trading:
Algo 1 - Aggressive = Aims to detect very early trends, and is thus more reactive. Developed to catch both short term and long term trend reversal and provide clarity in the current trend direction. This setting attempts to make it easier to come in early in a new trend as well as to stay longer in that trend.
Algo 1 - Conservative = Aims to detect trend continuation where the stock price is likely to keep its current trend.
Algo 2 - Aggressive = Aims to detect very early confirmed trends, and is thus more reactive. Developed to catch both confirmed short term and confirmed long term trend reversals and provide confirmation in the current trend direction.
Algo 2 - Conservative = Aims to detect very early confirmed trends in conjunction with a filter to keep out false or choppy signals to leave the most accurate ones.
Disclaimer
Copyright by B4Signals.
The information contained in our scripts/indicators/ideas does not constitute financial advice or a solicitation to buy or sell any securities of any type. We will not accept liability for any loss or damage, including without limitation any loss of profit, which may arise directly or indirectly from the use of or reliance on such information.
All investments involve risk, and the past performance of a security, industry, sector, market, financial product, trading strategy, or individual’s trading does not guarantee future results or returns. Investors are fully responsible for any investment decisions they make. Such decisions should be based solely on an evaluation of their financial circumstances, investment objectives, risk tolerance, and liquidity needs.
Buysellsignals
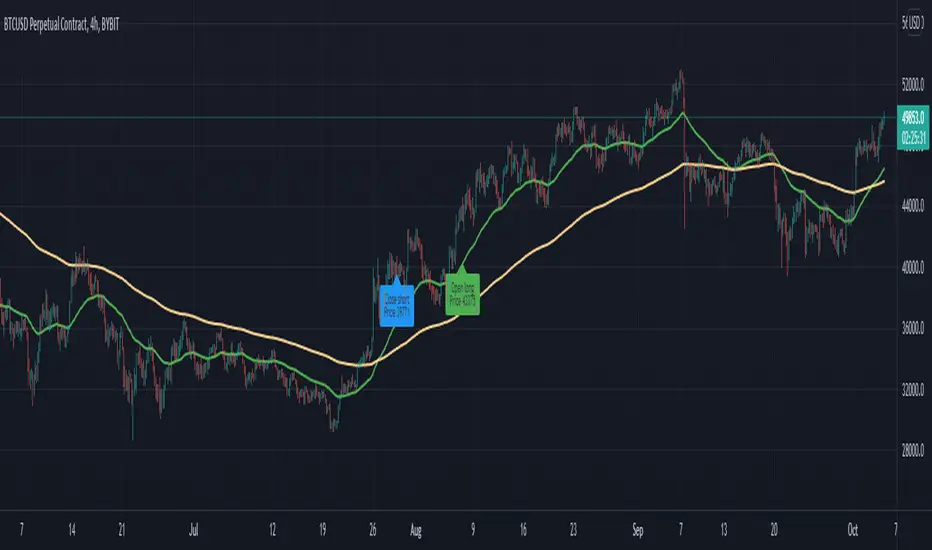
EMASAR Investor ModePLEASE READ THE FULL DESCRIPTION BEFORE BUYING OR USING THIS INDICATOR
THIS IS THE INVESTOR MODE ONLY VERSION OF THE EMASAR INDICATOR. IT INCLUDES THE ORIGINAL SIGNALS TELLING YOU WHEN TO BUY OR SELL. IT ONLY INCLUDES THE OCEAN TO INDICATE PULLBACKS AND NOT OTHER TRADING REGIONS ARE INCLUDED. IT SHOWS THE BUY/SELL SIGNALS AS WAS PUBLISHED IN THE ORIGINAL VERSION OF EMASAR
EMASAR (pronounced Emma-sar) is a strategy based on Exponential Moving Averages and the Parabolic SAR. This is a position trading approach that is derived from Tyler Jenks’ Consensio.
This strategy was developed with four objectives in mind: (1) managing risk (2) protecting from missing out on major moves (3) maximizing risk:reward (4) staying in a trending market and taking profit before it fully reverses.
EMASAR does a great job at accomplishing all of the above through the buy and sell signals that are generated. The data provided below is from the signals that occurred on Bitcoin ( Bitstamp ) from January 1, 2015 to present (November 11, 2019).
(1) Risk is tightly managed, relative to the winners, and losing positions will be exited before the market moves too far against.
The biggest losing trade on Bitcoin , for the time period outlined above, is -18.47%.
(2) Following the EMASAR buy and sell signals guarantees that one will not miss out on a major trend. As a result of the indicators used for this system it is mathematically impossible for a major trend to occur without providing a buy or sell signal. This system isn't meant to catch exact tops or bottoms but it will do a great job of capturing ~85% of a trend.
(3) On average the winning trades will be 5.55 times the losing trades. There will be stretches where the losers are bigger than the winners and this could last for many months, maybe even a year. However, over the long run the average reward is expected to be 5.55 times the average risk*.
*Past performance does not guarantee future results!
(4) This indicator was designed to capitalize on parabolic markets, specifically Bitcoin and alt coins. Crypto markets have a tendency to get moving so fast that many indicators become all but useless.
Entries can get signaled too late and exits will get signaled way too early. This is specifically true when using oscillators that are designed to identify overbought or oversold environments. EMASAR does a great job of keeping us in a position for the duration of a trend and this includes the major parabolic runs that Bitcoin has a tendency to go on.
When Bitcoin , or other alts, really get moving it can be very difficult to distinguish between a correction and a full reversal. We do not want to be exiting during a minor correction, instead this is a time when we want to be holding on or looking to buy the dip.
This is a very fragile balance. The market has a very strong tendency to make corrections looks like reversals and to make reversals look like corrections. Therefore it is very important to have a tool(s) that you trust to distinguish in between the two.
I believe that EMASAR is the best way to find that balance - if I knew of a better way then I would be using it instead!
Following these signals will help us to hold onto positions while the market is still trending in our favor when most think that it has moved too far / too fast, and it will also get us out before a market fully reverses.
Keep in mind that there will be times when we exit a market that is in danger of reversing, only to buy back higher later on. That is okay because it enables us to properly manage risk during times of uncertainty and buying back in at a higher price is more than worth the opportunity cost.
Risks
The biggest risks with trading EMASAR revolve around disobeying the signals. Risk management is built into this system with the exit signals that will occur, however it is up to the individual to execute those signals. Passing on an exit signal could lead to a big loss which would have a dramatic impact on the ROI . Most trading systems will have small and medium losses with small, medium and large wins. That is exactly how this works. The small - medium losses and wins will mostly be a wash and will account for roughly 80% of the trades. The large wins will happen about 20% of the time and will make up 80% - 90% of the profits.
Therefore the two biggest risks are passing on signals entirely, or exiting preemptively. Getting chopped in and out of a market can be quite frustrating. If you become overwhelmed with negative emotions then it could cause you to pass up on the next signal. That signal will often be the one that more than makes up for the small - medium losses that preceded.
On average EMASAR will provide one signal every 6 weeks when using the default settings on the 4h chart. Therefore missing one entry could turn an otherwise profitable year into a loser. If electing to trade a system, whether it is EMASAR or another, it is crucial to commit to taking every signal regardless of outside variables (namely your personal bias about market direction or frustration that follows a losing stretch).
Another major risk with this system is taking too much profit too soon. When getting into a trade that has the potential to be a big winner it can be challenging to continue holding through the swings. Anyone that has watched paper profits vanish will be inclined to start exiting after the market makes a big move in his or her favor. While this is better than watching profits completely evaporate, this mistake can be enough to turn a profitable system into one that loses to the market. If 80% - 90% of our profits come from 10% - 20% of our trades then it is vital we do not cut those positions off at the knees.
If taking too much profit too soon then you will consistently turn potential large winners into medium winners. This may lead to making money over the long run which will make it very difficult to realize that anything is wrong. However making money and beating the market are two very different things. Exiting early and making money is nearly as big of a risk as missing entries entirely.
If you have the discipline to execute signals in a timely manner after they are triggered and the emotional control to let the winners run despite the appearance of a vastly overbought / oversold market, then you should have what it takes to beat the market with EMASAR.
If you are not an experienced trader then it is very important to start out small. The only way to learn is to trade in a live environment and the only way to succeed is to risk much less than you can afford to lose. If you have $2,000 to trade with then start with a maximum position size of $20 - $50 and don’t be shy about scaling that down even further. Focus on ROI instead of actual dollars made. If you can return 100% on a $20 roll then you should be able to do the same with a $2,000 roll.
Important Notes
Make sure that you read / understand the risks outlined above. If you jump into this without understanding the unique risks that this system entails then you are going to have a bad time.
This indicator was developed around the 4h and that is where it works best. For crypto adjusting to higher TF’s will cause for bad results as the entries / exits will be late to the party. For traditional markets the Daily - Weekly time frames are preferred. It was not originally intended for smaller TF's but we have seen some good results on the 15m and 1h. The RSI can be a great compliment when using on smaller TF's. Adding a rule for not entering when RSI > 75 or < 25 and instead entering when RSI retests 50 will help to avoid some bad signals.
Alerts can be set for this indicator. Simply make sure that it is visible on the chart, then click the alert icon on the top panel. In the first dropdown set 'Condition' to 'EMASAR' and the second 'Condition' for the upcoming signal. For example if just entered long then set the second condition to 'Close Long' and you will be notified as soon as that signal occurs. If waiting for the next long entry then set the second condition to 'Open Long' so on and so forth . There is an 'All in One' alert that is also available. If you select that then you will be alerted any time that a signal occurs. The message will tell you to check the chart to see which signal caused the alert.
Oasis Trading Group Automated Trading BotThe Oasis Trading Group Automated Trading Bot is designed to follow trend and alert the user to potential Buy and Sell Entry Points. It is also equip with Take Profits, Automatic Support and Resistance, and Alerts for when price is breaking or bouncing off these Support and Resistance Levels. It also has a built in Stop Loss that will conservatively keep the user in the trade as long as possible.
The Bot is mainly focused on following trend strength and volatility, when the criteria is met for an entry it will trigger a Buy/Sell and then give Take Profit points that will act as suggestions for the user to take partial profit while letting the rest of the trade ride.
The Bot works best on Heikin Ashi Candles but they are not required. Because it is a trend bot, the higher time frames will be stronger.
Finally, the Oasis Trading Group Bot is equip with many different alerts for the user to fully automate their trading experience through TradingView Alerts.
For Access or Questions: Private message us. Thank you.

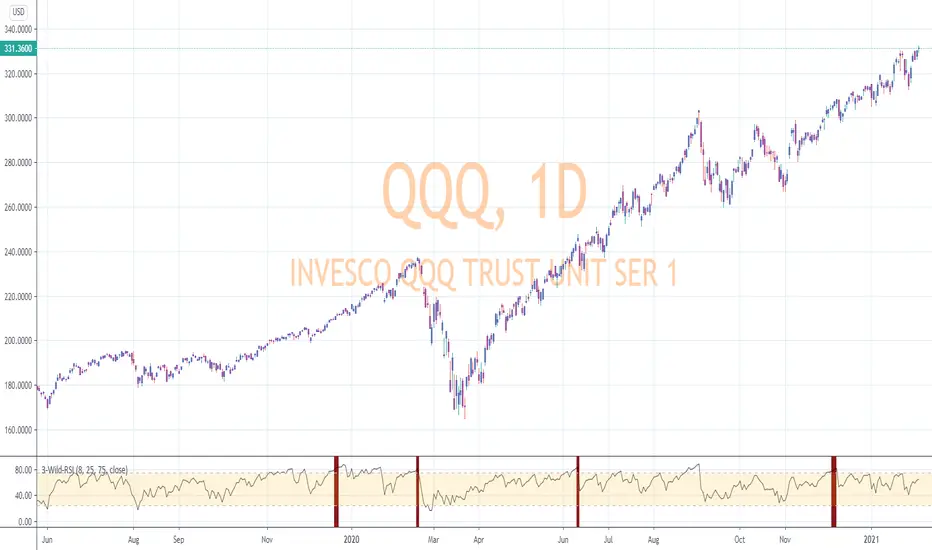
RSI-Last-3-ExtremaThis script indicates when the current Relative Strength Index of the last 8 closes is beyond a level from center oscillation which signals the equity is likely to reverse course. When it is the lowest RSI reading of the prior 3 readings and below 25, a green vertical bar will appear signaling a potential BUY point. Likewise, the highest reading of the prior 3 RSI readings and above 75 will signal a vertical red bar or SELL signal. The bar has to have a final close price for the signal to be active. Reversal could take a few more bars to occur depending on the timeframe and equity symbol.
You will be able to find many charts that have this signal perfectly finding the top or bottom of a significant trend.
It successfully indicates profitable reversal around 80% of the time. So far, It is 85% accurate or better in determining downtrend start points on the Daily, 120, 60, 30 Minute charts according to the study of more than 10,000 occurrences. It is 86% accurate on the 30 Minute chart.
This is another tool I use in finding or confirming potential price action. Hope you find it useful.
To add this, favorite the script by clicking "Add to your Favorite Indicators" at the top of the code portion below. On your top tool bar is an "fx" button with a downward arrow to the right of it. Click on the downward arrow/caret and scroll down to "RSI-Last-3-Extrema". Click on this title and it should add to the bottom of your current chart. If you do not see BUY (green vertical bars) or SELL (red vertical bars) right away, try other charts and timeframes.
Chaikin Money Flow with Volume PercentsShowing the CMF, with green / red fill for positive / negative values, overlaid with Volume Percentage, displaying buying as green and positive, selling as red and negative.

Crazy Signals - Early Detection of a Short Term TrendThis is a simple yet powerful tool that helps you detect Trends for the short term.
Time Frames:
- Avoid using very small time frames as there will be too many signals in a short period
- Intraday: 15 mins, 30 mins, 60 mins seem to detect trends well
- Overnight Trades: 60 mins
- Positional: 1D is recommended
- For Investment, one can week a weekly timeframe
Rules of Engagement:
1. The Upward Arrow (Green) indicates possible upside. While the Downward Arrow (Orange) indicates a possible downside
2. Not every Signal has to be traded. Rules to check before taking a trade:
a. The candle on which the Signal is generated, should be either small or medium size compared to other candles on the chart. If the candle is large, ignore it
b. In case of a Buy Signal, entry should be made once the Price crosses above the High made on the Signal Candle
c. In case of a Sell Signal, entry should be made once the Price crosses below the Low made on the Signal Candle
d. For extra caution, in steps b & c, one can wait for the current candle to close higher than the High of Signal Candle for Buy Signal and close lower than the Low of Signal Candle (this is for extra safe traders)
This tool is to be used for trades that usually last for a few candles.
Please do your own research before trading.

Market Trading Tools - Trend ReversalsOur Trend Reversals indicator is there to notify you when a trend reversal (depending on your time frame) might occur.
Trend Reversals will signal a cross shape signal (X), that will be in red when a downfall might happen and will be in green when a movement up is about or might happen. The indicator algorithm is based on 3 indicators, when these three intersect, the signal will be fired once the condition is met.
** Our Indicator does not repaint.
** It can be used on any financial market; crypto, stocks or forex. We also encourage using time frames as the 15 minutes and above. The use of a higher than 4hr time frame requires special settings and once you have access to it, you can change the parameters as you want. We have enabled our users to freely use the settings as they wish and to their own discretion.
Once you are granted access to use it, add it from going into the scripts >> invite only scripts >> enable the indicator. Once the indicator is added to your chart you will see the indicator popping up on your chart.
We believe that we have not seen a similar indicator, and we are proud of our work and we will continue updating the indicator when we believe it is necessary according to market changes. We have also enabled a function for our users to get a better view of the trend when they add the indicator to their chart. You can now view the trend background color (red&green) depending on if the price is above the EMA of your choice. you can also check whichever time interval you want that does not limit you to the time interval chosen on your chart itself.
Hope you enjoy it, Good luck and stay safe!
** If you are interested in this indicator. please use the link below to obtain access to this indicator

Market Trading Tools - DivergencesOur Divergence indicator is another indicator we are happy to present to interested traders. The indicator detects the possible trend change and it is a well known tool among traders based on bullish and bearish divergences.
To use the indicator well, it will spot divergences but some minimal work might be needed to be done as connecting the waves together to make sure that you get the best entries. You can also wait for the dots to appear in order to take a trade either long or short depending on whatever financial market you are trading and your trading strategy.
The red dots will signify a bearish divergence (trend reversal to the downside), while the green dots will signify a bullish divergence (trend reversal to the upside). The orange and purple dots also will signify a stronger divergence either bullish or bearish .
The divergence indicator we are publishing today works on crypto, stocks, forex, futures and almost all financial assets, however we do recommend using higher time frames for better results and to filter the noise around the divergences (dots), however using lower time frames can just allow you a better entry sometimes since reversals happen on lower time frames than larger ones.
Once you are granted access to use it, add it from going into the scripts >> invite only scripts >> enable the indicator (click on it once). Once the indicator is added to your chart you will see the indicator popping up to a lower pane.
We are happy to announce that our trading indicator is special and unique from different ones because of the features added above + we have added alerts to it. We believe that the indicator plotting and style on chart is also clean and easy for the eyes to catch compared to other indicators around. We have also enabled a function for our users to get a better view of the trend when they add the indicator to their chart. You can now view the trend background color (red&green) depending on if the price is above the EMA of your choice. you can also check whichever time interval you want that does not limit you to the time interval chosen on your chart itself.
Hope you enjoy it, Good luck and stay safe!
** If you are interested in this indicator. please use the link below to obtain access to this indicator

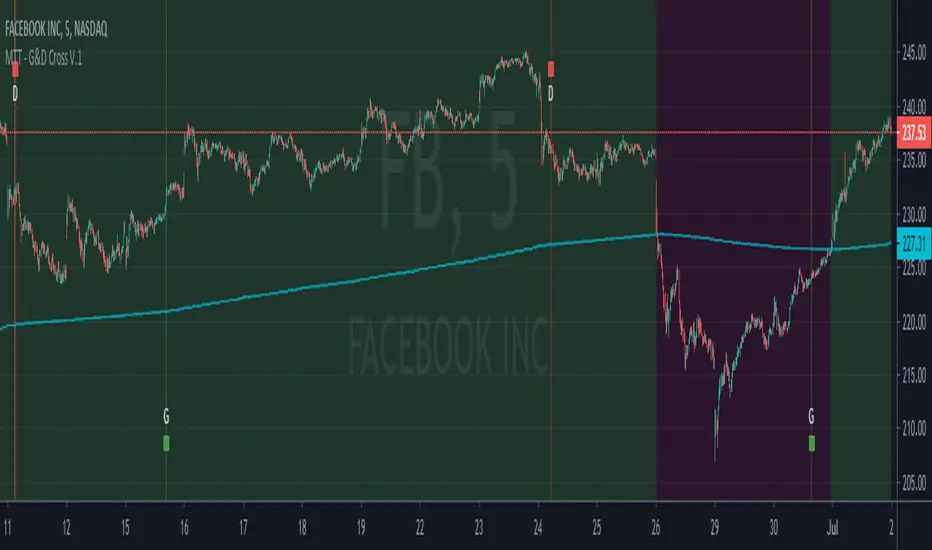
Market Trading Tools - Golden & Death Crosses + AlertsOur Golden & Death Cross indicator is another indicator we are happy to present to interested people. The indicator detects the possible trend change and it is a well known tool among traders.
To make it more convenient for your use we have labeled the golden gross with a G and there is a green vertical bar that is available on the signal. Same for the death cross we have put a D and a red vertical bar.
The indicator can be used on any financial market; crypto, stocks or forex. We do not recommend a certain time frame as each time frame usually this depends on each trader to another, but it works on every time frame, the signals will appear on any time frame used.
Once you are granted access to use it, add it from going into the scripts >> invite only scripts >> enable the indicator. Once the indicator is added to your chart you will see the indicator popping up on your chart.
We are happy to announce that our trading indicator is special and unique from different ones because it has alerts added to it and that feature isnt really available in most of the indicators around. We believe that the indicator plotting and style on chart is also easy for the eyes to catch and will probably not intersect with other indicators you might have on your chart, or at least our other indicators.
We have also enabled a function for our users to get a better view of the trend when they add the indicator to their chart. You can now view the trend background color (red&green) depending on if the price is above the EMA of your choice. you can also check whichever time interval you want that does not limit you to the time interval chosen on your chart itself.
Hope you enjoy it, Good luck and stay safe!
** If you are interested in this indicator. please use the link below to obtain access to this indicator.
Buy/Sell IndicatorBased on logic from many top contributors here, the script utilizes LazyBear's WaveTrend Oscillator Indicator along with custom code to plot a few key components for daily trading;
Boundaries for entry and exit points which are based on a 6-day trend in OPEN/HIGH and OPEN/LOW prices.
Daily HIGH and LOW points to establish a good view of stock's movements
Entry and exit points with confidence levels. These can be treated as entry points for short to medium term investments
Entry points come in the colours of White and Lime, where white is slightly confident and lime is extremely confident
Exit points come in the colours of Maroon, and Red, where maroon is slightly confident and red is extremely confident
Each Entry and Exit point also comes without text, or with a M or H above it, where M indicates medium confidence on the point and an O indicates overconfidence.
Use Case:
The best possible use case is to enter a trade on a LIME point with O text, this means that is an overconfident entry point.
The trade should be exited on a RED point with O text, this means that is an overconfident exit point.
But you can do with the indicators as you please.
In addition to LazyBear's code, the following existing models and indicators are taken into account:
RSI of closing price over a period of 25
EMA of RSI

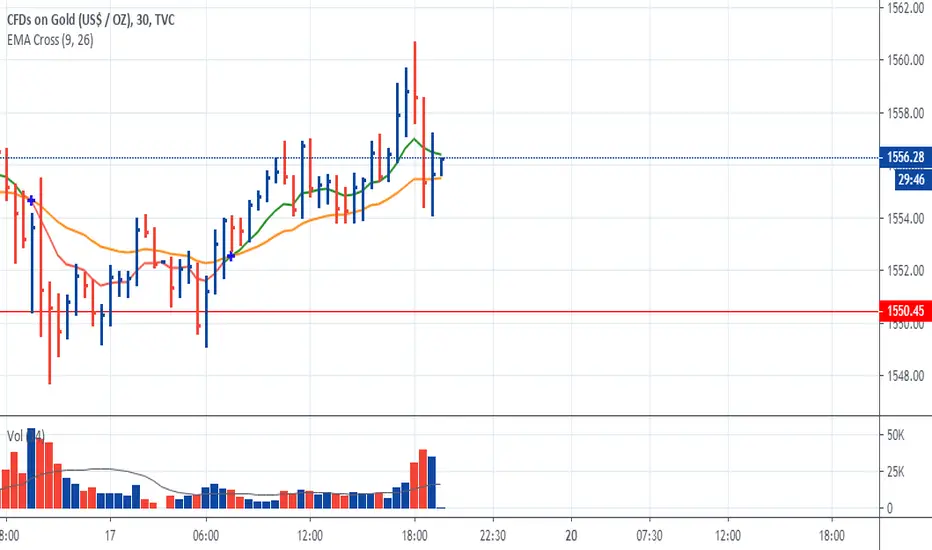
EMA Cross Over 9 26 By AbdulRaufMlkUsed Two EMA With Flexibility Of + Sign At Cross Overs.... Just Try It :)
DK-Invest-Multi-Indicator-Background Color Signals-Testing OnlyThis is currently categorized as an "Invite Only" script and is being tested by a small number of users in the community. The goal is to release to the general community in the near future. The script will likely remain protected due to the amount of time invested in its development. This may change at some point in the future!
This script is unique in that it not only combines multiple indicators and multiple resolutions into a single view, but the source data is not derived directly from price. Rather it is built on a weighted point scale utilizing SMA trends and crosses spanning multiple resolutions. This point scale provides a slightly different and more predictive approach than typical indicators that are reacting to price changes.
Can be viewed with reliable buy/sell signals on any resolution from 5s to 480m. It depends only on preference and whether the goals are short-term or long-term trading.
<<< Please make sure to review Trading View's documentation regarding the use of alerts on scripts that span multiple resolutions. A reminder/warning will be generated for each new/updated alert because of this. Note: As TV explains, it's not a bug, it's just the nature of the beast when dealing with indicators that combine multiple resolutions onto a single chart. >>>
I will be adding some images of the backtesting results shortly. The script is showing some extremely good ROIs. Want to get through another round of QA testing prior to releasing results. Stay tuned.
An Alt coin version will also be added soon. BTC is a bit unique in its volume and timing of buy/sell signals, which is why there is a separate script for now.
Thank you for your understanding. Questions please add a comment. Still getting use to checking for comments, so apologies if there is a delay in responding!
DK Investments (just me right now :->)

EMASARPLEASE READ THE FULL DESCRIPTION BEFORE BUYING OR USING THIS INDICATOR
EMASAR (pronounced Emma-sar) is a strategy based on Exponential Moving Averages and the Parabolic SAR . This is a position trading approach that is derived from Tyler Jenks’ Consensio.
This strategy was developed with four objectives in mind: (1) managing risk (2) protecting from missing out on major moves (3) maximizing risk:reward (4) staying in a trending market and taking profit before it fully reverses.
EMASAR does a great job at accomplishing all of the above through the buy and sell signals that are generated. The data provided below is from the signals that occurred on Bitcoin (Bitstamp) from January 1, 2015 to present (November 11, 2019).
(1) Risk is tightly managed, relative to the winners, and losing positions will be exited before the market moves too far against.
The biggest losing trade on Bitcoin, for the time period outlined above, is -18.47%.
(2) Following the EMASAR buy and sell signals guarantees that one will not miss out on a major trend. As a result of the indicators used for this system it is mathematically impossible for a major trend to occur without providing a buy or sell signal. This system isn't meant to catch exact tops or bottoms but it will do a great job of capturing ~85% of a trend.
(3) On average the winning trades will be 5.55 times the losing trades. There will be stretches where the losers are bigger than the winners and this could last for many months, maybe even a year. However, over the long run the average reward is expected to be 5.55 times the average risk*.
*Past performance does not guarantee future results!
(4) This indicator was designed to capitalize on parabolic markets, specifically Bitcoin and alt coins. Crypto markets have a tendency to get moving so fast that many indicators become all but useless.
Entries can get signaled too late and exits will get signaled way too early. This is specifically true when using oscillators that are designed to identify overbought or oversold environments. EMASAR does a great job of keeping us in a position for the duration of a trend and this includes the major parabolic runs that Bitcoin has a tendency to go on.
Take a look at the two charts below which illustrates the buy and sell signals that occurred at the beginning and end of the 2017 and 2019 parabolic moves. Green = Buy | Blue = Exit | Red = Short
Long signaled at $4,190.27 on September 29th, 2017
Exit signaled at $13,647 on January 14th, 2018
Short signaled at $12,050 on January 16th, 2018
Close Short signaled at $3,684 on February 18th, 2019
Long signaled at $3,684 on February 18th, 2019
Exit signaled at $9,614 on July 16th, 2019
Short signaled at $10,328 on July 22nd, 2019
When Bitcoin, or other alts, really get moving it can be very difficult to distinguish between a correction and a full reversal. We do not want to be exiting during a minor correction, instead this is a time when we want to be holding on or looking to buy the dip.
This is a very fragile balance. The market has a very strong tendency to make corrections looks like reversals and to make reversals look like corrections. Therefore it is very important to have a tool(s) that you trust to distinguish in between the two.
I believe that EMASAR is the best way to find that balance - if I knew of a better way then I would be using it instead!
Following these signals will help us to hold onto positions while the market is still trending in our favor when most think that it has moved too far / too fast, and it will also get us out before a market fully reverses.
Keep in mind that there will be times when we exit a market that is in danger of reversing, only to buy back higher later on. That is okay because it enables us to properly manage risk during times of uncertainty and buying back in at a higher price is more than worth the opportunity cost.
Lets look at the signals above in chronological order:
1) Close Long: $2,274
2) Open Short: $2,347
3) Exit Short: $2,934
4) Open Long: $2,766
5) Close Long: $3,124
6) Enter Long: $4,190
A long was closed at $2,274 after Signal #1 and was re-entered after Signal #4 at $2,766. Additionally a long was closed at $3,124 after Signal #5 and was re-entered on the following signal at $4,190. These are examples of some of the bad signals that will occur. Something to pay attention to is the ratio of the risk to the reward. When the market turns against us EMASAR will quickly signal an exit or a re entry.
EMASAR also works great in traditional markets. The S&P 500 has been on a tear lately after creating new all time highs in October of 2019. It has resumed it's strong bull trend and therefore it is a great market to have long exposure to. That being said we are well overdue for a correction and most people, including myself, expect the next bear market to be much more severe than the last two. Therefore I would not want to have long exposure unless equipped with a very reliable method for taking profit before it fully reverses.
Let's take a look at the S&P 500 weekly EMASAR signals using the preferred settings outlined below:
In August of 1990 EMASAR signaled a 'Close Long' at $308. At that time the market was in danger of fully reversing. When that didn't happen EMASAR gave a signal to re enter at $369 which resulted in losing 19.8% in opportunity cost. That is quite okay because it would have allowed us to properly protect ourselves in the event that the market proceeded to crash. Instead we entered a massive bull market that culminated in the dot com bubble. Notice how EMASAR kept us in for the entire duration of that bull run and then signaled an exit very close to the top at $1,294. It got us back in by the end of 2004 after the market had bottomed. Yet again it kept us in for the following multi year bull market before signaling an exit very close to the top at $1,270.
The action that followed in 2016 looks very similar to what happened in 1990 - 1991. An exit was signaled when the market was in danger of fully reversing. When that didn't happen a re entry was signaled 14% higher. Now the market appears to be taking off in another parabolic advance. There is no way to know how far this next run will go or how long it will last. Nevertheless I feel highly confident that I will be able to hold on for the majority of the trend and then get fully out before it reverses thanks to the signals provided by EMASAR.
When looking at the signals on Gold we will notice striking similarities to the signals in the S&P 500 as well as Bitcoin.
Notice how an entry was signaled very close to the bottom at $323 in June of 2002. An exit was also signaled very close to the top at $1,441 in April of 2013. Throughout that runup there was one bad signal that cost some opportunity. It's very important to understand that missing out on opportunity is well worth the price because it allows us to effectively manage risk. EMASAR also recently provided a long signal at $1,401 which preceded this recent runup.
Settings
Default settings work best for crypto, however the time multiplier should be adjusted for markets that are not open 24/7. For commodities and FOREX my default is 40 and for stocks I use 24. The Moving Averages can be adjusted as well. The period can be changed and you can also select SMA or EMA. I always use the EMA's and strongly prefer the 50 and 200. We have noticed good results with the 9 and 54 EMA's as well. The shorter the period that the Moving Average is set to the more frequent the signals will be. This will generally improve risk:reward while decreasing strike rate. For crypto the best time frames are the 4h and 6h. For traditional markets the best time frames are the Daily, 3D and Weekly. EMASAR can be used on smaller time frames as well, specifically in crypto. The 15m and 1h have shown good results.
Risks
The biggest risks with trading EMASAR revolve around disobeying the signals. Risk management is built into this system with the exit signals that will occur, however it is up to the individual to execute those signals. Passing on an exit signal could lead to a big loss which would have a dramatic impact on the ROI. Most trading systems will have small and medium losses with small, medium and large wins. That is exactly how this works. The small - medium losses and wins will mostly be a wash and will account for roughly 80% of the trades. The large wins will happen about 20% of the time and will make up 80% - 90% of the profits.
Therefore the two biggest risks are passing on signals entirely, or exiting preemptively. Getting chopped in and out of a market can be quite frustrating. If you become overwhelmed with negative emotions then it could cause you to pass up on the next signal. That signal will often be the one that more than makes up for the small - medium losses that preceded.
On average EMASAR will provide one signal every 6 weeks when using the default settings on the 4h chart. Therefore missing one entry could turn an otherwise profitable year into a loser. If electing to trade a system, whether it is EMASAR or another, it is crucial to commit to taking every signal regardless of outside variables (namely your personal bias about market direction or frustration that follows a losing stretch).
Another major risk with this system is taking too much profit too soon. When getting into a trade that has the potential to be a big winner it can be challenging to continue holding through the swings. Anyone that has watched paper profits vanish will be inclined to start exiting after the market makes a big move in his or her favor. While this is better than watching profits completely evaporate, this mistake can be enough to turn a profitable system into one that loses to the market. If 80% - 90% of our profits come from 10% - 20% of our trades then it is vital we do not cut those positions off at the knees.
If taking too much profit too soon then you will consistently turn potential large winners into medium winners. This may lead to making money over the long run which will make it very difficult to realize that anything is wrong. However making money and beating the market are two very different things. Exiting early and making money is nearly as big of a risk as missing entries entirely.
If you have the discipline to execute signals in a timely manner after they are triggered and the emotional control to let the winners run despite the appearance of a vastly overbought / oversold market, then you should have what it takes to beat the market with EMASAR.
If you are not an experienced trader then it is very important to start out small. The only way to learn is to trade in a live environment and the only way to succeed is to risk much less than you can afford to lose. If you have $2,000 to trade with then start with a maximum position size of $20 - $50 and don’t be shy about scaling that down even further. Focus on ROI instead of actual dollars made. If you can return 100% on a $20 roll then you should be able to do the same with a $2,000 roll.
Important Notes
Make sure that you read / understand the risks outlined above. If you jump into this without understanding the unique risks that this system entails then you are going to have a bad time.
This indicator was developed around the 4h and that is where it works best. For crypto adjusting to higher TF’s will cause for bad results as the entries / exits will be late to the party. For traditional markets the Daily - Weekly time frames are preferred. It was not originally intended for smaller TF's but we have seen some good results on the 15m and 1h. The RSI can be a great compliment when using on smaller TF's. Adding a rule for not entering when RSI > 75 or < 25 and instead entering when RSI retests 50 will help to avoid some bad signals.
Alerts can be set for this indicator. Simply make sure that it is visible on the chart, then click the alert icon on the top panel. In the first dropdown set 'Condition' to 'EMASAR' and the second 'Condition' for the upcoming signal. For example if just entered long then set the second condition to 'Close Long' and you will be notified as soon as that signal occurs. If waiting for the next long entry then set the second condition to 'Open Long' so on and so forth. There is an 'All in One' alert that is also available. If you select that then you will be alerted any time that a signal occurs. The message will tell you to check the chart to see which signal caused the alert.
How to Buy
The EMASAR Indicator is available for purchase on my website. The link can be found in my signature or in the tagline of my Trading View profile.
The price is $500 per year which is only payable in Bitcoin. That also includes access to a private Telegram group.

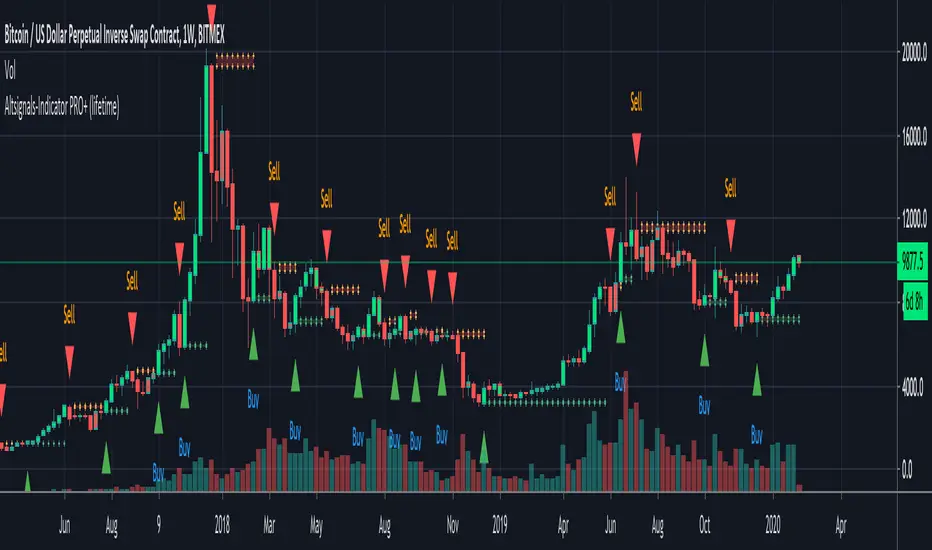
Altsignals-Indicator PRO+ (lifetime)The Altsignals indicator combines various indicators together in an effort to predict accurate and non-bias money making signals. Altsignals Indicator takes out the contradiction so you don’t have to deal with the headaches when you decide to long or short.
There are institutions, whales, and algorithmic bots everywhere in this market, there’s no doubt you’re at a disadvantage. Altsignals Indicator is the secret weapon you need to give you an edge to win in this market.
All-in-one indicator
Supports all trading pairs
Enable Signal Notifications
Fair one-time fee
Risk management features
Works on all markets and all timeframes
Perfect for beginners and people with day-jobs
Common sense required while using this indicator.
Are you experiencing paralysis from analysis? Do you feel like some indicators contradict each other? Don’t know if its worth the risk? If you’re fairly new to trading, then this product is the right fit for you!
Altsignals Indicator is here replace traditional indicators, it does exactly the opposite of all the questions above, telling you exactly when to buy and when to sell, thus giving you the assurance you need to improve your odds of trading.
It takes all aspects into consideration, it utilises multiple indicators such as Divergences, Elliott Waves , Ichimoku , MACD , MACD Histogram, RSI , Stoch , CCI , Momentum, OBV, DIOSC, VWMACD, CMF and multiple EMAs before making a decision.
This PRO+ version has a MAJOR difference to the SLIM+ version.
PRO+ has about 1000 more lines of code and allows you to use multiple advanced indicators at the same time and with a single access.
We added many helpful panels and labels for it so backtesting can be done with ease.
Finally version 2 is out now!
It is now released from all of its bugs we had with custom timeframes, Heikin Ashi and Renko Charts.
Check below what was added and removed.
Added:
- Backtesting
- Labels
- Info Panel
- Bitmex Panel
- Automatic Trendlines
- TJ-Index
- Custom Agg
- Fibonacci Customization
- EMA Customization
Removed:
- SAFE FOMO
- Custom Timeframes
- ZigZag
I have also changed the settings menu with a slightly new design and new default settings.