Chandelier Exit ZLSMA StrategyIntroduction
Heyo guys, I recently checked out some eye-catching trading strategy videos on YT and found one to test.
This indicator is based on the video.
Usage
The recommended timeframe is 5 min.
Signals
Long Entry => L Label
Price crosses above ZLSMA and Chandelier Exit shows Buy
Long Exit => green circle
Price crosses below ZLSMA
Short Entry => S Label
Price crosses below ZLSMA and Chandelier Exit shows Sell
Short Exit => orange circle
Prices crosses above ZLSMA
Ty for checking this out. Enjoy!
--
Credits to
@netweaver2011 - ZLSMA
@everget – Chandelier Exit
Buysellsignal

Adaptive Fisherized KSTIntroduction
Heyo guys, here is a new adaptive fisherized indicator of me.
I applied Inverse Fisher Transform, Ehlers dominant cycle analysis,
smoothing and divergence analysis on the Know Sure Thing (KST) indicator.
Moreover, the indicator doesn't repaint.
Usage
I didn't backtest the indicator, but I recommend the 5–15 min timeframe.
It can be also used on other timeframs, but I have no experience with that.
The indicator has no special filter system, so you need to find an own combo in order to build a trading system.
A trend filter like KAMA or my Adaptive Fisherized Trend Intensity Index could fit well.
If you find a good combo, let me know it in the comments pls.
Signals
Zero Line
KST crossover 0 => Enter Long
KST crossunder 0 => Enter Short
Cross
KST crossover KST MA => Enter Long
KST crossunder KST MA => Enter Short
Cross Filtered
KST crossover KST MA and KST above 0 => Enter Long
KST crossunder KST MA and KST under 0 => Enter Short
KST crossunder 0 => Exit Long
KST crossover 0 => Exit Short
More to read: KST Explanation
Enjoy and let me know your opinion!
--
Credits to
- @tista
- @blackcat1402
- @DasanC
- @cheatcountry

Davin's 10/200MA Pullback on SPY Strategy v2.0Strategy:
Using 10 and 200 Simple moving averages, we capitalize on price pullbacks on a general uptrend to scalp 1 - 5% rebounds. 200 MA is used as a general indicator for bullish sentiment, 10 MA is used to identify pullbacks in the short term for buy entries.
An optional bonus: market crash of 20% from 52 days high is regarded as a buy the dip signal.
An optional bonus: can choose to exit on MA crossovers using 200 MA as reference MA (etc. Hard stop on 50 cross 200)
Recommended Ticker: SPY 1D (I have so far tested on SPY and other big indexes only, other stocks appear to be too volatile to use the same short period SMA parameters effectively) + AAPL 4H
How it works:
Buy condition is when:
- Price closes above 200 SMA
- Price closes below 10 SMA
- Price dumps at least 20% (additional bonus contrarian buy the dip option)
Entry is on the next opening market day the day after the buy condition candle was fulfilled.
Sell Condition is when:
- Prices closes below 10 SMA
- Hard stop at 15% drawdown from entry price (adjustable parameter)
- Hard stop at medium term and long term MA crossovers (adjustable parameters)
So far this strategy has been pretty effective for me, feel free to try it out and let me know in the comments how you found :)
Feel free to suggest new strategy ideas for discussion and indicator building

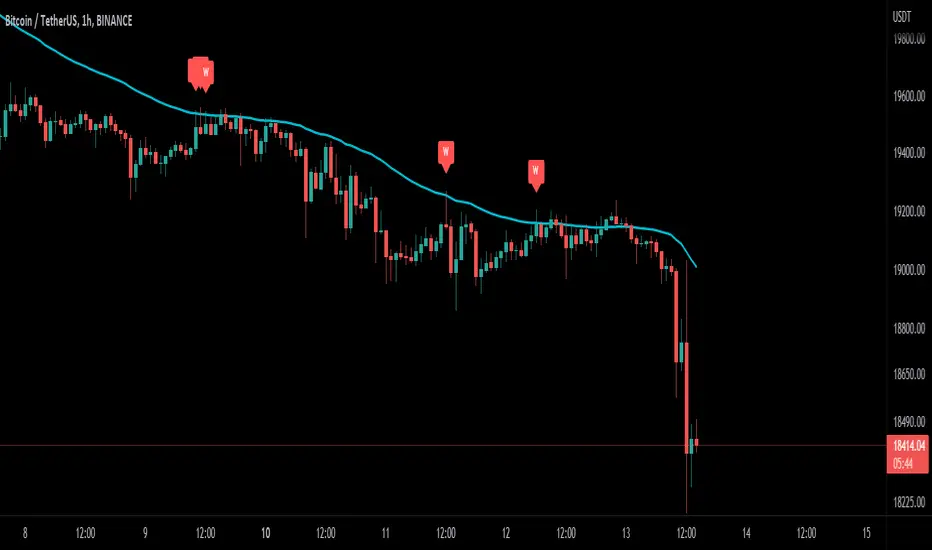
Wick-off Check Moving Average [Misu]█ This Indicator shows a wick-off check pattern applied to a moving average.
This pattern appears when a candle opens below the moving average and closes above it, or when it opens above a moving average and closes below it. This causes a wick to go through the moving average: a wick-off check moving average.
█ Usages:
This indicator detects small pullbacks in a trend. This is mainly used for trading continuation strategies.
It can also be used to validate a resistance or support level .
█ Features:
> Average Wick Validation: You can validate a wick-off check pattern depending on the average wick size. This is configured with parameters "Lenght Avg Wick Validation" and "Factor Wick Validation".
> Trend Validation: A trend is taken into account when detecting a "continuation pattern". A trend is validated if X candles close above (up trend) or under (down trend) the moving average. This "X" is defined by "Length Bar - Trend Validation" parameter.
> Buy and Sell: Labels are showing wick-of check patterns but can be interpreted as a buy & sell signal.
> Multi Moving Average.
> Alerts.
█ Parameters:
Method Multi MA : The method for calculating the moving average.
Multi MA Length : The length used to calculate the moving average.
Length Bar - Trend Validation : Define the number of bar needed to validate a trend. When price is above the MA, trend is up. When price is under MA, trend is down.
Wickoff Mode : Mode used to detect Wickoff check pattern.
> continuation pattern: only shows wick-off check pattern in a confirmed trend.
> no trend in progress: only shows wick-off check pattern in a not confirmed trend.
> both: shows both.
Lenght Avg Wick Validation : Lenght used to calculate the average wick size.
Factor Wick Validation : Factor used to validate the length of a wick when a wick-off check is detected.
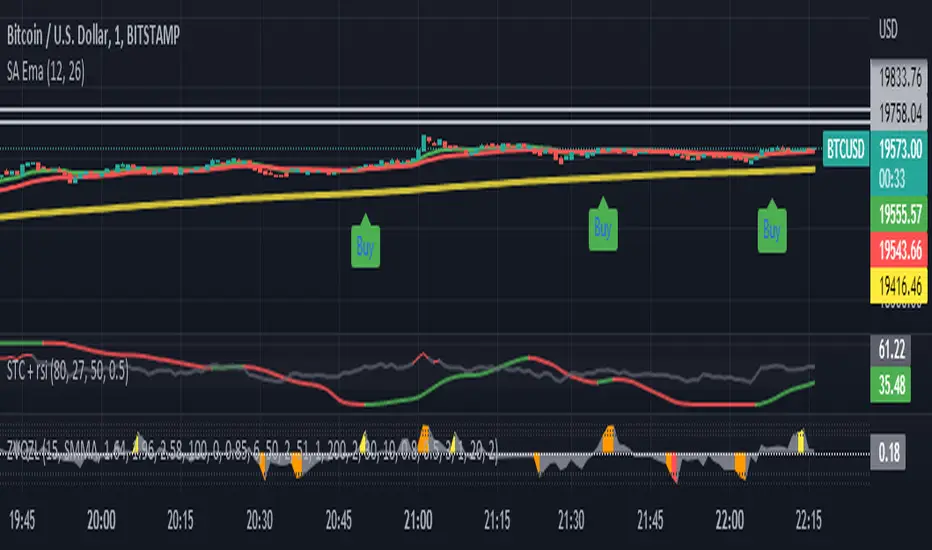
sohail Anjum EMA buy sellBased on Sohail anjum
Ema crossing teaching
Crossover alerts, only in trend 200 Ema (yellow line) make sure If the price is above the 200 EMA, you can prefer a long position and ignore short positions.
If the price is below the 200 EMA, you are allowed to open only short positions and avoid long positions.
Do not use this indicator alone, Use other recommended indicators by ShohailAnjum Rsi, Macd , chart pattren, etc
This indicator good win rate in 15m TF recommended 1H, 4H
Faytterro Estimator StrategyWhat is "Faytterro Estimator Strategy"?
"Faytterro Estimator Strategy" is strategy of faytterro estimator. if you want to know more about faytterro estimator:
What it does?
It trades according to the signals given by faytterro estimator and some additional restrictions.
How it does it?
Using the faytterro estimator and the following variables, it gives buy and sell signals in different sizes at ideal points.
How to use it?
The "source" part is used to change the source of faytterro estimator.
The "length" is the length of the fayterro estimator.
"Minimum entry-close gap" is the minimum distance between two transactions opened in opposite directions. For example, if you opened long at 20 500 and "Minimum entry-close gap" is 400, you will not receive a sell signal before the price goes above 20900.
If "minimum entry-entry gap" is the minimum difference between two transactions opened in the same direction. For example, if you open long at 20500 level and the "minimum entry-entry gap" is 400, you will not receive a "buy" signal before the price goes below the 20100 level.
"strong entry size" determines the size of strong signals. The size of ordinary signals is always 1.
note: default values for btc/usdt 1 hour timeframe.

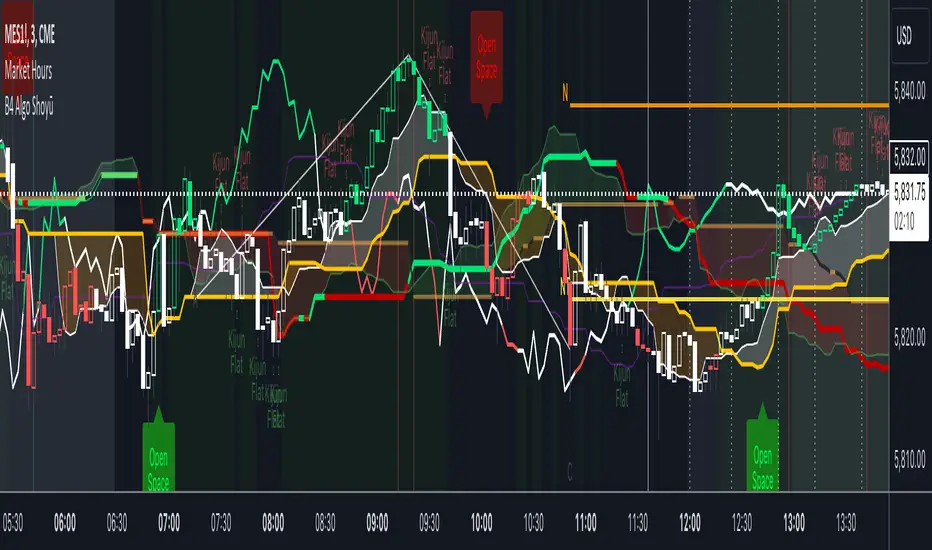
B4Signals Ichimoku Premium Addon ShoyūThis indicator is based on "Ichimoku" with additional and useful features. It is designed to complement B4Signals Ichimoku as an add-on.
FEATURES
The indicator is mainly divided into 5 parts:
* Future Tenkan-sen, Kijun-sen & Kumo Lines: Tenkan-sen next 5 days projection, Kijun-sen next 10 days, Senko Span A next 5 days and Senko Span B next 14 days will be displayed to increase depth of your analysis and help forecast price movements.
* QualityLine + DirectionLine for determining beginning and end of trend as well as a visual to spot Kijun bounces and crosses.
* 9 /26 Tenke-sen/Kijun-sen pullback detection lines, “KISS Lines”, for better entries on pullbacks.
* Flat Kijun-sen signal to determine trend exhaustion and possible reversals.
* Open Space Chikou coloring and confirmation signal for Identifying momentum breakouts and spotting areas of projected consolidation.
* Ichimoku Hosoda Target Price Targets. Simply choose point A,B and C and have 4 Hosoda price targets appear on your chart.
The addition of these features provides traders with a collection of technical metrics capable of outlining directional trend momentum, proposed pullbacks and possible continuations in any financial market. Using multiple plots, this indicator plots a forecast where the Han-ne lines might travel in the future. The Direction line gives you a clear perspective of price in relation to the Kijun. While the Quality Line gauges the health or quality of the Kumo, helping determine entries and exits, while confirming pullbacks and areas of consolidation. The “KISS Lines” help identify Tenken-sen / Kijun-sen 9/26 pullbacks and the Kijun Flat alert signals you when trend exhaustion is identified by a flat Kijun-sen.
Another significant aspect of this indicator is that it identifies the Chikou Span reaching ‘Open Space' by coloring the Chikou Span's line giving you a signal as well. This can help traders identify the market’s dominant trend (bullish or bearish) and determine an appropriate time to enter/exit active positions.
Disclaimer
Copyright by B4Signals.
The information contained in our scripts/indicators/ideas does not constitute financial advice or a solicitation to buy or sell any securities of any type. We will not accept liability for any loss or damage, including without limitation any loss of profit, which may arise directly or indirectly from the use of or reliance on such information.
All investments involve risk, and the past performance of a security, industry, sector, market, financial product, trading strategy, or individual’s trading does not guarantee future results or returns. Investors are fully responsible for any investment decisions they make. Such decisions should be based solely on an evaluation of their financial circumstances, investment objectives, risk tolerance, and liquidity needs.
ATR Trend Bands [Misu]█ This indicator shows an upper and lower band based on price action and ATR (Average True Range)
The average true range (ATR) is a market volatility indicator used in technical analysis.
█ Usages:
The purpose of this indicator is to identify changes in trends and price action.
It is mainly used to identify breaking points and trend reversals.
But it can also be used to show resistance or support levels.
█ Features:
> Buy & Sell Alerts
> Buy & Sell Labels
> Color Bars
> Show Bands
█ Parameters:
Length: Length is used to calculate ATR.
Atr Multiplier: A factor used to balance the impact of the ATR on the Trend Bands calculation.

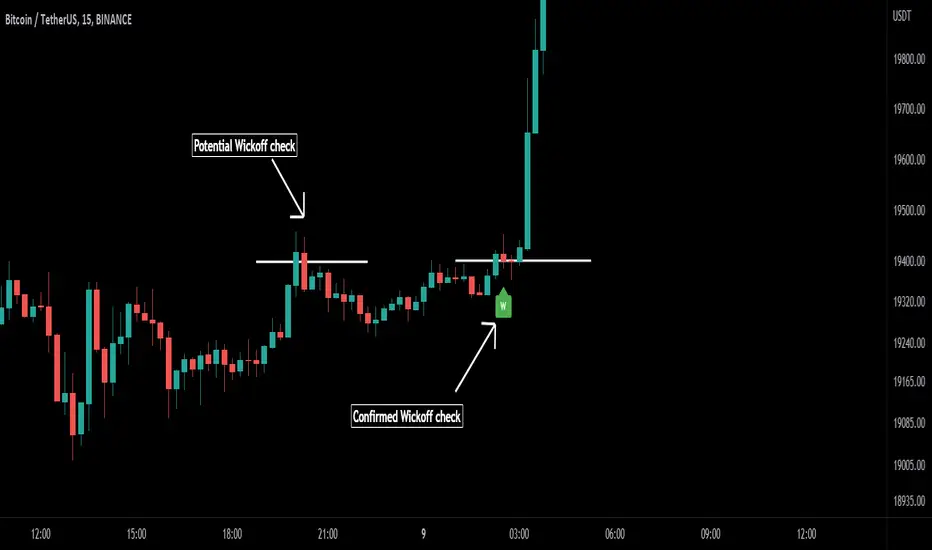
Wick-off Check Pattern [Misu]█ This Indicator shows a wick-off check pattern.
This pattern appears when a candle goes below a level (support or resistance) and closes above it OR when it goes above a level and finishes below it. This causes a wick to go through the level: a wick-off check .
This can confirm a pullback or a breakout.
█ Usages:
This indicator can be used to validate a resistance or support level.
It can also be used to validate breaking levels.
█ Parameters:
Deviation: Parameter used to calculate pivots.
Depth: Parameter used to calculate pivots.
Wickoff Mode: Mode used to detect Wickoff check pattern.
> counter pattern: only shows "pullback" wickoff check.
> breakout pattern: only shows "breakout moves" wickoff check.
> both: shows both.
Lenght Avg Body: Lenght used to calculate the average body size.
First Breakout Factor:
Lenght Avg Wick Validation: This factor multiplied by the "body avg" filters out the non-significant breakout.
Factor Avg Wick Validation: Lenght used to calculate the average wick size.
Max Bars Wickoff: This factor multiplied by the "wick avg", filters out the non-significant wickoff signals.
SBS AlgoHello traders, I am here again with a new and improved indicator.
This indicator is based on a pivot breakout algorithm which gives buy and sell signals according to the breakout of trendline. This is an advanced version of another script. It also takes price action into consideration along with some basic indicators like MACD and ADX to give good entry signals.
NOTE: This indicator is not designed to take entries completely based on signals it gives. Please use it along with your trading strategy to add more confluence to your trading system and maximize your profits.
I hope you guys will like this one too .Enjoy 👍
In case you find any bug, please do report in comment section .Thank you.

Futures Full FS ScreenerFull FS Screener
This indicator allows traders to have a view of multiple pairs and timeframes buy/sell signals and specific information of parameters, based on the Futures FS Indicator also developed by me.
Futures FS Indicator Fundamentals
1. Exponential Moving Average (EMAs): The base indicator is composed of moving averages of 5, 10, 11, 13, 36 and 55 exponential periods.
2. Squeeze Momentum: This indicator allows the signals to go with the trend and not against it.
3. VPVR (Volume Profile Visible Range): It allows to determine the Point of Control (POC) which is the node with the highest volume profile. This can be used as an important retest point or to calculate potential support and resistance.
4. ADX (Average Directional Index): The ADX helps the indicator to estimate the strength of the movement, always considering the DI+ and DI- to not go against the trend.
5. RSI (Relative Strength Index): The RSI helps measuring the speed and magnitude of the recent price changes to evaluate overvalued or undervalued conditions in the price of that security. The indicator considers RSI 5, 13 and 50 as bottom and top, respectively.
6. MACD (Moving average convergence divergence): The MACD is a trend-following momentum indicator that shows the relationship between moving averages. The indicator uses moving averages of 5, 8 and 21).
7. The trend is determined according to these parameters and their different values, which might indicate that we are in a bullish or bearish trend. The trend has a max positive (bullish) value of 6 and a max negative (bearish) value of -6.
Full Screener Panel
This panel allows the trader to monitor multiple pairs at a single screen, giving an immediate vision of possible entries and exits (Long/Short/Strong Long/Strong Short Signals). Moreover, allows traders to have handy all information of the Future FS Indicator that might be analyzed further for each pair. It has the following characteristics:
• It can be placed anywhere on the screen through the main menu of the indicator.
• It can be combined with the same indicator multiple times, as per screener is limited to show 40 pairs, you can select the number of panels being added to adjust position one next to each other.
• It strengthens colors when a pair has changed its signals in order to the trader to know immediate changes and then do the follow up
• The screener shows the pairs, which can be changed within the menus.
• The screener shows the Long, Short, Strong Long and Strong Short Signals in its las column but previously, it shows the parameters that determined the possible position. Therefore, the EMAs, SQZ, ADX, VPVR, RSI and MACD calculated internally, are also summarized in the screener.
For analyzing a specific pair, refer to the TwV Futures Indicator – FS, which is other indicator that might be on my TradingView Profile and that was used as base for the screener.

Futures Simple FS ScreenerSimple FS Screener
This indicator allows traders to have a simple view of multiple pairs and timeframe buy/sell signals, based on the Futures FS Indicator also developed by me.
Futures FS Indicator Fundamentals
1. Exponential Moving Average (EMAs): The base indicator is composed of moving averages of 5, 10, 11, 13, 36 and 55 exponential periods.
2. Squeeze Momentum: This indicator allows the signals to go with the trend and not against it.
3. VPVR (Volume Profile Visible Range): It allows to determine the Point of Control (POC) which is the node with the highest volume profile. This can be used as an important retest point or to calculate potential support and resistance.
4. ADX (Average Directional Index): The ADX helps the indicator to estimate the strength of the movement, always considering the DI+ and DI- to not go against the trend.
5. RSI (Relative Strength Index): The RSI helps measuring the speed and magnitude of the recent price changes to evaluate overvalued or undervalued conditions in the price of that security. The indicator considers RSI 5, 13 and 50 as bottom and top, respectively.
6. MACD (Moving average convergence divergence): The MACD is a trend-following momentum indicator that shows the relationship between moving averages. The indicator uses moving averages of 5, 8 and 21).
Simple Screener Panel
This panel allows the trader to monitor multiple pairs at a single screen, giving an immediate vision of possible entries and exits (Long/Short/Strong Long/Strong Short Signals). It has the following characteristics:
It can be placed anywhere on the screen through the main menu of the indicator.
It can be combined with the same indicator multiple times, as per screener is limited to show 40 pairs, you can select the number of panels being added to adjust position one next to each other.
It strengthens colors when a pair has changed its signals in order to the trader to know immediate changes and then do the follow up
The screener shows the pairs (which can be changed within the menus) and as part of being the simple screener it shows the Long, Short, Strong Long and Strong Short Signals. Therefore, the EMAs, SQZ, ADX, VPVR, RSI and MACD are calculated internally and its data will not be shown.
For viewing all parameters, refer to the Futures FS Full Screener or the TwV Futures Indicator – FS, which are other indicators that might be on my TradingView Profile

Trend Identifier StrategyTrend Identifier Strategy for 1D BTC.USD
The indicator smoothens a closely following moving average into a polynomial like plot and assumes 4 staged cycles based on the first and the second derivatives. This is an optimized strategy for long term buying and selling with a Sortino Ratio above 3. It is designed to be a more profitable alternative to HODLing. It can be combined with 'Accumulation/Distribution Bands & Signals' and 'Exponential Top and Bottom Finder'.

Simple Buy Sell SignalsIt is a simple indicator that provides buy or sell signals based on the intersection of two EMAs and a simple moving average (SMA). once the Relative Strength Index has confirmed it. For greater accuracy, add additional indicators like stochastic RSI, MACD, etc. Use only for intraday trading, Not for Positional Trading

TriexDev - SuperBuySellTrend (PLUS+)Minimal but powerful.
Have been using this for myself, so thought it would be nice to share publicly. Of course no script is correct 100% of the time, but this is one of if not the best in my basic tools. (This is the expanded/PLUS version)
Github Link for latest/most detailed + tidier documentation
Base Indicator - Script Link
TriexDev - SuperBuySellTrend (SBST+) TradingView Trend Indicator
---
SBST Plus+
Using the "plus" version is optional, if you only want the buy/sell signals - use the "base" version.
## What are vector candles?
Vector Candles (inspired to add from TradersReality/MT4) are candles that are colour coded to indicate higher volumes, and likely flip points / direction changes, or confirmations.
These are based off of PVSRA (Price, Volume, Support, Resistance Analysis).
You can also override the currency that this runs off of, including multiple ones - however adding more may slow things down.
PVSRA - From MT4 source:
Situation "Climax"
Bars with volume >= 200% of the average volume of the 10 previous chart TFs, and bars
where the product of candle spread x candle volume is >= the highest for the 10 previous
chart time TFs.
Default Colours: Bull bars are green and bear bars are red.
Situation "Volume Rising Above Average"
Bars with volume >= 150% of the average volume of the 10 previous chart TFs.
Default Colours: Bull bars are blue and bear are blue-violet.
A blue or purple bar can mean the chart has reached a top or bottom.
High volume bars during a movement can indicate a big movement is coming - or a top/bottom if bulls/bears are unable to break that point - or the volume direction has flipped.
This can also just be a healthy short term movement in the opposite direction - but at times sets obvious trend shifts.
## Volume Tracking
You can shift-click any candle to get the volume of that candle (in the pair token/stock), if you click and drag - you will see the volume for that range.
## Bollinger Bands
Bollinger Bands can be enabled in the settings via the toggle.
Bollinger Bands are designed to discover opportunities that give investors a higher probability of properly identifying when an asset is oversold (bottom lines) or overbought (top lines).
>There are three lines that compose Bollinger Bands: A simple moving average (middle band) and an upper and lower band.
>The upper and lower bands are typically 2 standard deviations +/- from a 20-day simple moving average, but they can be modified.
---
Base Indicator
## What is ATR?
The average true range (ATR) is a technical analysis indicator, which measures market volatility by decomposing the entire range of an asset price for that period.
The true range indicator is taken as the greatest of the following:
- current high - the current low;
- the absolute value of the current high - the previous close;
- and the absolute value of the current low - the previous close.
The ATR is then a moving average, generally using 10/14 days, of the true ranges.
## What does this indicator do?
Uses the ATR and multipliers to help you predict price volatility, ranges and trend direction.
> The buy and sell signals are generated when the indicator starts
plotting either on top of the closing price or below the closing price. A buy signal is generated when the ‘Supertrend’ closes above the price and a sell signal is generated when it closes below the closing price.
> It also suggests that the trend is shifting from descending mode to ascending mode. Contrary to this, when a ‘Supertrend’ closes above the price, it generates a sell signal as the colour of the indicator changes into red.
> A ‘Supertrend’ indicator can be used on equities, futures or forex, or even crypto markets and also on daily, weekly and hourly charts as well, but generally, it will be less effective in a sideways-moving market.
Thanks to KivancOzbilgic who made the original SuperTrend Indicator this was based off
---
## Usage Notes
Two indicators will appear, the default ATR multipliers are already set for what I believe to be perfect for this particular (double indicator) strategy.
If you want to break it yourself (I couldn't find anything that tested more accurately myself), you can do so in the settings once you have added the indicator.
Basic rundown:
- A single Buy/Sell indicator in the dim colour; may be setting a direction change, or just healthy movement.
- When the brighter Buy/Sell indicator appears; it often means that a change in direction (uptrend or downtrend) is confirmed.
---
You can see here, there was a (brighter) green indicator which flipped down then up into a (brighter) red sell indicator which set the downtrend. At the end it looks like it may be starting to break the downtrend - as the price is hitting the trend line. (Would watch for whether it holds above or drops below at that point)
Another example, showing how sometimes it can still be correct but take some time to play out - with some arrow indicators.
Typically I would also look at oscillators, RSI and other things to confirm - but here it held above the trend lines nicely, so it appeared to be rather obvious.
It's worth paying attention to the trend lines and where the candles are sitting.
Once you understand/get a feel for the basics of how it works - it can become a very useful tool in your trading arsenal.
Also works for traditional markets & commodities etc in the same way / using the same ATR multipliers, however of course crypto generally has bigger moves.
---
You can use this and other indicators to confirm likeliness of a direction change prior to the brighter/confirmation one appearing - but just going by the 2nd(brighter) indicators, I have found it to be surprisingly accurate.
Tends to work well on virtually all timeframes, but personally prefer to use it on 5min,15min,1hr, 4hr, daily, weekly. Will still work for shorter/other timeframes, but may be more accurate on mid ones.
---
This will likely be updated as I go / find useful additions that don't convolute things. The base indicator may be updated with some limited / toggle-able features in future also.

TriexDev - SuperBuySellTrendMinimal but powerful.
Have been using this for myself, so thought it would be nice to share publicly. Of course no script is correct 100% of the time, but this is one of if not the best in my basic tools.
Two indicators will appear, the default ATR multipliers are already set for what I believe to be perfect for this particular (double indicator) strategy.
If you want to break it yourself (I couldn't find anything that tested more accurately myself), you can do so in the settings.
Basic rundown:
A single Buy/Sell indicator in the dim colour; may be setting a direction change, or just healthy movement.
When the brighter Buy/Sell indicator appears; it often means that a change in direction (uptrend or downtrend) is confirmed.
You can see here, there was a (brighter) green indicator which flipped down then up into a (brighter) red sell indicator which set the downtrend. Once you understand the basics of how it works - it can become a very useful tool in your trading arsenal.
Typically I will use this and other indicators to confirm likeliness of a direction change prior to the brighter/confirmation one appearing - but just going by the 2nd(brighter) indicators, have found it to be surprisingly accurate.
Tends to work well on virtually all timeframes, but personally prefer to use it on 5min,15min,1hr, 4hr, daily, weekly. Will still work for shorter/other timeframes, but may be more accurate on mid ones.

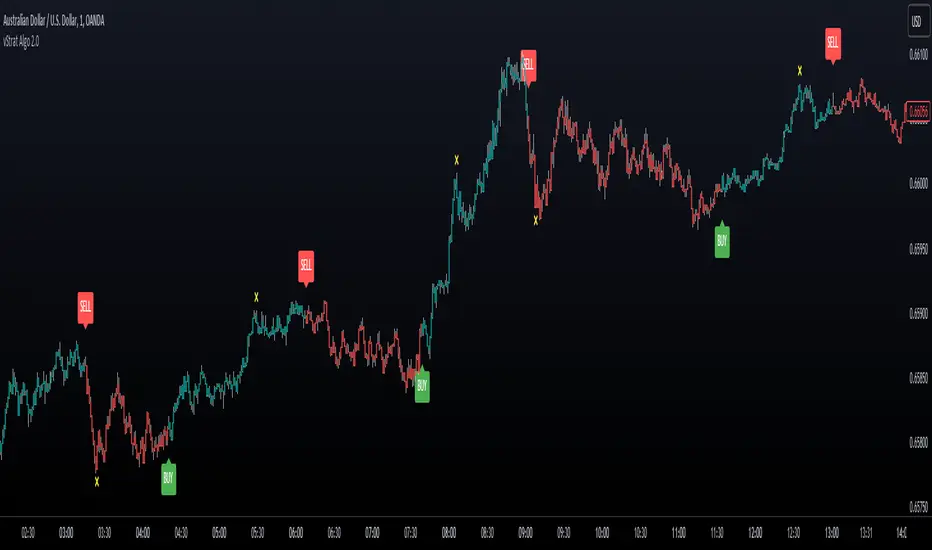
vStrat Algo 2.0vStrat Algo 2.0 is a Non-Repainting toolkit that works on any market such as stocks, crypto, forex, indices, commodities, etc. There are 8 advanced features that traders can use to help them create their own strategies. vStrat Algo 2.0 offers 10 sensitivity presets that they can choose from, making this toolkit suitable for every trading style whether it's scalping, day trading, swinging, or position trading.
I. Non-Repainting
When an indicator is Repainting , it changes its values as new data arrives, making it an unreliable indicator especially for Buy and Sell signals but this does not necessarily mean that the indicator is less accurate. vStrat Algo 2.0 does not repaint so the signals that were triggered in real time will stay the same during backtesting. If Non-Repainting is disabled, the signal that was triggered on a candle might disappear as new data arrives and once that candle closes, the signal might not even be there anymore, but it could get triggered on the next candle instead.
II. Signal Sensitivity
The Buy and Sell signals are highly accurate but the placement of each signal will differ for each selected preset. The higher the sensitivity (3.0 - 5.0), the more signals will be displayed on the chart. This setting works well when scalping using lower timeframes (1 min - 5 min). As the sensitivity lowers (0.5 - 2.5), less signals are displayed on the chart. If you are day trading or swinging, the lower presets are recommended as they are smoothed and will have less noise. Lower sensitivity works well on any timeframe.
III. Safe Mode
This feature hides any Buy and Sell signals that are triggered within the Consolidation Zones. The signals can still vary depending on the sensitivity, CZ Smoothing and CZ Length. The default setting is "3" and "7". "Unfiltered" must be unchecked for the signals to disappear.
IV. Unfiltered Signals
All Buy and Sell signals are displayed on the chart. This feature must be disabled if "Safe Mode" is enabled.
V. Trend Candle Colouring
This changes the bar colors depending on its trend. Green if it's trending up and red if it's trending down.
VI. Trend Cloud
Trend Cloud indicates the current market trend. This can also be used as a confluence to the Buy and Sell signals. Wider cloud indicates a strong momentum on either direction. As the cloud narrows, it could mean a possible reversal.
VII. Pivot Points
Pivot Points are useful for identifying significant support and resistance levels as well as identifying entry, exit, stop loss, and target profit levels.
VIII. Consolidation Zones
Consolidation Zones can be used to identify if the market is ranging. If enabled, it changes the colors of the bars that have low momentum to yellow. It is best to wait for a breakout to enter a trade but you can still be profitable when the market is ranging by trading based off Support and Resistance Levels and Imbalance Zones. Default setting is: Smoothing "3" and Length "7".
IX. Take Profit Levels
Take Profit signals are displayed on the chart as yellow "x". Once the algo detects a potential reversal, a Take Profit signal will be triggered so the user can lock in their profits. The signals can appear more than once so you have the option to keep holding as long as you know the risks. The lower the Length is, the more signals appear.
X. Alerts
Buy and Sell signal alerts can be created by clicking the three dots in the vStrat Algo 2.0 indicator tile.
Disclaimer:
All information found here, including any ideas, opinions, views, predictions, forecasts, commentaries, suggestions, or stock picks, expressed, or implied herein, are for informational, entertainment or educational purposes only and should not be construed as personal investment advice. While the information provided is believed to be accurate, it may include errors or inaccuracies. Conduct your own due diligence or consult a licensed financial advisor or broker before making any and all investment decisions. Any investments, trades, speculations, or decisions made on the basis of any information found on this site, expressed, or implied herein, are committed at your own risk, financial or otherwise.
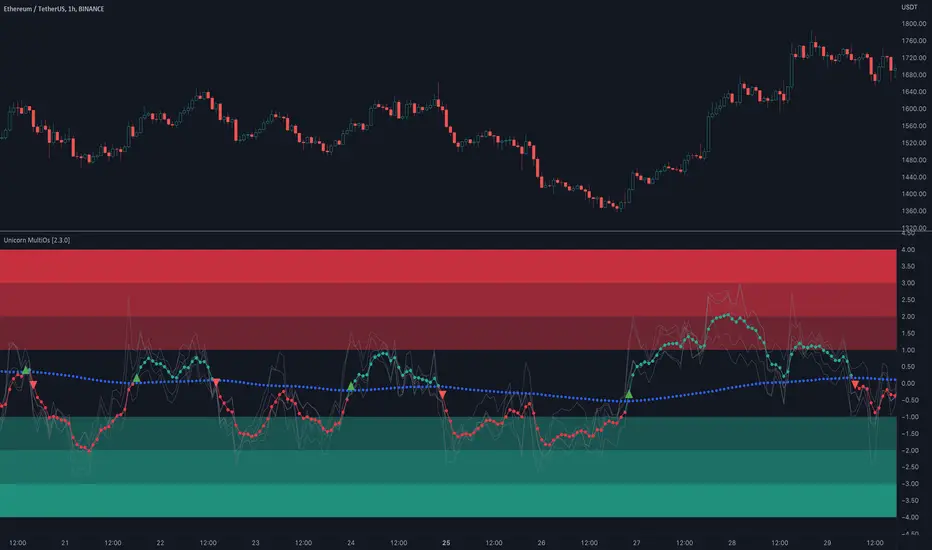
Unicorn MultiOsMultiOs is an oscillator that combines several widely used oscillators into one. In order to combine different oscillators, it is necessary to reduce them to a single scale. To do this we have developed a custom method based on z-scoring and adjusting by volatility .
The user can choose which of the oscillators from the list to combine into one. The combinations are countless. Some of the combinations may be a better fit for certain markets or trading styles. We call this new class of indicators obtained by combining several oscillators into one - "super oscillators". MultiOs provides a wide scopе for experimentation in creating different super oscillators. A good way to start is to combine all the oscillators from the list into one.
As our practice shows, combining several oscillators into one provides a number of advantages:
The compound super oscillator is smoother than any of its components, but its lag does not increase. This is due to the fact that the calculation does not require additional rolling window averaging. The averaging is performed over an ensemble of several non-smoothed oscillators. The signals are easier to read due to this alternative smoothing mechanism.
The signals are more meaningful and confirmed because they contain contributions from several oscillators and represent their consensus.
In the Candle Mode the MultiOs oscillator is plotted as a candlestick chart. You can apply all sorts of technical analysis to the oscillator candlestick chart, including candlestick patterns analysis. Reversal candlestick patterns in the overbought and oversold zones can give you leading price reversal signals.
We have also included an option to apply the regular smoothing to the MultiOs oscillator. The smoothing feature applies a simple moving average to the oscillator. The Smoothing parameter sets the period of the smoothing moving average.
This feature helps to reduce the number of false trend change signals. But don't forget that smoothing increases the indicator lag. So if you use smoothing, prefer smaller Smoothing parameter values (less than 10). And try to find the optimal tradeoff.
HOW TO USE
Choose which oscillators you would like to include into the mixture, and use the resulting super oscillator as your normal oscillator: forecast price reversals with overbought/oversold conditions and divergences, enter trends with zero line cross signals, detect narrow sideways markets when the oscillator fluctuates in the «gray zone» not going overbought or oversold.
When using this script, please, keep in mind that past results do not necessarily reflect future results and that many factors influence trading results.
SETTINGS
The indicator settings panel allows you to set the parameters that control the calculation and visualization of the indicator. You can also more deeply customize the display of the indicator on the Style tab of the indicator settings panel. This can be useful, for example, to change the colors or make some of the lines brighter.
GLOBAL MODE
Candle Mode - turns on/off the Candle Mode in which the MultiOs oscillator is plotted as a candlestick chart.
MAIN
Oscillator period - sets the oscillator period, which determines the size of the main rolling window, on which all calculations are made.
Smoothing - sets the oscillator smoothing intensity. The value 1 corresponds to the absence of smoothing.
Use Momentum, Use RSI , Use Stochastic , etc. - include/exclude the corresponding oscillator in/from the MultiOs calculation.
DISPLAY
Show MultiOS, Show Momentum, Show RSI , etc. - enable/disable the display of the corresponding oscillator.
Show Zero Line - enables/disables the display of the zero level.
Unicorn X-AlgoUnicorn X-Algo is a multifunctional trading indicator. It is designed to help traders make real-time decisions using quantitative models.
Its core is a trend trading strategy based on our enhanced Trailing Stop-Loss algorithm. This strategy provides the user with position entry and exit signals. It is customizable and has a built-in instant backtesting feature.
For those who have difficulty with finding the good settings the indicator has the Automatic Mode. In this mode, there is no need for the user to adjust any settings. The indicator calculates optimized trading signals automatically.
In addition, the indicator provides a number of useful tools that aim to provide additional confirmation to the trading signals. They include: support and resistance levels forecast, price range prediction and institutional activity detection.
The script can send real-time alerts to the user’s Email and to the cell phone via notifications in the TradingView app.
The indicator can be used for various types of trend and swing trading, including positional trading, day trading and scalping.
Unicorn X-Algo allows users to:
forecast direction of trends with BUY and SELL signals;
determine the right time to close a position;
detect institutional activity in the market;
forecast key support and resistance levels;
predict the future price range for any market;
customize any settings and do a backtest with one click;
see historical trades on the chart;
use the fully Automatic Mode where the algorithm optimizes all its settings itself.
When using this script, keep in mind that past results do not necessarily reflect future results and that many factors influence trading results.
FEATURES
Trading signals
The feature calculates trend or swing entry and exit signals. The underlying strategy does not use fixed Take-Profit levels. It trails the price with a Trailing Stop-Loss to get as many pips as possible from price movements.
The feature is based on our custom Volatility Stop algorithm. It uses linear regressions instead of averaging. As our practice shows, this helps to reduce signal lag while keeping the number of false signals low.
Trading signals are customizable with Sensitivity and Trade Length parameters which determine the trading signals frequency and width of the Trailing-Stop levels, respectively.
Automatic Mode
The Trading Signals function has an automatic mode. When it is turned on, you do not need to adjust the trading signals settings. The algorithm tries to calculate the best settings automatically using an optimization algorithm.
In this mode, Buy and Sell signals are displayed as green and red triangles respectively. There are two types of exit signals displayed as circles and crosses. A circle signal means that a price reversal is expected and you can partially close the position. A cross signal means that a trading signal in the opposite direction is expected soon and you can partially or completely close your position.
Support and Resistance Levels
Support/Resistance levels forecasting model. The forecasted levels are non-repainting. Once calculated for a specified period in the future (day, week, month, etc.), they don't change during this period.
The feature allows the trader to plan trades and use the forecasted levels as entry levels and targets for opening and closing positions. Both intraday and higher timeframes are supported.
The forecasting model analyses the distribution of the price time series to find clusters in the data. These clusters are then used to make the key price levels forecast.
Big Money Activity detection
The Big Money Activity tool identifies areas on the price chart associated with instructional traders' activity in the market.
Institutional activity in a trending market can be a leading signal for upcoming reversal. Institutions could be fixing their profit, causing the price to move against the current trend.
Institutional activity in a sideways market can be due to positions accumulation and signal a new trend formation.
The algorithm uses tick volume, volume, and volatility data to forecast activity of institutional investors. The method develops the idea described in the Daigler & Wiley (2015) and Shalen (1993) works. It says that when institutional traders actively open or close their positions in the market, a divergence between volume and volatility time-series arises. It can be due to their use of position-splitting algorithms that reduce the impact of their positions on the market.
Trading Range Forecast
Trading Range Forecast feature predicts the price range of an asset for a selected period of time in the future, called Forecast Horizon. It can be the next day or 12-hour trading session. This function works if your chart timeframe is intraday (i.e. the timeframe below "D"). It shows the upper and lower bounds between which the price is going to stay in the upcoming Forecast Horizon period.
Instant Backtesting
After changing any settings, you can immediately see the performance of the strategy on the Instant Backtesting panel. Two metrics are displayed there - the percentage of profitable trades and the total return. This information, as well as the historical trades shown on the chart, will help you quickly and easily evaluate any settings you make.
SETTINGS
TRADING SIGNALS
Trade Length - defines the length of the trades the algorithm tries to make. Recommended values are from 1.0 to 6.0.
Sensitivity - controls the sensitivity of the trading signals algorithm. The sensitivity determines the density of trading signals and how close the trailing-stop levels follow the price. The higher the value of this parameter is, the less sensitive the algorithm is. High values of the Sensitivity parameters (100-500) can help to withstand large price swings to stay in longer price moves. Lower values (10-100) work well for short- and medium-term trades.
TRADING TOOLS
Big Money Activity - turns on and off the identification of the areas associated with institutional traders activity.
SUPPORТ AND RESISTANCЕ LEVELS
Show Support And Resistance Levels - turns on and off support and resistance levels calculation.
TRADING RANGE FORECAST
Show Trading Range Forecast - turns on/off trading range forecasting
Forecast Horizon - sets the period for which the trading range forecast is made
Forecasting Method - allows to choose a forecasting algorithm for the trading range forecast.
BACKTESTING
Use Starting Date - turns on/off the starting date for the strategy and backtests. When off, all available historical data is used.
Starting Date - sets the starting date for the strategy and backtests.
Show Instant Backtesting Dashboard - turns on/off a dashboard that shows the current strategy performance: the percentage of profitable trades and total return.
Leverage - sets the leverage that the strategy uses.

Unicorn QuantDeeply customizable trading algorithm with instant backtesting. It emulates real trading and displays all the actions it takes on the chart. For example, it shows when to enter or partially close a position, move Stop-Loss to breakeven, etc. The user can replicate these actions in their trading terminal in real time. The algorithm uses up to three Take-Profit levels, and a Stop-Loss level that can move in a trade to protect the floating profit.
The script can send real-time alerts to the user’s Email and to the cell phone via notifications in the TradingView app.
The indicator is designed to be used on all timeframes, including lower ones for intraday trading and scalping.
HOW TO USE
Set the Stop-Loss and up to three Take-Profit levels. Choose the rules for moving the Stop-Loss level in a trade. Adjust the sensitivity of the trading signals. And check the backtest result in the Instant Backtesting dashboard. If the performance of the strategy satisfies you, proceed with the forward testing or live trading.
When using this script, please, keep in mind that past results do not necessarily reflect future results and there are many factors that influence trading results.
FEATURES
Trading Signals
The feature calculates Buy and Sell signals for trend or swing trading. The user can change the Sensitivity parameter to control the frequency of the signals. This allows them to be adjusted for different markets and timeframes.
Position Manager
To make the Position Manager setup as easy as possible, the algorithm calculates Stop-Loss and Take-Profit levels in Average True Range (ATR) units. They are self-adjusting for any market and timeframe, since they account for its average volatility .
You don't have to worry about what market you are trading - Forex, Stocks, Crypto, etc. With the self-adjusting Stop-Loss and Take-Profit, you can find settings that work for one market and use the same numerical values as a starting point for a completely different market.
Instant Backtesting
After changing any settings, you can immediately see the performance of the strategy on the Instant Backtesting panel. Two metrics are displayed there - the percentage of profitable trades and the total return. This information, as well as the historical trades shown on the chart, will help you quickly and easily evaluate the settings.
SETTINGS
TRADING SIGNALS
Sensitivity - controls the sensitivity of the trading signals algorithm. It determines the frequency of the trading signals. The higher the value of this parameter, the less trading signals you get and the longer trends the algorithm tries to catch. The lower the sensitivity value, the more signals you receive. This can be useful if you want to profit from small price movements.
POSITION MANAGER
SL - sets the Stop-Loss level measured in ATR units.
TP1, TP2, TP3 - set the Take-Profit levels measured in the ATR units.
Close % at TP1, Close % at TP2, Close % at TP3 - set portions of the open position (as a percentage of the initial order size) to close at each of the TP levels.
At TP1 move SL to, At TP2 move SL to - set the rules for moving the Stop-Loss level in an open trade to protect the floating profit.
Show Open Position Dashboard - turns on/off a dashboard that shows the current Stop-Loss and Take-Profit levels for the open position.
BACKTESTING
Use Starting Date - turns on/off the starting date for the strategy and backtests. When off, all available historical data is used.
Starting Date - sets the starting date for the strategy and backtests.
Show Instant Backtesting Dashboard - turns on/off a dashboard that shows the current strategy performance: the percentage of profitable trades and total return.
Leverage - sets the leverage that the strategy uses.

Squeeze Momentum Strategy [LazyBear] Buy Sell TP SL Alerts-Modified version of Squeeze Momentum Indicator by @LazyBear.
-Converted to version 5,
-Taken inspiration from @KivancOzbilgic for its buy sell calculations,
-Used @Bunghole strategy template with Take Profit, Stop Loss and Enable/Disable Toggles
-Added Custom Date Backtesting Module
------------------------------------------------------------------------------------------------------------------------
All credit goes to above
Problem with original version:
The original Squeeze Momentum Strategy did not have buy sell signals and there was alot of confusion as to when to enter and exit.
There was no proper strategy that would allow backtesting on which further analysis could be carried out.
There are 3 aspects this strategy:
1 ) Strategy Logic (easily toggleable from the dropdown menu from strategy settings)
- LazyBear (I have made this simple by using Kivanc technique of Momentums Moving Average Crossover, BUY when MA cross above signal line, SELL when crossdown signal line)
- Zero Crossover Line (BUY signal when crossover zero line, and SELL crossdown zero line)
2) Long Short TP and SL
- In strategies there is usually only 1 SL and 1 TP, and it is assumed that if a 2% SL giving a good profit %, then it would be best for both long and short. However this is not the case for many. Many markets/pairs, go down with much more speed then they go up with. Hence once we have a profitable backtesting setting, then we should start optimizing Long and Short SL's seperately. Once that is done, we should start optimizing for Long and Short TP's separately, starting with Longs first in both cases.
3) Enable and Disable Toggles of Long and Short Trades
- Many markets dont allow short trades, or are not suitable for short trades. In this case it would be much more feasible to disable "Short" Trading and see results of Long Only as a built in graphic view of backtestor provides a more easy to understand data feed as compared to the performance summary in which you have to review long and short profitability separately.
4) Custom Data Backtesting
- One of most crucial aspects while optimizing for backtesting is to check a strategies performance on uptrends, downtrend and sideways markets seperately as to understand the weak points of strategy.
- Once you enable custom date backtesting, you will see lines on the chart which can be dragged left right based on where you want to start and end the backtesting from and to.
Note:
- Not a financial advise
- Open to feedback, questions, improvements, errors etc.
- More info on how the squeeze momentum works visit LazyBear indicator link:
Happy Trading!
Cheers
M Tahreem Alam @mtahreemalam

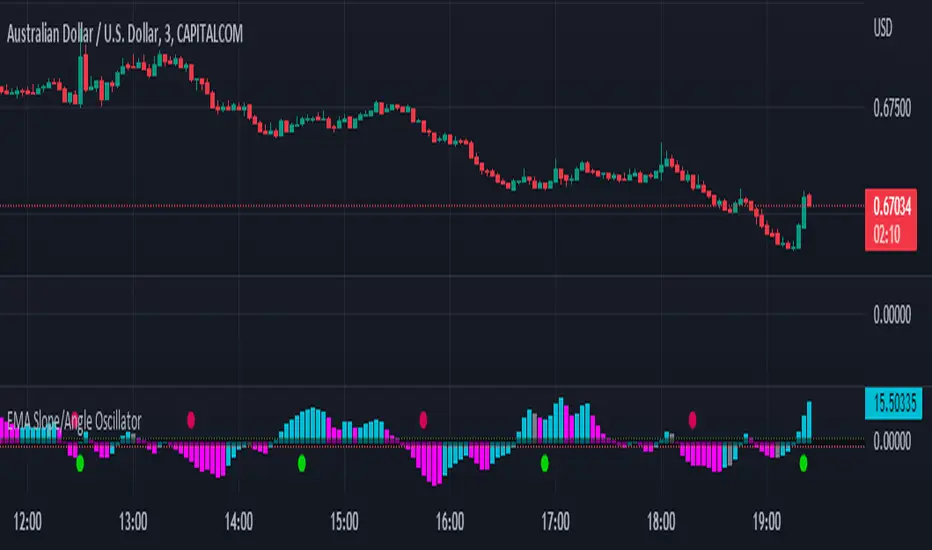
EMA Slope/Angle OscillatorEMA Slope/Angle Oscillator, Multiple Moving Average Oscillator, Multiple type
Moving Averages HMA,EMA,WMA,SMA, VWMA,VWAP provided.
The angle is calculated between the Slow MA and Fast MA and the difference between the angle is plotted as Histogram.
Additionally Buy Sell Signals are plotted as green and red Dots.
its very easy to judge the movement of price Bearish/Bullish.
Bearish if price below 0 line
Bullish if price above 0 line
Zero crossing is Moving Average Crossover.
Trend Filter is provided to filter opposite signals.
Angle Threshold is provided to filter low angle false signals.
Dead zone is plotted around Zero Line. Trades can be taken after Threshold angle or Dead zone is crossed
Its interesting to see how different Moving Averages move along with price Action.
ViVen - EXP - Signals with AlertsHi Friends,
Here the trading made easy with Signals...
The main purpose of this indicator is to identify the Support and Resistance levels well in advance to make ourselves ready for the Entries with confidence..
With this indicator we will be able to identify the Market Structure and Trend to initiate our trades.
Multi Timeframe Concepts are considered in some cases to capture the Golden Zones.
Details of the Indicator:
Method of Trading – Intraday, Positional or Swing – Indices, Stocks and Commodity Markets
Golden Zones : When two or more indicator levels are confluences at one price point which will act as Strong Support and Resistance in the Market. That is called Golden Zone.
CPR & Pivot (Daily / Weekly / Monthly) – Based on the previous Timeframe values, it will automatically calculates the Support and Resistance values for the upcoming Sessions.
BUY / SELL Levels (W-Refers the Weekly levels) – Possible Reversal in the market we can expect at this price level. Depends on the Time frame (Daily/Weekly)
Bull BO / Bear BO (W-Refers the Weekly levels) – Possible Breakout level, If breakout happens price will move to reach the Target 1 and 2 Points based on which side the price breaks ( BULLISH / BEARISH ). We can initiate our BUY/SELL Entries.
Target 1 & Target 2 – Once the Price breaks the Breakout (Bull BO / Bear BO) levels, it will try to reach the Target Points where we can book our profits.
Tomorrow Levels - This will help us to enable the next day trading session Support and Resistance Levels in advance to do pre-analysis to prepare for the Entry and Exits.
Colored Candles : Lime Green and Violet colored candles will indicate the Possible Trend Reversals.
Triangles : Orange and Violet triangles will indicate the Confirmation of Trend Reversal.
BUY / SELL Signal – Considering the momentum and the Trend change it will suggest the possible entry time.
Dashboard :
1. Weekly Trend : This will indicate how the current week trend is going to be – Trending / Sideways
2. Today – Current Session expectation in the Market ( Bullish / Bearish )
3. Sentiment – Indicates the Traders mind set (Positive/Negative Side)
4. Range - This will indicate how the current Day trend is going to be – Trending / Sideways
5. MB / MA Trend – This identifies the major trend (Is the Stock / script in Up Trend or Down Trend)
6. Other Parameters – Will indicates the present situation in the market
7. RSI Values – This is to know and understand the momentum of the particular script
Levels Name Explanations:
1. DPP – Daily Pivot Point
2. WPP – Weekly Pivot Point
3. WTC – Weekly Top Central Pivot
4. WBC – Weekly Bottom Central Pivot
5. PDH – Previous Day High
6. PDL – Previous Day Low
7. PWH – Previous Week High
8. PWL – Previous Week Low
9. PMH – Previous Month High
10. PML - Previous Month Low
11. WR1, WR2 – Weekly Resistance Levels 1 & 2
12. WS1, WS2 – Weekly Support 1 & 2
13. 5m 200 EMA – 5 Minutes 200 Period Exponential Moving Average
14. 15m 200 EMA – 15 Minutes 200 Period Exponential Moving Average
15. 1H 200 EMA – 1 Hour 200 Period Exponential Moving Average
16. 1H 200 SMA – 1 Hour 100 Period Simple Moving Average
17. 1D 200 EMA – Daily TF 100 Period Exponential Moving Average
Settings:
To turn ON and OFF any of these levels if it does not require, Go to Indicator Settings and disable the specific levels.
Alerts:
You can enable the Buy / Sell signal Alerts by creating new alert.
To Access the Indicator:
If you want to know more about the indicator & to access for your trading please check the link in the signature below.
If you have any doubts please mention it in the comment section.
Looking forward your valuable comments and feedbacks to improve further in accuracy of our Trading.
Thanks!!
