ADX + DI Trend Gate PROADX + DI Trend Gate PRO is a trend filter and signal tool built around DMI (DI+ / DI-) and ADX. It helps you avoid choppy conditions by requiring real trend strength and DI separation before allowing signals.
Key features:
AUTO presets for 5m / 15m (optimized for fast intraday use)
Optional MTF confirmation (5m → 15m, 15m → 1H)
Adaptive DI Gap (volatility-based adjustment using ATR/Close)
Confirm on bar close option (no repaint mode)
Signal modes: DI Cross (classic) or Gate Flip (more responsive)
Optional filters: ATR volatility filter and Volume filter
Exit signals when trend weakens (ADX weakening / DI convergence / DI flip)
Info panel with active parameters, AUTO vs MANUAL, MTF diff, and adjustable panel font size
How to use (practical):
For cleaner signals, keep AUTO presets ON and enable Confirm on bar close.
For stricter filtering, enable MTF confirmation and/or Require ADX rising.
Volume filter is best on instruments with meaningful volume; on Forex (tick volume) it’s often better OFF.
Disclaimer : This indicator is a trend filter and timing tool, not financial advice. Always backtest and use proper risk management.
Buysellindicator

AI Brahmastra with SMC by Pooja V22🚀 AI Brahmastra with SMC by Pooja v22
Invite-Only | Rule-Based Market Structure & Momentum Indicator
📌 What this indicator is (clear definition)
AI Brahmastra with SMC v22 is a closed-source, rule-based technical analysis indicator designed to filter low-quality market conditions and highlight high-probability structural and momentum alignment.
It is not a strategy, does not execute trades, and does not provide fixed targets or stop-losses.
The indicator functions strictly as a decision-support tool, where signals appear only after all predefined rules are satisfied on a confirmed candle close.
The primary objective is signal validation and rejection, not signal frequency.
🎯 Intended Use & Markets
Designed for traders who focus on:
Market structure (SMC)
Trend alignment
Momentum & volatility confirmation
Intraday and positional analysis
Optimised for:
Indian equity markets
Index derivatives (NIFTY, BANKNIFTY, FINNIFTY)
NSE stocks
Futures & commodities
🧠 What “AI” means in this indicator (important clarification)
The term “AI” does NOT refer to machine learning, prediction, or data fitting.
In this script, AI refers to a rule-driven decision engine that:
Evaluates multiple independent conditions simultaneously
Uses state-based logic (past signal state affects future eligibility)
Actively rejects signals unless context, momentum, volatility, and structure align
In short:
👉 The script decides whether a signal is allowed or blocked, instead of blindly triggering on single conditions.
🔗 Why multiple indicators are combined (not a mashup)
Each component has a non-overlapping role.
No indicator is used to “confirm itself”.
EMA (Trend Bias)
Defines directional market bias
Blocks counter-trend signals early
VWAP (Fair-Price Filter)
Ensures entries are aligned with institutional mean price
Prevents chasing overextended moves
Supertrend (Trend Continuation Context)
Confirms directional persistence
Helps avoid premature reversals
RSI + RSI-MA (Momentum Quality)
RSI direction alone is not enough
RSI-MA distance filters weak momentum
RSI-MA slope filters flat / sideways conditions
ADX (Market Energy)
Confirms whether the market has sufficient strength
Blocks signals in low-energy or sideways phases
ATR (Volatility Context)
Confirms whether price movement is meaningful
Helps avoid signals during compressed ranges
👉 No single indicator can generate a signal independently.
Signals are allowed only when these components agree together.
🧱 Market Structure Engine (SMC Logic)
BOS — Break of Structure
Detected using swing-based pivot highs and lows
Confirms continuation of the prevailing structure
Evaluated only after candle close
CHoCH — Change of Character
Detects structural shift against the prior trend
Used as early contextual information
CHoCH remains valid for a limited number of bars
⚠️ BOS and CHoCH are contextual structure references, not standalone trade signals.
⚡ Partial Signal System (Context, not entries)
Instead of showing only final Buy/Sell signals, the indicator provides partial signals that reflect setup development:
B1 / S1 → CHoCH + RSI
B2 / S2 → EMA + VWAP + Supertrend + RSI
B3 / S3 → EMA + VWAP + RSI
B4 / S4 → Breakout alignment (RSI intentionally excluded)
Each partial type:
Represents a specific rule-set
Can be enabled or disabled independently
Does not imply trade execution
🛡 Noise & Fake-Breakout Protection (Core Design Goal)
The script is specifically engineered to avoid false breakouts by using:
Candle-close confirmation (non-repainting)
RSI-MA minimum distance & slope filtering
Optional ADX strength filter with recovery (grace) window
Optional RSI divergence blocking
Optional session-time exclusion
Low-volatility, sideways, or unstable market conditions are intentionally filtered out.
⚙ Trading Modes (Different internal logic)
Intraday Mode
Direction resets at the start of each trading day
Prevents repeated same-side entries
Optional momentum-based reset logic
Positional Mode
Direction remains active until an opposite signal appears
No daily reset
Suitable for swing and higher-timeframe analysis
These modes use different internal state handling, not cosmetic toggles.
📍 Traditional Pivot Points (Support & Resistance Context)
Built-in Traditional Pivot Levels include:
Auto / Daily / Weekly / Monthly anchoring
Multi-year support (Quarterly, Yearly, etc.)
Optional price labels
Historical plotting control
Pivot levels are never used to generate signals.
They serve only as contextual support & resistance references.
📋 Trend Dashboard (Visual Aid)
An optional dashboard displays:
Trend state across multiple timeframes
Bullish / Bearish / Neutral classification
The dashboard is informational only and does not generate signals.
🔔 Alerts
Supports:
Confirmed signal alerts
Partial signal alerts
JSON-formatted webhook alerts
All alerts trigger only on confirmed candle close.
🔐 Why Invite-Only & Closed-Source
This script uses:
Stateful signal control
Multi-stage rule validation
Structure persistence logic
Partial-to-confirmed signal flow
Source access is restricted solely to protect these internal mechanisms, not for promotion.
⚠ Disclaimer
This indicator is provided for educational and analytical purposes only.
It does not constitute financial advice and does not guarantee results.
All trading decisions and risk management remain the user’s responsibility.

AI Chakra for Global Markets by Pooja🔮 AI Chakra for Global Markets — by Pooja
Invite-Only | Rule-Based Market Structure & Momentum Indicator
🔹 What this indicator actually does
AI Chakra is a rule-based indicator that generates Auto Buy / Auto Sell signals
only when predefined rules across trend, momentum, volatility and structure are satisfied together.
It is not a simple RSI, EMA or SMC indicator, and it is not a visual mash-up.
Each component has a fixed role, and no signal is allowed unless all required rules pass.
🟢 AUTO BUY / 🔴 AUTO SELL — How signals are generated
BUY signal is allowed ONLY when ALL rules below are true on candle close:
Trend Rule
Price above EMA trend structure
EMA alignment confirms bullish bias
Fair-Price Rule
Price above VWAP (no buy below VWAP)
Momentum Rule
RSI above its moving average
RSI–RSI-MA distance above minimum threshold
RSI-MA slope positive (flat momentum blocked)
Volatility Rule
ADX confirms market strength
ATR confirms sufficient price movement
Low-energy / sideways markets are ignored
Structure Rule
Market structure is valid (BOS or active CHoCH context)
No buy allowed against recent structure shift
Candle Confirmation Rule
Signal triggers only after candle close
No intrabar or repaint signals
If any single rule fails → NO BUY SIGNAL.
SELL signal follows the same rules in the opposite direction.
🧠 What “AI” means here (no hype, no prediction)
“AI” in this indicator does NOT mean machine learning or prediction.
It refers to:
Multi-rule decision logic
State-based signal control
Conditional signal rejection
Context-aware validation instead of single-condition triggers
👉 The indicator decides whether a signal is allowed or rejected, similar to a rule engine.
📉 Fake Breakout Protection (Core Purpose)
This indicator is specifically designed to avoid fake breakouts.
Fake signals are blocked using:
RSI distance + slope filter
ADX strength validation
ATR volatility requirement
VWAP position filter
Structure (BOS / CHoCH) alignment
Low-volume, sideways and weak momentum moves are intentionally ignored.
🧱 Market Structure (SMC) — How it is used
Break of Structure (BOS)
Detected using swing highs / lows
Confirms continuation of current trend
Used as structure validation, not as a trade trigger
Change of Character (CHoCH)
Detected when price breaks previous structure
Marks possible trend shift
Remains valid only for limited bars
⚠️ BOS / CHoCH do not generate trades alone.
They only allow or block signals from the main engine.
🔁 Partial Signals — Why they exist
Instead of only final Buy/Sell, the indicator shows Partial Signals:
CHoCH + RSI
EMA + VWAP + RSI
EMA + VWAP + Supertrend + RSI
Breakout structure (RSI intentionally excluded)
Partial signals:
Do not mean trade entry
Show which rules are already satisfied
Help traders track setup development
📍 Support & Resistance (Context Only)
Traditional Pivot Points
Multi-timeframe calculation (Daily / Weekly / Monthly)
Optional price labels
Pivot levels:
Never generate signals
Used only as support / resistance reference
📐 Trendline Module (Optional)
Trendlines drawn from swing points
ATR / Std-Dev / Regression-based slope
Extended forward for interaction zones
Trendlines are contextual, not breakout triggers.
⚙️ Trading Modes (Different rule handling)
Intraday Mode
Direction resets daily
Prevents repeated same-side signals in one session
Positional Mode
Direction stays active until opposite structure appears
No daily reset
Logic is different internally — not cosmetic.
🔔 Alerts
Auto Buy / Auto Sell alerts
Partial alerts available
Candle-close only
Non-repainting
Webhook compatible
🔒 Why Invite-Only
The script uses:
Stateful signal logic
Multi-rule validation
Structure-based filters
Partial-to-confirmed signal flow
Source is restricted to protect these mechanisms.
⚠️ Disclaimer
This indicator is for educational and analytical use only.
It does not provide financial advice or trade recommendations.
Risk management is the user’s responsibility.

Buy / Sell Signals With Take Profits (Non-Repaint)This indicator generates automatic BUY/SELL flip signals based on trend direction, volatility status, and ATR dynamics.
Labels are placed based on actual High/Low and do not shift.
Features
✔ Dynamic ATR Multipliers
✔ Volatility Stretch (calm market → narrow, aggressive → wide)
✔ Trend Memory (25-bar direction memory)
✔ Automatic TP1–TP5 (%1 – %5) calculation
✔ Desktop & Mobile compatible TP Panel
✔ Bull/Bear Flip labels
✔ TradingView alert support
Suitable Markets
Forex, Crypto, Stocks, Indices, Gold, Oil
Works on all timeframes (5min – 1min – 4min – Daily).
⚠ Important Note
This tool is not investment advice.
It does not provide any buy–sell recommendations.
All trading decisions are yours; risk management is entirely the user's responsibility.

Reversal Buy and Sell SignalsThis indicator is fast and minimalistic reversal-detection indicator designed to capture high-probability turning points in the market. It combines engulfing candlestick patterns, a strong candle body filter, and RSI momentum analysis to generate precise BUY and SELL signals with minimal noise.

Eagle V 2.0 - AIEagle V 2.0 – AI Edition is a next-generation signal engine designed for traders who want clean entries, consistent performance, and reduced stop-loss hits.
The indicator analyzes trend strength, liquidity behavior, volatility conditions, market structure, and price momentum to generate high-quality buy and sell signals only when the market is aligned.
Instead of flooding the chart with noise, Eagle V 2.0 focuses on precision.
Every signal comes with a calculated stop-loss, three Fibonacci-based take-profit levels, and a confidence score that helps you quickly judge the strength of the setup.
What the Indicator Delivers
Clear Long/Short signals filtered to avoid weak setups
Smart Stop-Loss placement to reduce fake-outs
TP1 / TP2 / TP3 levels automatically calculated based on market movement
AI Confidence Score (0–100) to measure the quality of each opportunity
Real-time Support & Resistance zones that update with market structure
Trend direction and momentum bias across multiple timeframes
Trade history panel showing win rate, total P&L, biggest wins/losses, and your last trades
Dashboard with market conditions, liquidity state, and timeframe bias
Who This Indicator Is For
Scalpers, day traders, and swing traders who want fewer but higher-quality signals, strong risk management, and a tool that adapts to any market—Forex, Crypto, Indices, or Stocks.
Summary
Eagle V 2.0 focuses on the only thing that matters:
Cleaner signals, controlled risk, and stronger results.

Buy on Blue, Sell on Red (EMA + optional RSI) TyusEThis indicator is a trend-following system that helps traders identify potential buy and sell opportunities using a combination of EMA crossovers and an optional RSI filter for confirmation.
It plots:
🔵 Blue dots (BUY signals) when the fast EMA crosses above the slow EMA — signaling bullish momentum.
🔴 Red dots (SELL signals) when the fast EMA crosses below the slow EMA — signaling bearish momentum.
You can optionally filter these signals using the RSI (Relative Strength Index) to avoid false breakouts — for example, only taking BUY signals when RSI is above 55 (showing strength) and SELL signals when RSI is below 45 (showing weakness).
⚙️ Features
Adjustable Fast EMA and Slow EMA lengths
Optional RSI confirmation filter
Customizable RSI thresholds for entries
“Confirm on bar close” setting to reduce repainting
Built-in alert conditions for real-time notifications
💡 How to Use
Use blue dots as potential long entries and red dots as potential short entries.
Confirm direction with overall trend, structure, or higher timeframe alignment.
Combine with support/resistance, volume, or price action for best results.
⚠️ Note
This is a technical tool, not financial advice. Always backtest and use proper risk management before trading live markets.
T.E

Kameniczki RSI MASTERKAMENICZKI RSI MASTER is a professional trading indicator based on RSI (Relative Strength Index) with advanced features for precise identification of trading opportunities. The indicator combines classic RSI analysis with intelligent Zig Zag system and smoothing techniques for maximum signal accuracy.
Features:
RSI Analysis with Gradient Display
The indicator displays RSI in the lower panel with color gradient - blue for overbought zones and pink for oversold zones. RSI is calculated with adjustable period (recommended 14 for daily charts, 7-9 for shorter timeframes).
Zig Zag Signal System
Intelligent Zig Zag system generates BUY and SELL signals based on RSI extremes. The system automatically identifies swing points and creates clear visual markings with blue BUY and pink SELL labels.
Smoothing Moving Average
Advanced smoothing techniques supporting SMA, EMA, SMMA, WMA and VWMA. MA is displayed in price chart with dual-color system - blue for rising trend, pink for falling trend.
Bollinger Bands Integration
Optional Bollinger Bands around RSI and price for volatility identification and potential breakouts. Bands automatically adapt to market conditions.
Comprehensive Alert System
Extensive alert system includes Zig Zag signals, RSI levels, MA direction changes, BB touches and combined strong signals for maximum trading accuracy.
Real-Time Trend Analysis
Instant trend identification with priority for actual price direction. System displays current trend (BUY/SELL/WAIT) and risk analysis with visual table.
Risk Management
Automatic volatility and risk level analysis with percentage expression. System identifies high and low risk periods for safer trading.
Recommended Timeframes:
- 1H, 4H, 1D - optimal for swing trading
- 15M, 30M - for day trading
- 1W - for position trading
Success Rate:
- Zig Zag signals: 75-85% accuracy
- Combined strong signals: 80-90% accuracy
- Trend identification: 70-80% accuracy
- Overall system success: 75-85% with proper settings
⚠️ IMPORTANT WARNING: Zig Zag signals may cause repainting on lower timeframes. For live trading, use higher timeframes (15M, 1H+) or wait for signal confirmation to avoid false signals.
The indicator is suitable for all types of traders - from beginners to professionals, with detailed parameter adjustment options according to individual needs.

Buy Strength in Percentage ( 1-%sell) Strength(1)(14) Version 1This indicator will show (Buy) strength only in percentage(%) on scale from 0% to 100%
Formula: 100% volume = %sell + %buy ( It will only show %Buy ) which means %volume - %sell or 1-%sell = % buy.
Example If it shows buy strength is 5%, it will reflect the candle has a huge sell body with 95% volume is bearish.
This one will works best with a volume indicator to show with a high volume, how many % buy or sell in that volume. You can still easily analyze it through a basic Volume candle in your mind, but this one will be performed in a chart for you to scan it.

TGFA Flexible Alerts Multi-MA CrossoversTGFA Flexible Alerts, Multi-MA Crossovers
Description
Flexible MA crossovers with BUY/SELL alerts, customizable candle colors, and an info box for ATR/volatility insights. Supports EMA/SMA/HMA/VWAP on any chart.
Overview
TGFA Flexible Alerts is a versatile Pine Script indicator for traders seeking customizable moving average (MA) crossovers, visual signals, and quick-reference metrics. It overlays crossover lines (e.g., fast EMA over slow SMA), generates BUY/SELL labels and alerts, colors candles based on themes, and includes an optional info box with ATR bands, support/resistance, and trend projections. Built for any symbol and timeframe (optimized for 1H intraday), it auto-detects Heikin Ashi charts and handles mixed MA types like responsive HMA with lagging EMAs. All logic uses built-in TA functions for reliability—no repainting on confirmed bars.
Key Features
MA Crossover Engine: Configurable lines (EMA, SMA, HMA, VWAP) with dynamic colors (HMA tints green/red based on slope). Enable/disable via inputs.
Invert Signals Toggle: Flips BUY/SELL logic for mixed MA setups (e.g., HMA as fast line over EMA).
Reasoning: Traditional crossovers assume a fast line (low lag) crossing above a slow line (high lag) for buys. HMA's hull design makes it ultra-responsive, so it may "lead" too aggressively—causing premature signals. Inverting aligns it with user intuition (e.g., HMA dipping below then recovering signals strength), reducing false positives in trending markets. Test on your pairs!
Visual Alerts: BUY/SELL labels at crossover price (with optional price display and offset adjustment).
Single MA Overlays: Independent plots for EMA/SMA/HMA/VWAP (length 0 to hide).
Info Box: Real-time table with current price, ±1/2 ATR bands, median price (over lookback), trend (SMA50 slope), volatility % (ATR normalized), support/resistance (recent highs/lows), and reversal projections (tied to SMA50 pivot for up/down bias).
Candle Coloring: 20+ themes (dark/light canvases) for bull/bear/reversal/low-volume bars—e.g., Emerald Blaze greens uptrends, dims on low vol. Toggle off for no changes.
Chart Source Flexibility: Auto-switches to Heikin Ashi if detected; manual override for Regular/HA.
Alerts fire on crossovers/crossunders (custom messages with ticker/interval). Open-source for forking.
How to Use
Add to Chart: Search in TradingView's public library, apply to any symbol (e.g., stocks, forex). Best on 1H for intraday, but works on daily/weekly too.
Setup Crossovers: Choose Line 1/2 types/lengths (e.g., HMA 9 over SMA 20). Enable "Invert Signals" if using HMA—prevents lag mismatches in volatile assets.
Alerts & Labels: Toggle labels for visuals; set TradingView alerts on "Buy"/"Sell" conditions. Use offset for crowded charts.
Info Box Insights: Enable for quick scans—e.g., enter long near support if trend is bullish and price > median. Adjust ATR length (default 14) for sensitivity.
Candle Themes: Pick a scheme (e.g., Neon Pulse for dark mode); it overrides bar colors without altering data.
Customization Tip: For HMA-heavy setups, invert + short lengths (5-9) catch turns early; pair with volume filter in alerts.
Limitations & Disclaimers - Designed for overlay on price charts; may overlap in tight ranges—adjust transparency via styles.
HMA can repaint intra-bar; signals confirm on close. Not back tested for all assets—validate with strategy tester.
Info box projections use SMA(50) as a trend pivot (same for up/down as reference); customize via code for advanced calcs. Candle colors are cosmetic only.
This is an analysis tool, not advice. Trading involves risk; combine with fundamentals/news. Past performance isn't indicative of future results. No liability for losses.
I'm still a newbie, so feedback encouraged!
Thank you!!
ThisGirl

Moon Scalper v3 + VSAMoon Scalper v3 is a high-precision scalping indicator optimized for the 15-minute chart. It delivers clean buy/sell signals with TP1 (1:1 risk-reward) exits using layered confirmations:
• **Volatility Bands** — SMA + multiplier detect expansion zones
• **EMA Filter (200)** — ensures trades align with trend
• **RSI Range Filter** — avoids extreme overbought/oversold traps (buy: 52–62, sell: 38–48)
• **Volume Spike Filter** — filters for institutional activity (vol > 1.4×SMA)
• **VSA Confirmation** — requires wide-spread, high-volume bars with reclaim (volume × 1.4, spread × 1.5, reclaim 50%)
**Usage Notes:**
Best used on 15m timeframe for liquid pairs (e.g., BTCUSDT, ETHUSDT). Signals appear as “BUY” / “SELL” labels on chart. Defaults yield high TP1 hit rate; use only during active sessions (e.g., London/NY) for best accuracy.
**Disclaimer:**
This indicator is for educational purposes only. Past performance is not a guarantee of future results. Always backtest before live trading and manage risk responsibly.

Balanced Big Wicks (50/50) HighlighterThis open-source indicator highlights candles with balanced long wicks (50/50 style)—that is, candles where both upper and lower shadows are each at least 30–60% of the full range and within ~8% of each other, while retaining a substantial body. This specific structure often reflects indecision or liquidity sweeps and can precede strong breakout moves.
How It Works (Inputs and Logic)
Min wick % (each side): 30–60% of candle range
Max body %: up to 60% of range (preserves strong body presence)
Equality tolerance: wicks within 8% of each other
ATR filter (multiples of ATR14): ensures only significant-range candles are flagged
When a “50/50” candle forms, it’s visually colored and labeled; audibly alertable.
How to Use It
Long setup: price closes above the wick-high → potential long entry (SL below wick-low, TP = 1:1).
Short setup: price closes below wick-low → potential short entry (SL above wick-high, TP = 1:1).
Especially effective on 5–15 minute scalping charts when aligned with high-volume sessions or HTF trend context.
Why This Indicator Is Unique
Unlike standard wick or doji voters, this script specifically filters for candles with a strong body and symmetrical wicks, paired with a range filter, reducing noise significantly.
Important Notes
No unrealistic claims: backtested setups indicate high occurrence of clean breakouts, though performance depends on market structure.
Script built responsibly: uses real-time calculations only, no future-data lookahead.
Visuals on the published chart reflect default input values exactly.

Trader's Club IndicatorTrader’s Club Indicator
The Trader’s Club Indicator is an advanced confluence-based tool combining Bollinger Bands , Relative Strength Index (RSI) , VWAP with multi-band overlays , and an intelligent chained divergence detection engine. It identifies potential buy/sell setups by aligning price extremes with momentum shifts and volume-weighted trends. The “E” signal highlights enhanced entry opportunities based on RSI divergence and price candle behaviour — offering a timing edge for informed traders.
TRADING METHOD
This indicator works best on 1-Minute candles. Tested it successfully on XAUUSD.
Buy signal: 'E' in a Blue box.
Sell signal: 'E' in a Red box.
Chained Divergence: White dot on the top or bottom of a candle. This shows possibility of a reversal from that zone.
Use the Buy/Sell signals in conjunction with the VWAP levels. If the Buy/Sell Signals form at VWAP and a key support/resistance level, that is an additional confluence.
Disclaimer
This indicator is for informational and educational purposes only. Trading involves risk, and you are solely responsible for your decisions. Do not rely solely on the buy/sell ‘E’ signals — it’s crucial to use additional confirmation, context, and personal judgment before placing trades. Always practice proper risk management and consider combining this indicator with broader technical or fundamental confluences.

Open Range Breakout (ORB) with Alerts
🚀 ChartsAlgo – Open Range Breakout (ORB) with Alerts
The Open Range Breakout (ORB) Indicator by ChartsAlg is designed for intraday traders looking to capitalize on price movements after the market’s opening range. This tool is especially effective for futures (MNQ, MES) and high-volatility stocks or crypto where initial volatility sets the tone for the session.
This indicator identifies a user-defined opening range window, plots the high/low lines of that range, and visually alerts users when price breaks out above or below the range — with options to customize breakout repetitions, background fill, and alerts.
💡 What is an Open Range Breakout (ORB)?
The opening range represents the high and low established during the first few minutes of the trading session — usually 15 or 30 minutes. Many intraday strategies are based on the idea that breaking out of this initial range often signals strong momentum and trend continuation.
Traders often enter:
Long when price breaks above the range high.
Short when price breaks below the range low.
⚙️ How It Works
You define a session window (e.g., 09:30–09:45 EST).
The indicator tracks the high and low during this time.
Once the session ends, the high and low become your range breakout levels.
The indicator then:
Plots lines for visual clarity
Optionally fills background between the range
Triggers breakout signals if price crosses the levels
Provides alerts when breakouts occur
🛠️ Settings Breakdown
🔹 Session Settings
Range Session: Set your preferred window (e.g., 0930–0945). Can be premarket, first 30 mins, or any custom time.
Time zone: Use "America/New York" for EST (default) or change to "GMT+0" for international traders.
🔹 Breakout Settings
Bullish Breakout Signals: Number of allowed breakout alerts above the range.
Bearish Breakout Signals: Number of allowed breakout alerts below the range.
This prevents repeated alerts once breakout has been confirmed.
🔹 Display Settings
Show Background Fill: Fills area between high/low of the range for easier visual analysis.
Show Breakout Signals: Triangle markers plotted on the chart when breakouts happen.
Only Show Today’s Range: Keeps the chart clean by showing only the most current day’s range.
🔹 Color Settings
Range High/Low Line Colors: Choose any color for clarity.
Range Fill Color: Customize the highlight area for your chart style.
📊 Chart Features
Range High/Low Lines: Automatically plotted after range session ends.
Visual Fill Box: Optional background shading between the opening range.
Triangle Breakout Markers: Appear at the breakout candle.
Alerts: Can be used with TradingView’s alert system to notify you of breakouts in real-time.
🔔 Alerts
Two alert conditions are built in:
Bullish Breakout: Triggers when price breaks above the high of the range.
Bearish Breakout: Triggers when price breaks below the low of the range.
Example Alert Message:
📈 “Bullish Breakout above Open Range on AAPL!”
To activate:
Click “🔔 Alerts” on TradingView.
Set condition to this script.
Choose “ORB Breakout Up” or “ORB Breakout Down”.
Choose alert frequency and notification method.
⚠️ DISCLAIMER
ChartsAlgo tools are for informational and educational purposes only.
They are not financial advice or signals. Past performance does not guarantee future results. Use at your own risk and always implement solid risk management.
By using this indicator, you agree that you are solely responsible for any trades or decisions made based on the information provided.

Adaptive Volume‐Demand‐Index (AVDI)Demand Index (according to James Sibbet) – Short Description
The Demand Index (DI) was developed by James Sibbet to measure real “buying” vs. “selling” strength (Demand vs. Supply) using price and volume data. It is not a standalone trading signal, but rather a filter and trend confirmer that should always be used together with chart structure and additional indicators.
---
\ 1. Calculation Basis\
1. Volume Normalization
$$
\text{normVol}_t
= \frac{\text{Volume}_t}{\mathrm{EMA}(\text{Volume},\,n_{\text{Vol}})_t}
\quad(\text{e.g., }n_{\text{Vol}} = 13)
$$
This smooths out extremely high volume spikes and compares them to the average (≈ 1 means “average volume”).
2. Price Factor
$$
\text{priceFactor}_t
= \frac{\text{Close}_t - \text{Open}_t}{\text{Open}_t}.
$$
Positive values for bullish bars, negative for bearish bars.
3. Component per Bar
$$
\text{component}_t
= \text{normVol}_t \times \text{priceFactor}_t.
$$
If volume is above average (> 1) and the price rises slightly, this yields a noticeably positive value; conversely if the price falls.
4. Raw DI (Rolling Sum)
Over a window of \$w\$ bars (e.g., 20):
$$
\text{RawDI}_t
= \sum_{i=0}^{w-1} \text{component}_{\,t-i}.
$$
Alternatively, recursively for \$t \ge w\$:
$$
\text{RawDI}_t
= \text{RawDI}_{t-1}
+ \text{component}_t
- \text{component}_{\,t-w}.
$$
5. Optional EMA Smoothing
An EMA over RawDI (e.g., \$n\_{\text{DI}} = 50\$) reduces short-term fluctuations and highlights medium-term trends:
$$
\text{EMA\_DI}_t
= \mathrm{EMA}(\text{RawDI},\,n_{\text{DI}})_t.
$$
6.Zero Line
Handy guideline:
RawDI > 0: Accumulated buying power dominates.
RawDI < 0: Accumulated selling power dominates.
2. Interpretation & Application
Crossing Zero
RawDI above zero → Indication of increasing buying pressure (potential long signal).
RawDI below zero → Indication of increasing selling pressure (potential short signal).
Not to be used alone for entry—always confirm with price action.
RawDI vs. EMA_DI
RawDI > EMA\_DI → Acceleration of demand.
RawDI < EMA\_DI → Weakening of demand.
Divergences
Price makes a new high, RawDI does not make a higher high → potential weakness in the uptrend.
Price makes a new low, RawDI does not make a lower low → potential exhaustion of the downtrend.
3. Typical Signals (for Beginners)
\ 1. Long Setup\
RawDI crosses zero from below,
RawDI > EMA\_DI (acceleration),
Price closes above a short-term swing high or resistance.
Stop-Loss: just below the last swing low, Take-Profit/Trailing: on reversal signals or fixed R\:R.
2. Short Setup
RawDI crosses zero from above,
RawDI < EMA\_DI (increased selling pressure),
Price closes below a short-term swing low or support.
Stop-Loss: just above the last swing high.
---
4. Notes and Parameters
Recommended Values (Beginners):
Volume EMA (n₍Vol₎) = 13
RawDI window (w) = 20
EMA over DI (n₍DI₎) = 50 (medium-term) or 1 (no smoothing)
Attention:\
NEVER use in isolation. Always in combination with price action analysis (trendlines, support/resistance, candlestick patterns).
Especially during volatile news phases, RawDI can fluctuate strongly → EMA\_DI helps to avoid false signals.
---
Conclusion The Demand Index by James Sibbet is a powerful filter to assess price movements by their volume backing. It shows whether a rally is truly driven by demand or merely a short-term volume anomaly. In combination with classic chart analysis and risk management, it helps to identify robust entry points and potential trend reversals earlier.

True Momentum IndexTrue Momentum Index (TMI) — Precision Trading by Trading_Tomm
The True Momentum Index (TMI) is a cutting-edge technical indicator developed for traders who demand accuracy, clarity, and consistency across all market conditions. Designed by Trading_Tomm , this indicator provides a reliable method to identify high-probability entry and exit points by analyzing real-time momentum shifts and volatility levels.
Key Benefits:
1. Multi-Timeframe Versatility: Whether you're scalping on a 1-minute chart or investing on the weekly, TMI adapts seamlessly to your strategy.
2. Enhanced Risk Management: By highlighting optimal trade zones, TMI helps improve your reward-to-risk ratio and reduce exposure to false signals.
3. Clear Trend Detection: Instantly distinguish between trending, ranging, or consolidating markets.
4. Breakout Confirmation: Spot true breakout opportunities with confidence, supported by Bollinger Band overlays.
5. Universal Applicability: Works effectively with stocks, forex, cryptocurrency, commodities, and indices.
TMI’s intuitive visual presentation and precision signals make it an essential tool for both new and experienced traders. Whether you're trading volatile crypto markets or steady equities, the True Momentum Index gives you the edge to trade with discipline, clarity, and confidence.
Start using the True Momentum Index and take your trading strategy to the next level -maximize potential, minimize uncertainty.

Reversal Trading Bot Strategy[BullByte]Overview :
The indicator Reversal Trading Bot Strategy is crafted to capture potential market reversal points by combining momentum, volatility, and trend alignment filters. It uses a blend of technical indicators to identify both bullish and bearish reversal setups, ensuring that multiple market conditions are met before entering a trade.
Core Components :
Technical Indicators Used :
RSI (Relative Strength Index) :
Purpose : Detects divergence conditions by comparing recent lows/highs in price with the RSI.
Parameter : Length of 8.
Bollinger Bands (BB) :
Purpose : Measures volatility and identifies price levels that are statistically extreme.
Parameter : Length of 20 and a 2-standard deviation multiplier.
ADX (Average Directional Index) & DMI (Directional Movement Index) :
Purpose : Quantifies the strength of the trend. The ADX threshold is set at 20, and additional filters check for the alignment of the directional indicators (DI+ and DI–).
ATR (Average True Range) :
Purpose : Provides a volatility measure used to set stop levels and determine risk through trailing stops.
Volume SMA (Simple Moving Average of Volume ):
Purpose : Helps confirm strength by comparing the current volume against a 20-period average, with an optional filter to ensure volume is at least twice the SMA.
User-Defined Toggle Filters :
Volume Filter : Confirms that the volume is above average (or twice the SMA) before taking trades.
ADX Trend Alignment Filter : Checks that the ADX’s directional indicators support the trade direction.
BB Close Confirmation : Optionally refines the entry by requiring price to be beyond the upper or lower Bollinger Band rather than just above or below.
RSI Divergence Exit : Allows the script to close positions if RSI divergence is detected.
BB Mean Reversion Exit : Closes positions if the price reverts to the Bollinger Bands’ middle line.
Risk/Reward Filter : Ensures that the potential reward is at least twice the risk by comparing the distance to the Bollinger Band with the ATR.
Candle Movement Filter : Optional filter to require a minimum percentage move in the candle to confirm momentum.
ADX Trend Exit : Closes positions if the ADX falls below the threshold and the directional indicators reverse.
Entry Conditions :
Bullish Entry :
RSI Divergence : Checks if the current close is lower than a previous low while the RSI is above the previous low, suggesting bullish divergence.
Bollinger Confirmation : Requires that the price is above the lower (or upper if confirmation is toggled) Bollinger Band.
Volume & Trend Filters : Combines volume condition, ADX strength, and an optional candle momentum condition.
Risk/Reward Check : Validates that the trade meets a favorable risk-to-reward ratio.
Bearish Entry :
Uses a mirror logic of the bullish entry by checking for bearish divergence, ensuring the price is below the appropriate Bollinger level, and confirming volume, trend strength, candle pattern, and risk/reward criteria.
Trade Execution and Exit Strateg y:
Trade Execution :
Upon meeting the entry conditions, the strategy initiates a long or short position.
Stop Loss & Trailing Stops :
A stop-loss is dynamically set using the ATR value, and trailing stops are implemented as a percentage of the close price.
Exit Conditions :
Additional exit filters can trigger early closures based on RSI divergence, mean reversion (via the middle Bollinger Band), or a weakening trend as signaled by ADX falling below its threshold.
This multi-layered exit strategy is designed to lock in gains or minimize losses if the market begins to reverse unexpectedly.
How the Strategy Works in Different Market Conditions :
Trending Markets :
The ADX filter ensures that trades are only taken when the trend is strong. When the market is trending, the directional movement indicators help confirm the momentum, making the reversal signal more reliable.
Ranging Markets :
In choppy markets, the Bollinger Bands expand and contract, while the RSI divergence can highlight potential turning points. The optional filters can be adjusted to avoid false signals in low-volume or low-volatility conditions.
Volatility Management :
With ATR-based stop-losses and a risk/reward filter, the strategy adapts to current market volatility, ensuring that risk is managed consistently.
Recommendation on using this Strategy with a Trading Bot :
This strategy is well-suited for high-frequency trading (HFT) due to its ability to quickly identify reversal setups and execute trades dynamically with automated stop-loss and trailing exits. By integrating this script with a TradingView webhook-based bot or an API-driven execution system, traders can automate trade entries and exits in real-time, reducing manual execution delays and capitalizing on fast market movements.
Disclaimer :
This script is provided for educational and informational purposes only. It is not intended as investment advice. Trading involves significant risk, and you should always conduct your own research and analysis before making any trading decisions. The author is not responsible for any losses incurred while using this script.

Forexsom MA Crossover SignalsA Trend-Following Trading Indicator for TradingView
Overview
This indicator plots two moving averages (MA) on your chart and generates visual signals when they cross, helping traders identify potential trend reversals. It is designed to be simple yet effective for both beginners and experienced traders.
Key Features
✅ Dual Moving Averages – Plots a Fast MA (default: 9-period) and a Slow MA (default: 21-period)
✅ Customizable MA Types – Choose between EMA (Exponential Moving Average) or SMA (Simple Moving Average)
✅ Clear Buy/Sell Signals – Displays "BUY" (green label) when the Fast MA crosses above the Slow MA and "SELL" (red label) when it crosses below
✅ Alerts – Get notified when new signals appear (compatible with TradingView alerts)
✅ Clean Visuals – Easy-to-read moving averages with adjustable colors
How It Works
Bullish Signal (BUY) → Fast MA crosses above Slow MA (suggests uptrend)
Bearish Signal (SELL) → Fast MA crosses below Slow MA (suggests downtrend)
Best Used For
✔ Trend-following strategies (swing trading, day trading)
✔ Confirming trend reversals
✔ Filtering trade entries in combination with other indicators
Customization Options
Adjust Fast & Slow MA lengths
Switch between EMA or SMA for smoother or more responsive signals
Why Use This Indicator?
Simple & Effective – No clutter, just clear signals
Works on All Timeframes – From scalping (1M, 5M) to long-term trading (4H, Daily)
Alerts for Real-Time Trading – Never miss a signal

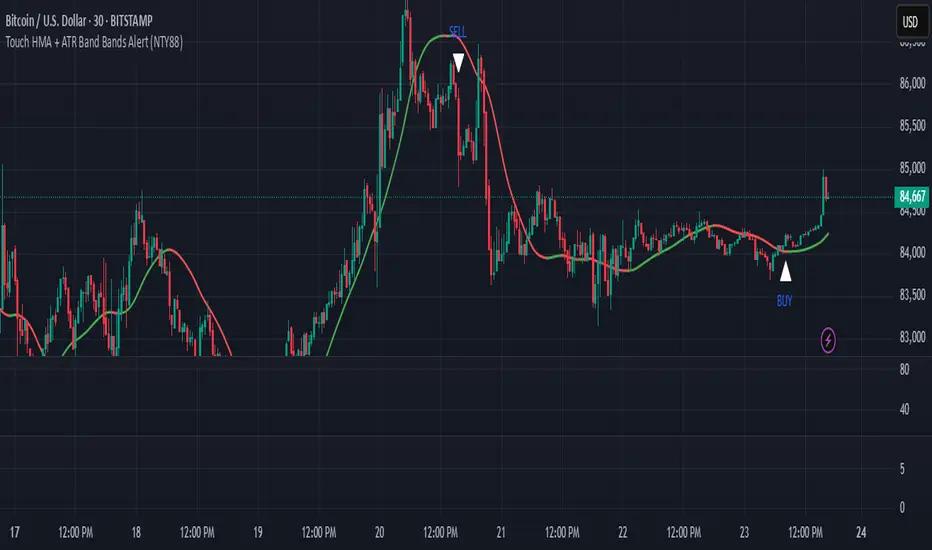
Touch HMA + ATR Band Bands Alert (NTY88)🔔 Precision Alerts | No Repainting | ATR-Based Touch Detection | HMA Trend Coloring
This script is a clean and powerful tool designed to help you catch precise market reversals using ATR Band touches combined with trend-following logic.
📌 How It Works
A custom Hull Moving Average (HMA) is used to track the trend.
Two dynamic ATR-based bands are drawn above and below the HMA.
A signal is generated when the closing price touches the upper or lower ATR band within a small tolerance zone.
✅ Key Features
🔁 Alternating Signals: Only one Buy → then one Sell → then Buy again. No signal spam.
🟢🔴 Color-Changing HMA Line: Green = HMA rising | Red = HMA falling
📏 Price Tolerance Input: Define how close the candle must be to the ATR band to trigger a signal.
🔔 Real-Time Alerts: Easily set alerts for Buy and Sell signals — works in live markets.
🚫 No Repainting: All signals are confirmed at candle close and will not change afterward.
🎯 When to Use
Great for trend reversals, scalping zones, or identifying potential exhaustion points.
Works well on any timeframe or market (crypto, stocks, forex).
💬 Pro Tip:
Combine this with RSI, Volume, or ADX filters to build a complete confluence system.
📈 Built for traders who love clean logic, precision entries, and visual clarity.
Rabbit Moves - Buy Sell Signals (No Repaint)The Rabbit Moves - Buy Sell Signals (No Repaint) is a powerful TradingView indicator designed to help traders identify potential buy and sell opportunities in the market. By combining the RSI (Relative Strength Index), EMA (Exponential Moving Average), and momentum analysis, this indicator provides clear entry signals for bullish and bearish market movements.
Unlike many repainting indicators, Rabbit Moves ensures reliability by locking in signals once they appear, preventing misleading backtesting results.
How It Works
1. RSI: The Relative Strength Index (RSI) measures the magnitude of recent price changes to evaluate overbought or oversold conditions. A crossover above 50 signals potential bullish momentum, while crossing below 50 suggests bearish momentum.
2. EMA: The Exponential Moving Average (EMA) is used to smooth price data and generate dynamic support or resistance levels. A crossover above the EMA indicates a bullish condition, while a cross below suggests a bearish condition.
3. Momentum: The momentum indicator measures the rate of change of the price and confirms whether the trend is strengthening (bullish) or weakening (bearish).
4. Buy/Sell Percentage:
o The indicator calculates the Buy (Bullish) and Sell (Bearish) probabilities based on the lookback period, which analyzes recent price action to determine how often the market has closed in either direction.
o The Buy Percentage is calculated by determining the number of times the price moved upwards in the past lookback bars, expressed as a percentage of the total observations.
o The Sell Percentage is the inverse, showing the percentage of times the price moved down in the same lookback period.
o These percentages help you assess the likelihood of the next candlestick closing in the predicted direction (up or down), offering additional confirmation for your trades.
Additionally, the indicator calculates the probability of bullish or bearish moves within a defined lookback period. These probabilities are displayed on the chart as percentages, helping traders assess market sentiment.
How to Use the Indicator
1. How to Access
o Kindly check out authors instructions, how you can access this indicator
2. Interpreting the Signals
o Green upward arrow → Indicates a potential buy signal.
o Red downward arrow → Indicates a potential sell signal.
o Probability Display → Shows the likelihood of bullish vs. bearish movements based on historical data.
3. Enhancing Your Strategy
o Use this indicator in combination with support & resistance levels, volume analysis, and price action for better accuracy.
o Apply risk management techniques, such as stop-loss orders and position sizing, to minimize losses.
Why Use This Indicator?
✅ No Repainting – Ensures accurate backtesting and real-time reliability.
✅ Probability-Based Insights – Helps gauge market sentiment before making a trade.
✅ Combines Multiple Technical Factors – Increases accuracy by using RSI, EMA, and momentum together.
✅ Easy-to-Use Signals – Clear buy/sell alerts with visual representation on the chart.
This indicator is designed to work on Forex, Crypto, Stocks, and other financial markets.
Disclaimer:
This indicator is intended solely for educational and informational purposes. It does not constitute financial or investment advice. Trading in financial markets involves significant risk, and past performance is not indicative of future results. Users are responsible for their own trading decisions and should carefully evaluate their risk tolerance and objectives. Always seek professional financial advice before engaging in trading activities.

Dynamic EMA CrossoverThe Dynamic EMA Crossover indicator is designed to help traders identify trend transitions, visually understand market direction, and detect sideways consolidation zones. It simplifies decision-making by dynamically changing colors and highlighting areas of interest.
Key Features:
1. Dynamic EMA Crossovers:
• Uses two EMAs (default: 9 and 26 ) to identify bullish and bearish trends.
• EMAs and the area between them turn green during bullish trends and red during bearish trends for easy visualization.
2. Sideways Market Detection:
• Automatically detects periods of market consolidation when EMAs overlap for 10 consecutive candles and the price movement remains narrow.
• Sideways zones are highlighted with grey background, helping traders avoid false breakouts and trendless markets.
3. Customizable Inputs:
• Adjust the lengths of the two EMAs and the sensitivity of the overlap detection to match your trading style and market conditions.
How It Works:
• Trend Identification:
• When the shorter EMA crosses above the longer EMA, a bullish trend is indicated.
• When the shorter EMA crosses below the longer EMA, a bearish trend is indicated.
• The indicator dynamically adjusts the colors of the EMAs and fills the area between them for clear trend visibility.
• Sideways Market Detection:
• When the shorter EMA and longer EMA stay close (within a customizable sensitivity) for a fixed period (hardcoded to 10 candles), the indicator identifies a sideways market.
• This feature helps traders avoid entering trades during choppy or indecisive market conditions.
Who Is This For?
This indicator is ideal for:
• Trend traders looking for clear signals of trend direction.
• Swing traders who want to avoid trading in sideways markets.
• Scalpers who need quick and reliable visual cues for short-term market behavior.
Use Cases:
1. Bullish/Bearish Trends:
• Enter trades in the direction of the trend as the crossover occurs and colors change.
2. Sideways Zones:
• Avoid trades during periods of consolidation and wait for a clear breakout.
Mashup Logic:
This indicator combines:
1. EMA Crossovers:
• A tried-and-tested method for trend detection using two moving averages.
• Dynamic visual cues for bullish and bearish market phases.
2. Sideways Market Detection:
• Innovative logic to highlight sideways zones based on EMA overlap and price range analysis.
• Helps reduce noise and avoid trading during trendless periods.
3. Customization and Flexibility:
• Fully adjustable EMA lengths and overlap sensitivity to adapt to different markets and trading styles.
Improved G-Trend DetectionIt is the Improved version of G trend channel detection.
The Umair Trend Detection Indicator is a powerful tool designed to help traders identify potential buy and sell opportunities by combining dynamic price channels with RSI-based confirmation. This indicator is suitable for all types of financial markets, including stocks, forex, and cryptocurrencies.
Key Features:
Dynamic G-Channels
Calculates upper, lower, and average price channels based on the "G-Channel" methodology.
Helps identify market extremes and potential reversal points.
RSI Confirmation
Integrates RSI (Relative Strength Index) to filter buy and sell signals.
Avoids false signals by ensuring market momentum aligns with trend direction.
Buy/Sell Signals
Generates "Buy" signals when bullish conditions align with oversold RSI levels.
Generates "Sell" signals when bearish conditions align with overbought RSI levels.
Exit Signals
Provides optional exit points for both long and short positions using a buffer for confirmation.
Visual Clarity
Displays clearly plotted channels and average lines to help visualize price trends.
Buy and sell signals are marked with arrows for easy identification on the chart.
Custom Alerts
Offers customizable alerts for buy, sell, and exit conditions, ensuring traders never miss an opportunity.
Input Parameters:
Channel Length: Controls the sensitivity of the G-Channels.
Multiplier: Adjusts the width of the channels to suit different market conditions.
RSI Settings: Customize RSI length and thresholds for overbought/oversold conditions.
Exit Signal Buffer: Adds flexibility to the exit strategy by delaying signals for confirmation.
How It Helps:
The Umair Trend Detection Indicator is perfect for traders looking for an easy-to-use trend-following system with strong confirmation. By combining dynamic channels with RSI, it provides accurate and reliable signals to enter and exit trades, minimizing risks associated with false breakouts or trend reversals.
Use Cases:
Trend Trading: Identify and follow long-term trends with confidence.
Swing Trading: Spot reversals and capitalize on medium-term price movements.
Risk Management: Use exit signals to lock in profits or limit losses effectively.
This indicator is a versatile tool for both novice and experienced traders. Fine-tune its settings to align with your trading style and improve your decision-making in any market.

Dynamic RSI with Overbought/Oversold LinesDynamic RSI with Overbought/Oversold Lines
This indicator enhances the traditional RSI (Relative Strength Index) by dynamically adjusting the overbought and oversold levels based on the highest and lowest RSI values over a user-defined period. The indicator plots these levels as horizontal lines, allowing traders to visually identify when the market is "overbought" or "oversold."
Features:
Dynamic Overbought/Oversold Levels: Automatically adjusts the overbought and oversold levels based on the highest and lowest RSI values within the defined period, ensuring more accurate signals tailored to the current market conditions.
Customizable RSI Period: Choose your preferred RSI period to suit your trading strategy.
Signal Alerts: Visual signals are displayed when the RSI crosses into the overbought or oversold zone, indicating potential reversal points.
Background Color Alerts: The background changes color when the RSI exceeds overbought or oversold levels, making it easier to spot these important zones at a glance.
Clean and Simple: A minimalist design focusing on the key elements, making it suitable for all traders.
How to Use:
Overbought Zone: When the RSI moves above the overbought line (red), it may indicate that the asset is overbought, signaling a potential price reversal or pullback.
Oversold Zone: When the RSI moves below the oversold line (green), it may indicate that the asset is oversold, signaling a potential price bounce or reversal.
This dynamic RSI indicator is perfect for those looking to capture market extremes and improve their trading decisions. It's especially useful for timeframes like 30-minute and 1-hour charts, where market conditions tend to shift more rapidly.
