Buy
Strategy PyramiCoverStrategy for pyramidization and coverage. (Indicator PyramiCover)
Recommended time frame 60 min.

Alex_Profit This identifies Buy and Sell Points once the period high breaches the SMA High and period low breaches the SMA Low. It produces profitable results greater than 80% of the time.

Premium Stochastic OscillatorThe PSO is a rewired version of a short-period stochastic. Unlike a standard stochastic oscillator, this indicator is normalized to register neutral values at zero while providing greater sensitivity to short-term price moves. This indicator uses a central zero line as a reference point and will oscillate above and below this point as price fluctuates. In addition, the PSO is smoothed by using a double exponential moving average to provide a more even response to turns in the market.
(from TASC magazine, August 2008 issue).
The Premium Stochastic Oscillator was introduced by technical analyst Lee Leibfarth.

Normalized Smoothed MACDMACD normalized with its highest and lowest values over the last “Normalization period”
- includes alerts

KDJ Indicator The KDJ indicator is derived from the Stochastic with the one difference being the addition of the J line. This implies that the KDJ indicator has a total of three lines; %K%D%J. The %J is simply put, the difference between the %K and the %D lines, which is similar to the MACD.
The difference between the %J and that of the MACD is that it is plotted as a histogram and the second being that the value are weighted and as such delivers more emphasis on the shorter term %K line.
What we now have is a line that moves quite slowly and has the knack to move beyond the range of a normal stochastic indicator.

Bollinger Band BreakoutIt is a long only strategy.
1. Buy when price breaks out of the upper band.
2. Exit has two options. Option 1 allows you to exit using lower band. Option 2 allows you to exit using moving average.
3. Option 1 preferred over option 2 if the instrument is highly volatile.
4. Slippage and commissions are not considered in the return calculation.

Market ModeThe Market Mode indicator seeks to identify trends and rebounds by identifying “phases” according to the principles of John Ehlers.
- When the oscillator passes above the top line, the market is in an uptrend.
- When the oscillator goes below the bottom line, the market is in a downtrend.
- Between these two levels, the market is calmer and could rebound in the direction of the initial trend and / or phase of trend change.

Strategy Quadratic Semaphore I add a basic strategy for the "Quadratic traffic light" indicator, it can help to find a good configuration.
Regards.
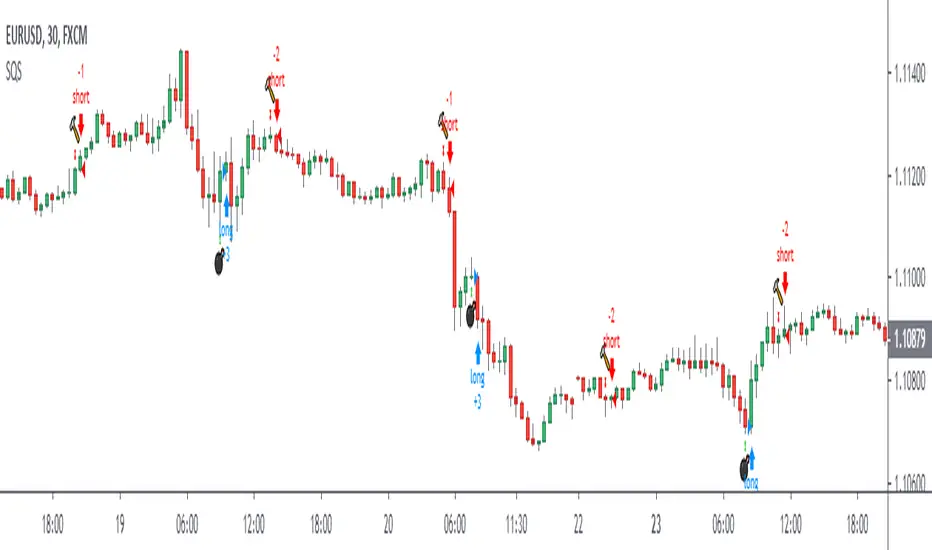
Quadratic SemaphoreThe quadratic semaphore indicator is an indicator that find confirmed market u-turn with the help of 2 quadratic regression calculated with Highs and Lows over the last “length” periods.
- “p” setting is candlesticks quantity to confirmed the quadratic regression has formed a High or Low parabola, such as Fractals. Consecutive same signals can happen due to the use of different price values for upper and lower semaphore.
- Adjust the settings to your instrument and time frame.
- Alerts included.
Success with your trade¡¡
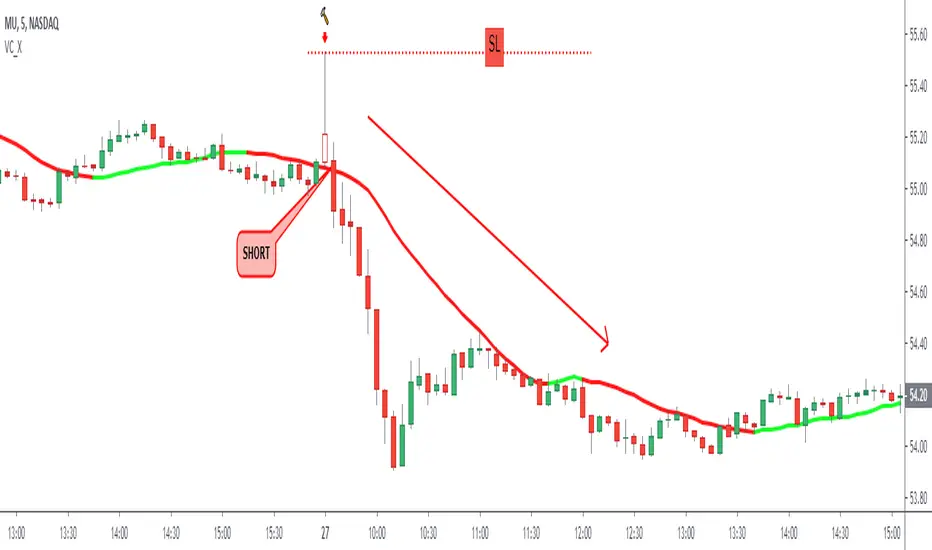
Long Tail Candle by Oliver VelezThis script detects an event created by Oliver Velez, it is a wide-range candle with a small body and a long tail (hammer-type candle), its range is noticeably larger than previous candles, as a rule it can be taken that the body should be maximum of 30% of the total range of the candle with a long tail. The stop goes under the tail and the signal is given when the next candle followed by the long tail candle exceeds its body, do not program this condition so that the alert indicates that a long tail candle was generated and the trader has some Time to visualize the graph and wait for the signal.
The default configuration is very basic, each trader must adjust to their needs.
- Trend filters can be activated.
- Alerts available.
Thumbs up
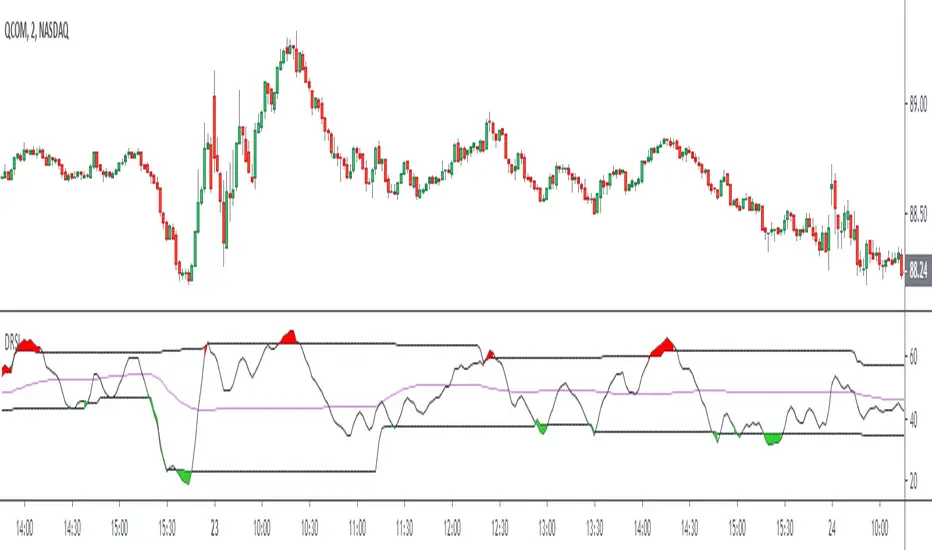
Dynamic RSIThe Dynamic RSI indicator is a kind of exponential RSI. The overbought and oversold levels (respectively HiLine and LoLine) are calculated according to the recent highest and lowest values of the Dynamic RSI line.
TMMS OscillatorThe TMMS oscillator (aka “Trading Made More Simpler”) is an indicator made of conditions based on both 2 separated Stochastic and 1 RSI.
Bullish zone is green and bearish one is red. When the histogram is grey, no signals is available at that time.
The indicator has an option to show the current trend of an Hull moving average (ascending or descending curve). When the trend is up, green dots are plotted on the zero line. When the trend is down, the dots are coloured in red.
Greetings, success with your trade!!!

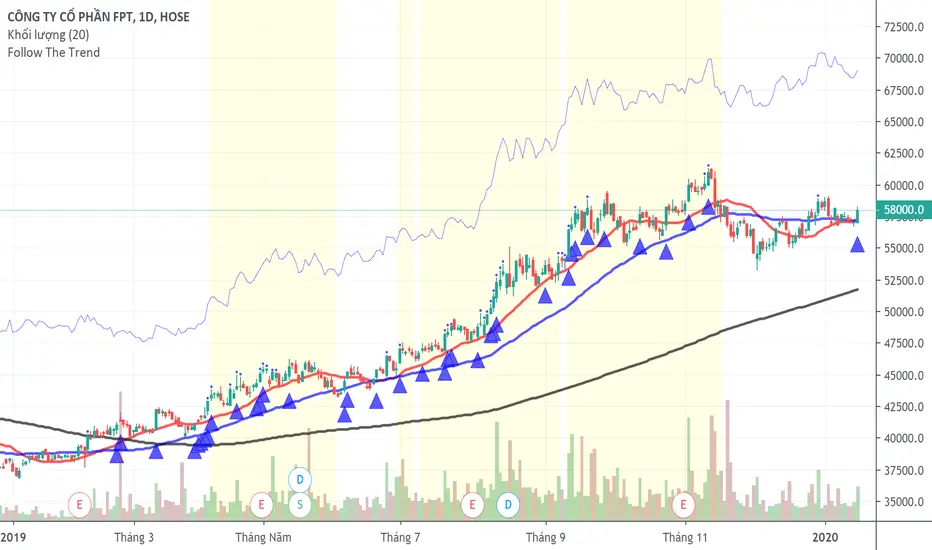
Follow The TrendFollow the trend system
The system uses MA20 as trailing stoploss and marks the strong trending area with color yellow.
This system only uses for stock and Long position.
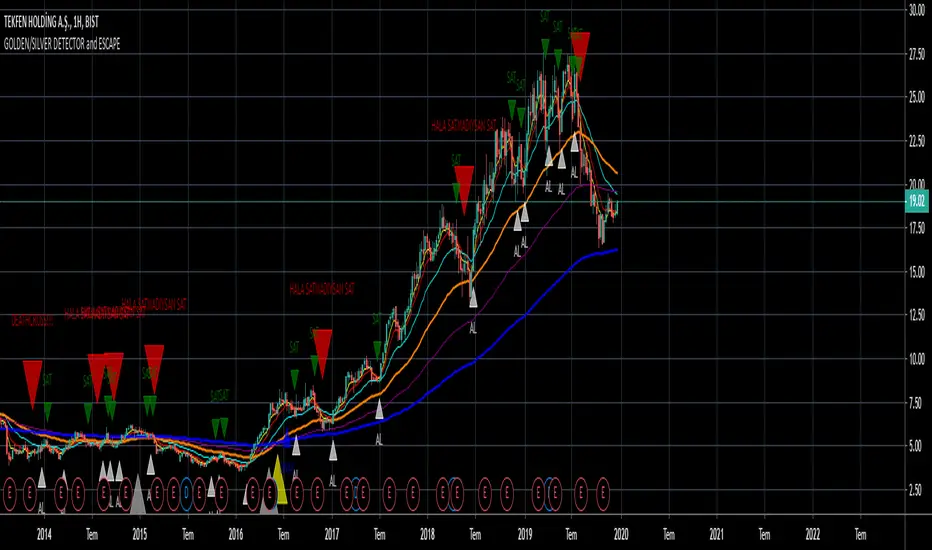
GOLDEN/SILVER DETECTORFind golden and silver crosses with using EMA.
Note
Colors are depends on you.
Translation
AL = BUY
SAT = SELL
ONAY = CONFIRMATION
BUY and SELL - Backtest single EMA cross By che_traderHi, I hope you're well!
At the request of my friend @jansrbtc I'm going to publish a simple emas crossing strategy.
We will do long or short at the cross of the two ema.
Good strategy for when an asset is in trend.
Warm: In choppy periods this indicator can be very affected by large drawdowns.
Enjoy!

Dreadblitz BarsThese bars can give you good opportunities if you know how to analyze the context.
blue=bullish
black=bearish
thumbs up
Epic Market Indicator 3.0 (EMI 1)After months and months of back-testing, I have finally decided to release this update. I would also like to give out a special thanks to Tradingview for making it possible to create indicators and share this with the community. I have occurred a lot of information in this community. I believe that when you take, you should also share. That’s why I am sharing this wonderful indicator for free. Remember, knowledge and experience is the most valuable things in life.
EMI, Epic Market Indicator:
60-74% theoretically profitable trades, depending on the time period. However if you use EMI blindly, the percentage might even go lower. Nevertheless, there should be enough presenting opportunities, if you use her wisely.
Like in the movie Inception, the deeper and longer you thread into dream within a dream etc., the more dangerous or riskier it becomes. It is recommended to use EMI on 15 min. charts and above. I do not recommend using EMI on altcoin markets.
Tip: People = Psychology > Patterns > Indicators. They are all important nonetheless and explicitly keep this order in the back of your mind when using EMI.
EMI 1 is actually a combination of diverse indicators such as EMA, SMA, Pivots etc. I have turned of certain indicators by default, those I do not need to see most of the time:
- Tesla EMA Ribbon: Periods based upon Nikola Tesla's favorite numbers, 3, 6, 9. (Enabled by default)
- Fibonacci EMA Ribbon: Periods based upon Fibonacci frequency; 13, 21, 55, 89. (Enabled by default)
- Pivots (Disabled by default).
-Bollinger bands (Disabled by default).
- SMA 100 & 200 (Disabled by default).
- Bar trend color: red = bearish & green = bullish (Disabled by default).
-Buy & Sell signals, which makes EMI a unique indicator: Based upon diverse indicators & oscillators. Not predictions, but high probabilities. (Enabled by default, obviously ^^ )
Red symbols are sell or short signals / Green symbols are buy or long signals.
Dots represents possible price action trend reversals and the diamond symbols could be a possible confirmation and the big X is even a stronger confirmation signal. (A top or bottom, not THE bottom or top). These signals are based upon certain buy & sell conditions by a diversity of indicators known by most traders. Think for example, crossing EMA’s, Stochastic RSI, MACD, oversold and overbought territories.
ALWAYS wait for the candle to close and another confirmations before taking any consideration nor actions. No signals means trend continuation.
Using EMI1 in combination with EMI 2, traditional authentic patterns and darkened theme is recommended. Good luck fellow traders and don't forget to smash that like button! Thanks in advance.


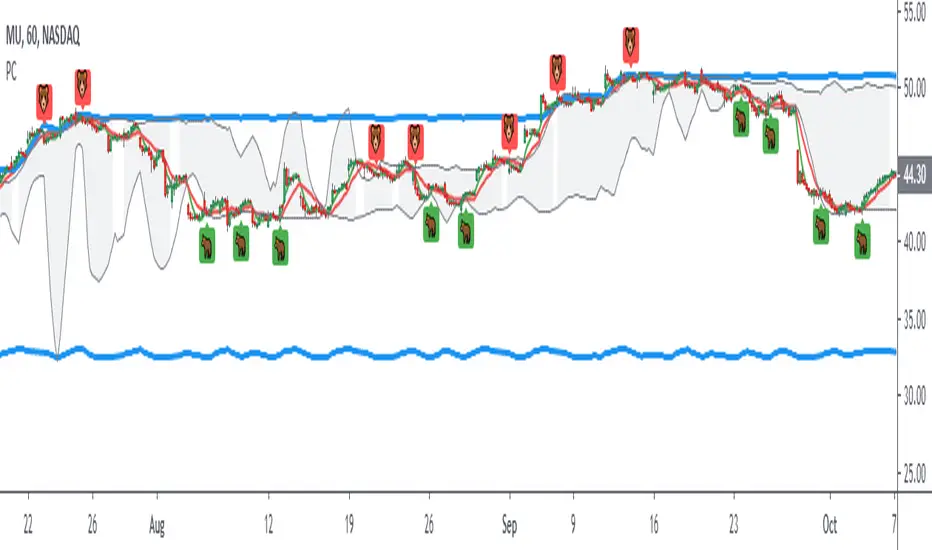
Death To The BearAre you a bear ? RUN!! RUN!! Your life is short here!
Dear friends, I bring you this indicator that you will like, no complexity, just buy signals.
We will try to find possible turning areas, and you will have 6 weapons to use.
Look at the simple configuration:
- BOMB
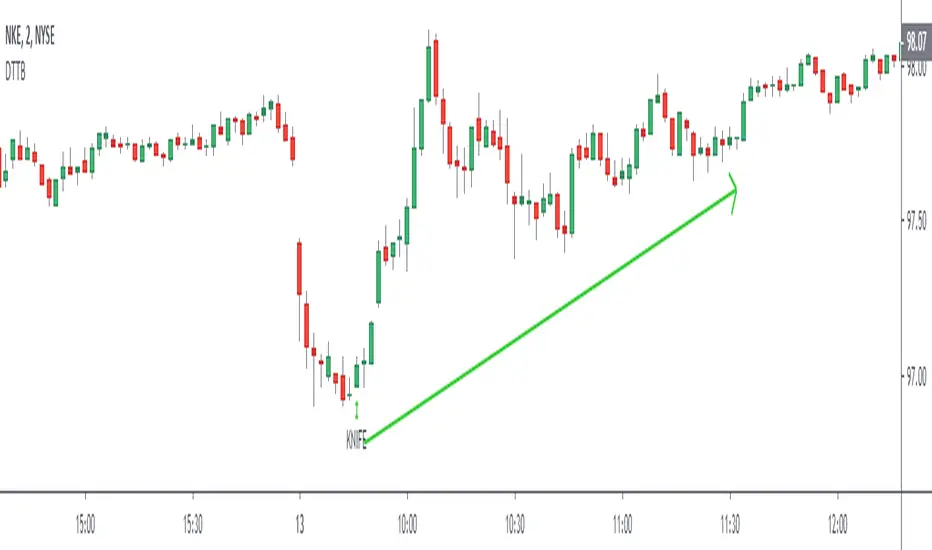
- KNIFE
- DYNAMITE
- DAGGER
- GUN
- CHEMICAL
- Minimum Level
let's start...
BOMB = high probability of turning
strong bearish trend bombs? it doesn't matter .. does it reach you a 3: 1 ratio? You can make a quick play.
KNIFE = a little more confirmation and excellent weapon to average positions
DYNAMITE = excellent weapon to massively dynamite low areas and also solitary dynamites
DAGGER = excellent weapon to average price
GUN = good shots for patient people who want to average price and look for a more extensive movement
CHEMICAL = I really like this to average the price while I have a nice drink
Minimum Level = you can modify this variable, negative values look for more depth in the market but you will have less signals, positive values look for less depth in the market but you will have more signals, by default = 0
Very simple, without complications!!
aaaa .... but can I activate several weapons at once? of course BOOOOOOMMMM .... poor bears !!!
Anything else? Yes of course....
- All alerts ready to use
LISTEN TO ME ... ADD THE INDICATOR, TAKE YOUR TIME, TEST DIFFERENT CONFIGURATIONS, TEST DIFFERENT TIME FRAMES, TEST DIFFERENT ACTIVE, SEARCH AND FIND, PATIENCE ...... OK READY?
WE WILL MAKE MONEY AND KILL OUR DEAR BEARS!
APPLY A GOOD RISK MANAGEMENT.
NOTE: GOOD INSTRUMENT DATA WITH REAL VOLUME IS REQUIRED
thumbs up!!!!
[astropark] Renko RSI divergencesDear Followers,
today a new great Scalper Tool , which works excellent from 1 minute timeframe Renko chart , which is the best and more secure timeframe to use on a Renko chart. But of course it works great on all timeframes (included the 1D timeframe)!
This tool has some cool features:
it works on all timeframes , starting from 1 minute: so you can enjoy high-frequency trading by using a 24/7 running bot and a proper money and risk management strategy;
it shows you both bullish and bearish divergences with a triangle up or down respectively
when it finds a strong bullish/bearish divergence , a flag will be displayed instead of a triangle
This script will let you set all notifications you may need in order to be alerted on each triggered divergence.
You may like to use it together with my Renko Scalper V2
On Bitmex/ByBit/Binance Bitcoin/USD chart best settings is Traditional Renko chart with 10$ box size, while 0.5$ box size is suggested on Ethereum/USD pair.
This is a premium indicator , so send me a private message in order to get access to this script.

Bull MountainsAre you a BEAR?
Then get out of here!
This indicator is only for long movements, its reading is simple and if you use it correctly it will give you very good results, the components are:
The highest quality configuration is as follows:
It is not necessary that all the components are aligned, the appearance of the upper mountain on the lower mountain is already a good sign, but if you add some seasoning more the soup will be better =)
Note: once the position is taken, it is the trader's responsibility to manage it. INSTRUMENTS WITH REAL VOLUME ARE REQUIRED FOR THIS INDICATOR.
tip: what would happen if you look for the signal in an upper frame and then look for an input in a lower frame? mmmmm....
tip: play with the 'Length' setting and see what happens
Bull a thumbs up please!
I wish you many greens !!

Peakestsignal Indicator - Valuetrading Indicator - Cheap Entry'sPrivate indicator.
HI BIG PLAYERS
Are you looking for the cheapest entry signal for trading?
This indicator gives the really cheaply entry signals. For buysignals you get a green background vertical line and for sellsignals you get a red background vertical line.
If you have a trend strategy and only need THE TREND for trading: believe me, this indicator give you the right signals.
Alerts are possible with the TradingView Alertsystem.
More examples of another markets:
HOT TO GET ACCESS: looking on below signature.
Kind regards
NXT2017
