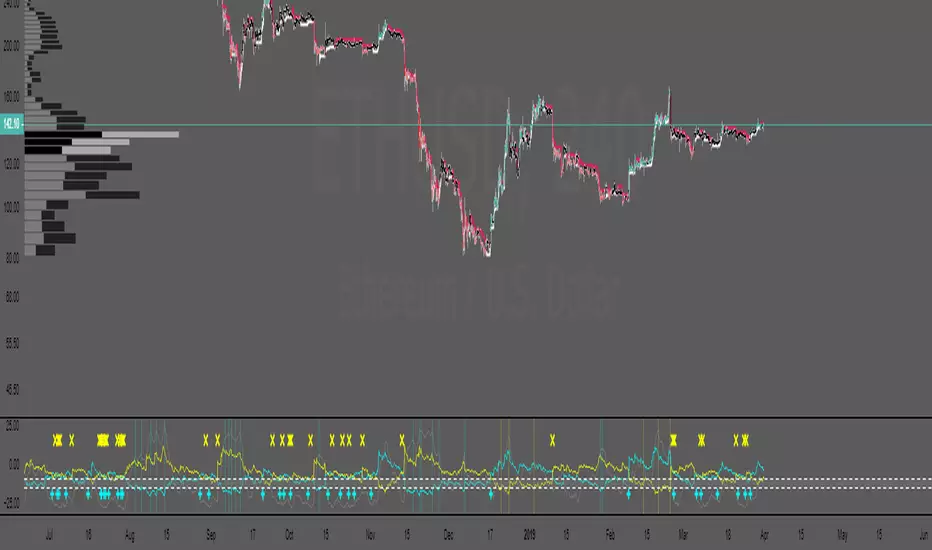
BTC LONGS VS SHORTS (With Demand of USDT)General idea is like this:
Go long when RULE 1 and RULE 2 are true:
RULE 1 - when USDT is in high demand (background is green)
RULE 2 - when Longs/Shorts is just recovered from Lower Bollinger Band
go short when the opposite is true.
you should also be careful and be prepared for a rise / fall when is below / above the purple dotted lines
you may want to ignore RULE1 since Bitmex doesn't use USDT to trade
This seems to work for the recent bear market while prices is driven largely by BTC margin or futures trading.
The rationale is that when a lot of people go short, the whales or the exchanges (who are of course unethical) will try to do the opposite to liquidate the accounts of retail traders.
Btc!
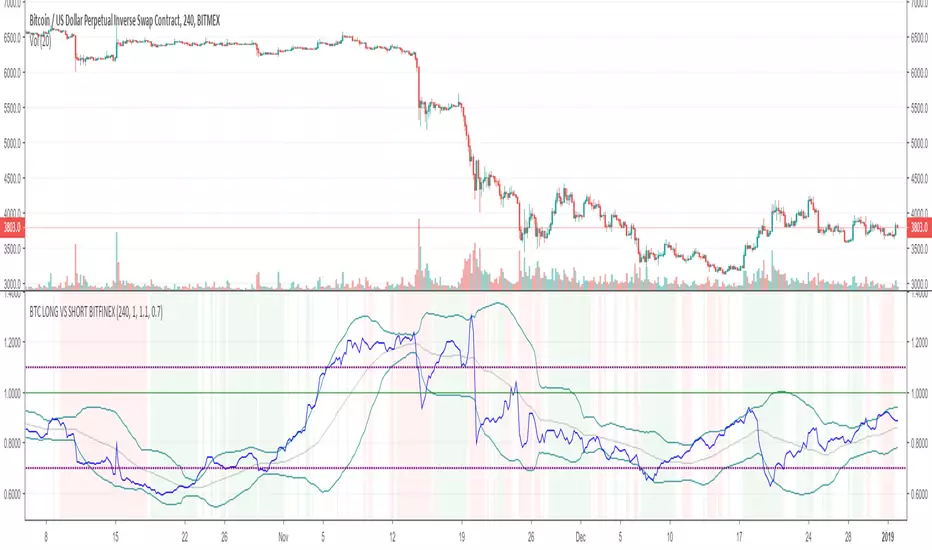
BTC LONGS VS SHORTS (With Demand of USDT)General idea is like this:
go long when RULE 1 and RULE 2 are true:
RULE 1 - when USDT is in high demand (background is green)
RULE 2 - when Longs/Shorts is just recovered from Lower Bollinger Band
go short when the opposite is true.
This seems to work for the recent bear market while prices is driven largely by BTC margin or futures trading.
The rationale is that when a lot of people go short, the whales or the exchanges (who are of course unethical) will try to do the opposite to liquidate the accounts of retail traders.

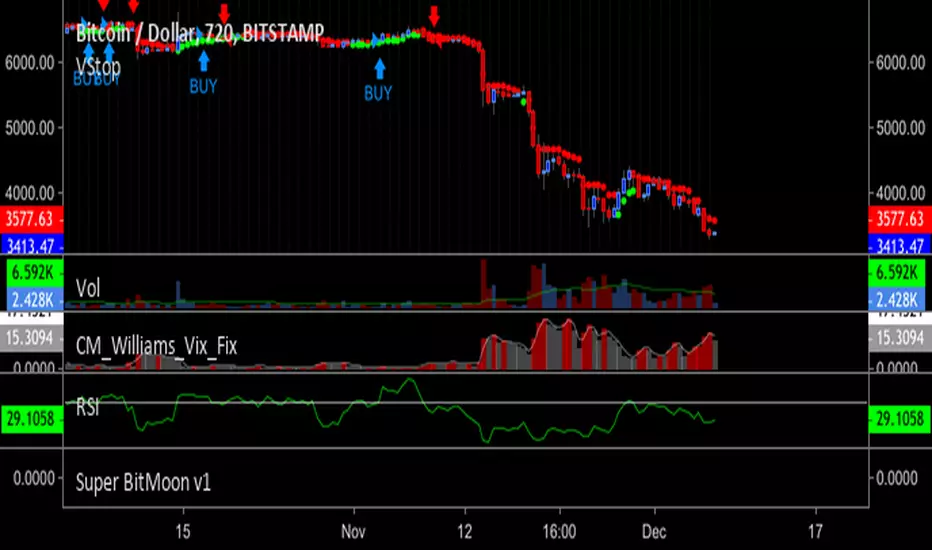
Real Volume BTCStudy based and adjusted in real Bitcoin volume. It shows important areas of great activity that will help you make better decisions.
This indicator also shows complete cycles of price action based on volume.
In combination with other indicators, it becomes a powerful tool.

SSABU TOTAL / BTC / ETH / USDT Dominance
✅ TOTAL / BTC / ETH / USDT Dominance (total market cap / beat / ethernet / share) indicator.
This indicator is a supplementary indicator for the market share of TOTAL Market Cap / BTC / ETH / USDT.
You can check the above occupation rate in real time through the check box of the input. By default, only the dominance of the bit is set to come out.
If you want to see a different share of the bit, check the check box in the input box.
The above screen shot shows only the dominance of the default setting bit.
✅ TOTAL / BTC / ETH / USDT Dominance (총 마캣캡 / 비트 / 이더 / 유에스디티 점유율) 지표입니다.
본 지표는 TOTAL Market Cap / BTC / ETH / USDT의 점유율을 확인 할 수 있는 보조지표 입니다.
인풋의 체크박스를 통하여 위의 점유율을 실시간으로 확인 할 수 있고 기본으로는 비트의 도미넌스만 나오도록 설정하였습니다.
비트 외의 다른 점유율을 보고 싶으시면 인풋에서 체크박스 체크해주시면 확인 가능합니다.
위의 스크린샷은 기본설정인 비트의 도미넌스만 적용한 모습입니다.
✅ 매매에 도움되는 다른 보조지표
Basel ver 2.21

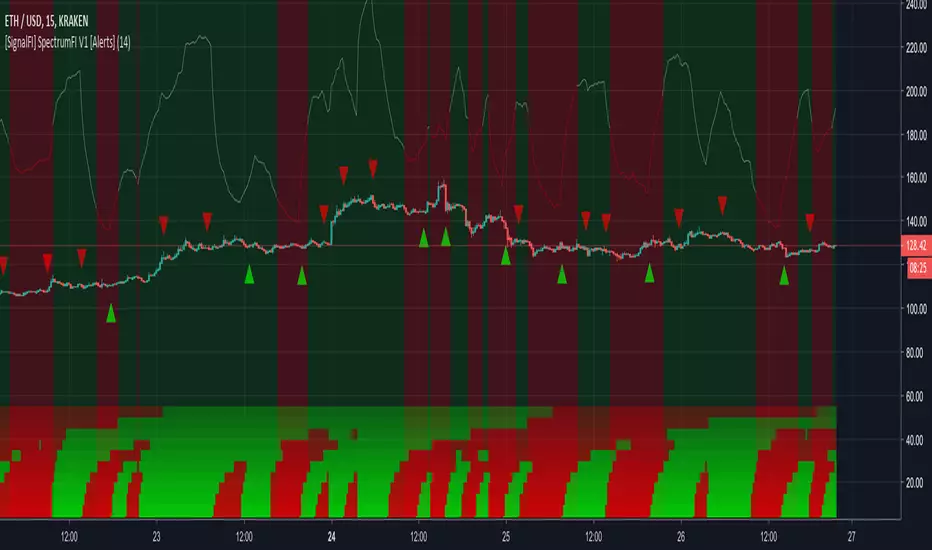
[SignalFI] SpectrumFI V1 [Alerts]SpectrumFI uses 11 independent Fibonacci based moving averages and their associated momentum to create a unified trend signal.
FIBONACCI BASED TREND DISCOVERY
DIFFERENCE STATISTICS COMBINED WITH RSI MOMENTUM
HEATMAP AND RSI INDICATORS BUILT INTO ONE TRADINGVIEW INDICATOR
ALERTS VERSION Only for Jedi and Master Subscribers
SignalFI was created to help traders and investors to effectively analyze the market based on the Golden Mean Ratio (Fibonacci numbers), plan a trade and ultimately execute it. To help inform and educate market decisions we developed a set of Trading Indicators which are available on TradingView , the most advanced and yet easy to use charting platform available on the web.
SignalFI indicators are just that, indicators. Our indicators are generally configured to use completely historical data (negating repaint), and we advise all alerts created with SignalFI indicators to be fired upon "close" of the current candle. Our indicators can provide valuable context and visualization support when performing market analysis and executing buy and sell decisions. However. we are not financial experts, and all information presented on this site or our other media outlets are for educational purposes only.
For subscription information, visit www.signalfi.net and follow us on twitter.
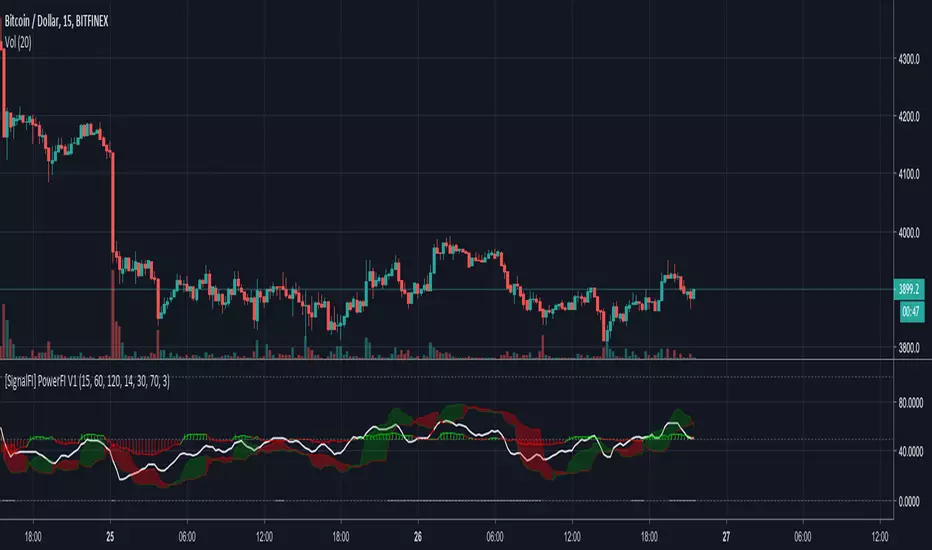
[SignalFI] PowerFI V1PowerFI is a multidimensional RSI that gives you insight into price momentum and trend crossovers via price statistics and rates of change.
MUTLTIPLE-TIMEFRAME RSI
DIFFERENCE STATISTICS COMBINED WITH RSI MOMENTUM
RSI IMPULSE STRENGTH HISTOGRAM
SignalFI was created to help traders and investors to effectively analyze the market based on the Golden Mean Ratio (Fibonacci numbers), plan a trade and ultimately execute it. To help inform and educate market decisions we developed a set of Trading Indicators which are available on TradingView , the most advanced and yet easy to use charting platform available on the web.
SignalFI indicators are just that, indicators. Our indicators are generally configured to use completely historical data (negating repaint), and we advise all alerts created with SignalFI indicators to be fired upon "close" of the current candle. Our indicators can provide valuable context and visualization support when performing market analysis and executing buy and sell decisions. However. we are not financial experts, and all information presented on this site or our other media outlets are for educational purposes only.
For subscription information, visit www.signalfi.net and follow us on twitter.
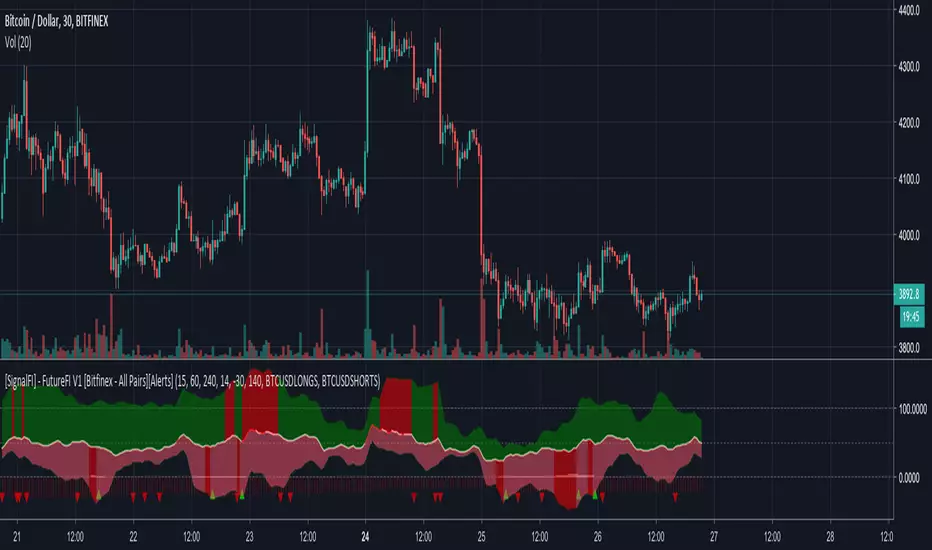
[SignalFI] - FutureFI V1 [Bitfinex - All Pairs][Alerts]FutureFI uses the futures (Long and Short) contracts housed on Bitfinex to provide a gauge for the relative difference and strength of interest in buying or selling Bitfinex assets based on total contracts created.
MUTLTIPLE-TIMEFRAME RSI FOR FUTURES CONTRACTS
DIFFERENCE STATISTICS COMBINED WITH RSI MOMENTUM
SIGNALS CAN BE APPLIED OUTSIDE OF BITFINEX
ALERTS VERSION Only for Jedi and Master Subscribers
Supported Assets:
LongAsset "BTCUSDLONGS","ETHUSDLONGS","XRPUSDLONGS","EOSUSDLONGS","LTCUSDLONGS","BTGUSDLONGS","ETPUSDLONGS","IOTUSDLONGS","ETCUSDLONGS","ZECUSDLONGS","NEOUSDLONGS","XMRUSDLONGS","ZRXUSDLONGS","OMGUSDLONGS","DSHUSDLONGS","BABUSDLONGS","BSVUSDLONGS","SANUSDLONGS","EDOUSDLONGS","TRXUSDLONGS","XLMUSDLONGS","BATUSDLONGS","VETUSDLONGS","SNGUSDLONGS"
ShortAsset "BTCUSDSHORTS","ETHUSDSHORTS","XRPUSDSHORTS","EOSUSDSHORTS","LTCUSDSHORTS","BTGUSDSHORTS","ETPUSDSHORTS","IOTUSDSHORTS","ETCUSDSHORTS","ZECUSDSHORTS","NEOUSDSHORTS","XMRUSDSHORTS","ZRXUSDSHORTS","OMGUSDSHORTS","DSHUSDSHORTS","BABUSDSHORTS","BSVUSDSHORTS","SANUSDSHORTS","EDOUSDSHORTS","TRXUSDSHORTS","XLMUSDSHORTS","BATUSDSHORTS","VETUSDSHORTS","SNGUSDSHORTS"
SignalFI was created to help traders and investors to effectively analyze the market based on the Golden Mean Ratio (Fibonacci numbers), plan a trade and ultimately execute it. To help inform and educate market decisions we developed a set of Trading Indicators which are available on TradingView , the most advanced and yet easy to use charting platform available on the web.
SignalFI indicators are just that, indicators. Our indicators are generally configured to use completely historical data (negating repaint), and we advise all alerts created with SignalFI indicators to be fired upon "close" of the current candle. Our indicators can provide valuable context and visualization support when performing market analysis and executing buy and sell decisions. However. we are not financial experts, and all information presented on this site or our other media outlets are for educational purposes only.
For subscription information, visit www.signalfi.net and follow us on twitter.
[SignalFI] - FutureFI V1 [Bitfinex - All Pairs]FutureFI uses the futures (Long and Short) contracts housed on Bitfinex to provide a gauge for the relative difference and strength of interest in buying or selling Bitfinex assets based on total contracts created.
MUTLTIPLE-TIMEFRAME RSI FOR FUTURES CONTRACTS
DIFFERENCE STATISTICS COMBINED WITH RSI MOMENTUM
SIGNALS CAN BE APPLIED OUTSIDE OF BITFINEX
Supported Assets:
LongAsset "BTCUSDLONGS","ETHUSDLONGS","XRPUSDLONGS","EOSUSDLONGS","LTCUSDLONGS","BTGUSDLONGS","ETPUSDLONGS","IOTUSDLONGS","ETCUSDLONGS","ZECUSDLONGS","NEOUSDLONGS","XMRUSDLONGS","ZRXUSDLONGS","OMGUSDLONGS","DSHUSDLONGS","BABUSDLONGS","BSVUSDLONGS","SANUSDLONGS","EDOUSDLONGS","TRXUSDLONGS","XLMUSDLONGS","BATUSDLONGS","VETUSDLONGS","SNGUSDLONGS"
ShortAsset "BTCUSDSHORTS","ETHUSDSHORTS","XRPUSDSHORTS","EOSUSDSHORTS","LTCUSDSHORTS","BTGUSDSHORTS","ETPUSDSHORTS","IOTUSDSHORTS","ETCUSDSHORTS","ZECUSDSHORTS","NEOUSDSHORTS","XMRUSDSHORTS","ZRXUSDSHORTS","OMGUSDSHORTS","DSHUSDSHORTS","BABUSDSHORTS","BSVUSDSHORTS","SANUSDSHORTS","EDOUSDSHORTS","TRXUSDSHORTS","XLMUSDSHORTS","BATUSDSHORTS","VETUSDSHORTS","SNGUSDSHORTS"
SignalFI was created to help traders and investors to effectively analyze the market based on the Golden Mean Ratio (Fibonacci numbers), plan a trade and ultimately execute it. To help inform and educate market decisions we developed a set of Trading Indicators which are available on TradingView , the most advanced and yet easy to use charting platform available on the web.
SignalFI indicators are just that, indicators. Our indicators are generally configured to use completely historical data (negating repaint), and we advise all alerts created with SignalFI indicators to be fired upon "close" of the current candle. Our indicators can provide valuable context and visualization support when performing market analysis and executing buy and sell decisions. However. we are not financial experts, and all information presented on this site or our other media outlets are for educational purposes only.
For subscription information, visit www.signalfi.net and follow us on twitter: @signalfi_

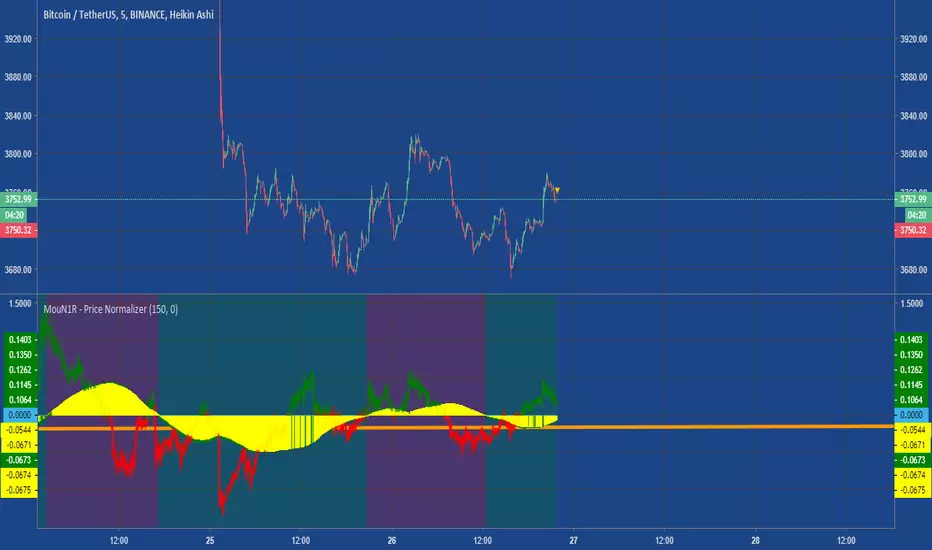
MouN1R - Price NormalizerMulti Exchanger Price simpler :)
We take premium and non premium price lift them :)
Then we calculate the slope and smooth it and done we got a degree of aim.
Be careful using this kind of TA (it need understanding of LRC)..
Have fun
MouN1R
MACD + Stochastic + RSI StrategyMy strategy uses a combination of three indicators MACD Stochastic RSI.
The Idea is to buy when (MACD > Signal and RSI > 50 and Stochastic > 50) occures at the same time
This strategy works well on stocks and cryptos especially during market breaking up after consolidation
The best results are on Daily charts, so its NOT a scalping strategy. But it can work also on 1H charts.
The strategy does not have any stops and profit targets, so we can take all the market can give us at the moment.
The exit point only when MACD goes under Signal
Its Preformance is quite stable.
So, use it, trade it.
If it will help you to imprive your trading results, please donate me
BTC: 12kd1F8buWisUBdq27BBwRkUvzW7Ey3og5


VMA Sig Cross 2H // Strategy based on Variable Moving Average. VMA automatically adjusts its smoothing constant on the basis of Market Volatility.
// Greatest profit index on 2H time frame
// Created and based on Binance chart
// Working with comission
// No repaint
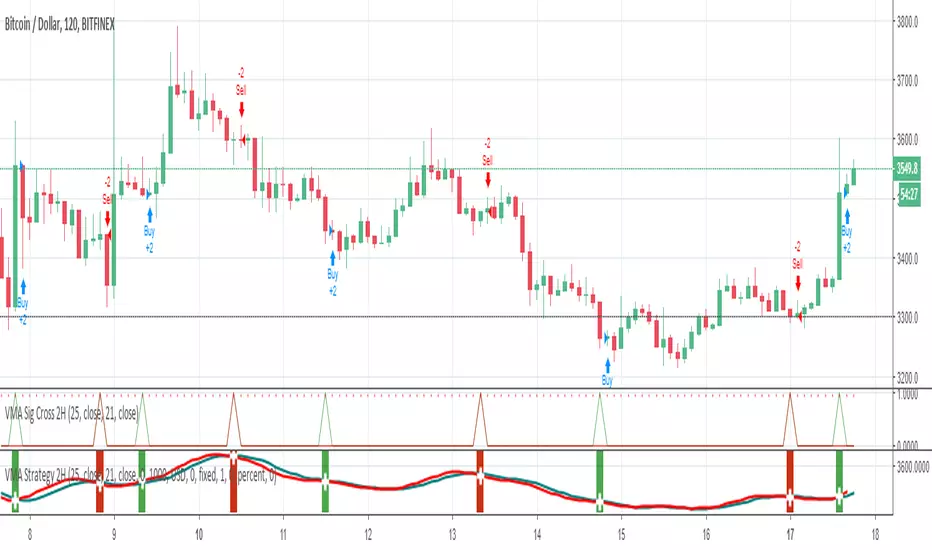
VMA Strategy 2H// Strategy based on Variable Moving Average. VMA automatically adjusts its smoothing constant on the basis of Market Volatility.
// Greatest profit index on 2H time frame
// Created and based on Binance chart
// Working with comission
// No repaint

EMA SMA ALERTS V1 2H// Strategy based on Simple Moving Average (SMA) and Exponential Moving Average (EMA)
// Greatest profit index on 2H time frame
// Created and based on Binance chart
// Working with comission
// No repaint
// Alerts +

EMA SMA STRATEGY V1 2H// Strategy based on Simple Moving Average (SMA) and Exponential Moving Average (EMA)
// Greatest profit index on 2H time frame
// Created and based on Binance chart
// Working with comission
// No repaint

Trend is your friendThis indicator evaluates the trend based on crosses of two McGinley moving averages. It paints candles accordingly (it does not repaint), so you can see what the indicator is saying more clearly and stay in your trade until you see a period of consolidation or a reversal. You can control how far away those moving averages need to be for you to consider it a trend. If this distance is not met candles color is not changed and it shows you that the market is in a period of consolidation. I also added visualization of RSI, so you can have an easier time finding appropriate profit targets. For stop loss I would recommend placing it a couple points above or below the previous high / low that is located above / below you final target for entry. You can also use a certain percentage that works for you. I tried adding a stop loss based on ATR, but I did not like the results. Using market structure is a better choice in my opinion.
Here is a basic trading strategy for the default settings:
Wait for the indicator to start printing a series of green or red candles. After that you can enter a long or a short around moving averages. Another valid place to entry is the specific RSI zone. If we are in an uptrend buying when RSI is oversold can be beneficial as you expect market to recover. I do not recommend changing RSI from 14. Vice versa for the downtrend. It gives you an edge as you know at what price RSI will be oversold and allows you to place trades in advance. Pretty neat! You need to realize that no indicator or strategy can give you an exact entry. There will always be some margin of error. What I wanted to say is that if there is a strong trend up and you buy around your key moving averages and when RSI is oversold you entered in good places and there is a pretty good chance you will make money.
Time frame settings:
If you want to use tighter stop losses I would recommend sticking to 15m. Do not go lower. It is not worth the stress. 1h and 4h seems to be very good as well, but expect your stop losses to be wider. What I personally tend to do is display 15m, 30m and 1h and compare it. Think of it as a short, mid and long term. That way you can see things little bit better.
Examples:
1H chart BTC
4h chart EUR / USD
1D chart NASDAQ
15m chart BTC (Daytrading)
That last chart shows that even if you were longing while the trend was about to change you still had a good chance to close it with a little profit and switch to short easily. The default settings is what has worked the best for me. Feel free to change them as you see fit and do not forget to let me know if you find something that works better :)
Notes:
Either disable wick display or change it to a neutral color like gray for both green and red candles. Unfortunately pine script does not allow wick painting, so if you have red / green wicks it will look terrible. If RSI visualization makes your candles look too small you can go to settings and disable the display of individual RSI levels. You will still be able to see the zones, but the scale won't be affected.

Total Volume for BTC or ETHBITMEX:ETHUSD BITSTAMP:BTCUSD Script includes cumulative Bitcoin volume from exchanges such as Binance, Bitfinex, Bithumb, Coinbase and more
As default, volume is shown based on the number of Bitcoin moved
If volume increases day over day the color will be blue, if it dereases the color will be red. This is not related to price
You can currently switch between ETH or BTC by putting those abbreviations in on the settings inputs
You can also switch to a USD output
You can remove Bitmex data as this exchange is highly leveraged contracts, default includes Bitmex data
Some delays in loading as the indicator pulls data from multiple exchanges
Future updates may include availability of other coins or additional exchanges added

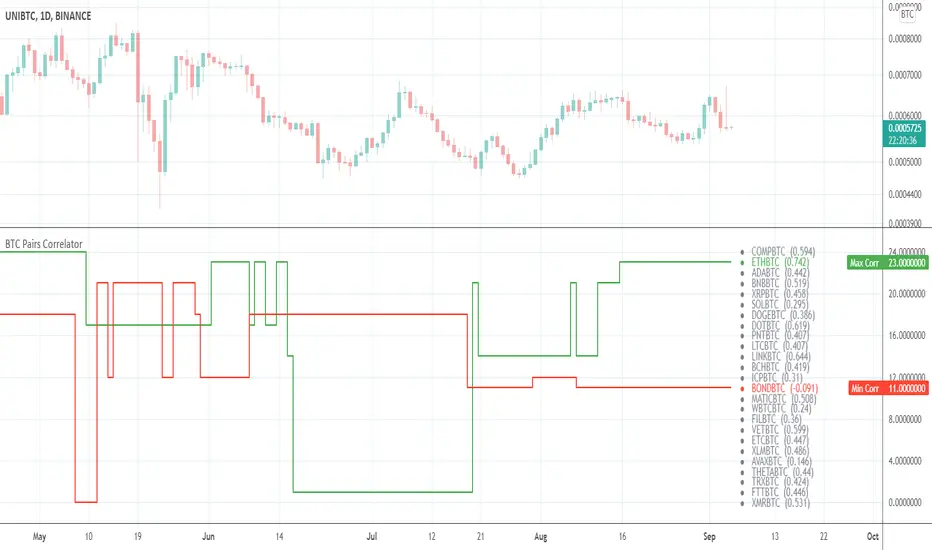
BTC Pairs CorrelatorHey there!
This tool helps to identify the best positive and negative correlated pairs from 38 */BTC cryptocurrency pairs.
By default it will find the best correlations for your current ticker.
If you are a newbie in Correlation Analysis you can find a brief explanation here .
Settings
Lookback for correlations (default: 14 )
Option to use or not to use current ticker (default: true )
You can switch to a custom ticker (default: BTCUSDT )
Choose as many pairs as you want from 38 available pairs.
Available pairs
ADABTC
BATBTC
BCDBTC
BCHBTC
BCNBTC
BNBBTC
BSVBTC
BTGBTC
DASHBTC
DCRBTC
DGBBTC
DOGEBTC
EOSBTC
ETCBTC
ETHBTC
LSKBTC
LTCBTC
IOTABTC
MKRBTC
NANOBTC
NEOBTC
OMGBTC
ONTBTC
PAXBTC
QTMBTC
TRXBTC
TUSDBTC
USDCBTC
VETBTC
WAVESBTC
XEMBTC
XLMBTC
XMRBTC
XRPBTC
XTZBTC
ZECBTC
ZILBTC
ZRXBTC
Good luck!
Bitfinex Longs/Shorts - Real numbersHere you go: real numbers of longs and shorts for most coins on Bitfinex. You can turn off the color between plots.

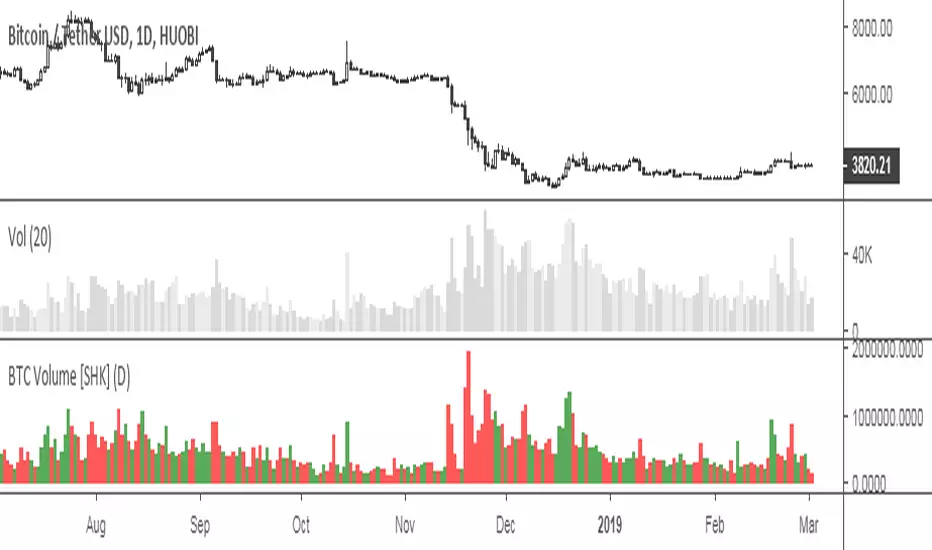
BTC Exchanges Volume [SHK]Useful script to calculate sum of BTC ( Bitcoin ) volumes on different exchanges.
Supported Exchanges:
Coinbase
Bitfinex
Bitmex
Houbi
CEX
Bitstamp
Binance
BitFlyer
Poloniex
Bittrex
Flyer
OkEx
Poloniex
Gemini
HitBTC
ZR1DMI/ADX
blue is Bull momentum
yellow is Bear momentum
gray line is trending line
dotted is TREND LINE
idea:
look for two lines to be above the dotted TREND LINE
bullish = Bull momentum + Trending Line
bearish = Bear Momentum + Trending Line
when all three are converged or when Tending Line is below dotted its CHOP
Blue flashes when BULL momentum is growing
Yellow flashes when BEAR momentum is growing
NOTE: FOR PA TO MOVE WE DONT ALWAYS NEED 2 LINES ABOVE 1 BELOW
a secondary trade idea is simply on cross over .
when Trending line + one of the momentum lines crosses over the 3rd line (secondary momentum) this can also be seem as trend confirmation.
with that said the strongest and safest set ups are still when 2 is above the TRENDING LINE and 1 below