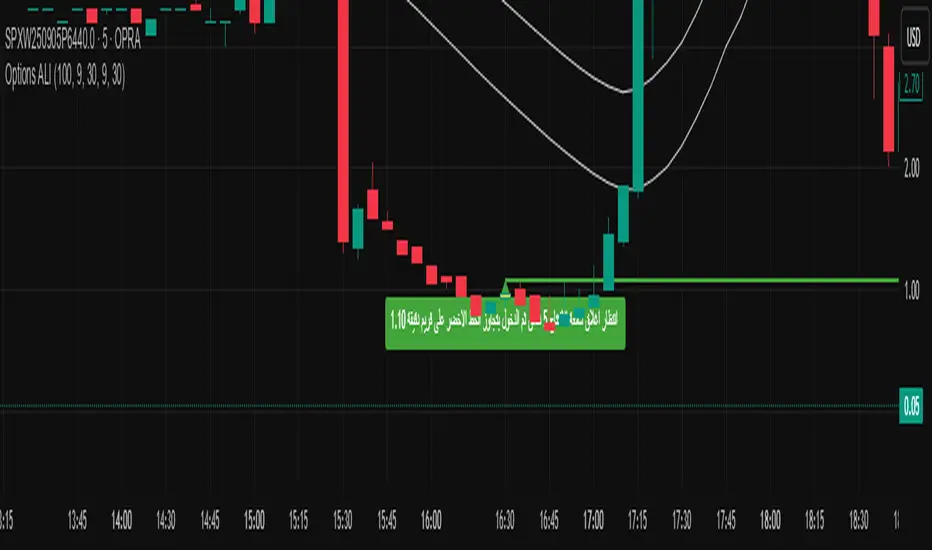
tenth-OptionsThis Pine Script indicator "tenth-Options" automatically detects the 9:30 AM opening candle, draws a green line at its high with a buy label, adds a sell/stop-loss label at its low, and plots a white Kijun-Sen line (default period 30) for trend reference on intraday timeframes under one hour.
Genişlik Göstergeleri
VN30 Effort-vs-Result Multi-Scanner — LinhVN30 Effort-vs-Result Multi-Scanner (Pine v5)
Cross-section scanner for Vietnam’s VN30 stocks that surfaces Effort vs Result footprints and related accumulation/distribution and volatility tells. It renders a ranked table (Top-N) with per-ticker signals and key metrics.
What it does
Scans up to 30 tickers (editable input.symbol slots) using one security() call per symbol → stays under Pine’s 40-call limit and runs reliably on any chart.
Scores each ticker by counting active signals, then ranks and lists the top names.
Optional metrics columns: zVol(60), zTR(60), ATR(20), HL/ATR(20).
Signals (toggleable)
Price/Volume – Effort vs Result
EVR Squeeze (stealth): z(Vol,60) > 4 & z(TR,60) < −0.5
5σ Vol, ≤1σ Ret: z(Vol,60) > 5 & |z(Return,60)| < 1
Wide Effort, Opposite Result: z(Vol,60) > 3 & close < open & z(CLV×Vol,60) > 1
Spread Compression, Heavy Tape: (H−L)/ATR(20) < 0.6 & z(Vol,60) > 3
No-Supply / No-Demand: close < close & range < 0.6×ATR(20) & vol < 0.5×SMA(20)
Momentum & Volatility
Vol-of-Vol Kink: z(ATR20,200) rising & z(ATR5,60) falling
BB Squeeze → Expansion: BBWidth(20) in low regime (z<−1.3) then close > upper band & z(Vol,60) > 2
RSI Non-Confirmation: Price LL/HH with RSI HL/LH & z(Vol,60) > 1
Accumulation/Distribution
OBV Divergence w/ Flat Price: OBV slope > 0 & |z(ret20,260)| < 0.3
Accumulation Days Cluster: ≥3/5 bars: up close, higher vol, close near high
Effort-Result Inversion (Down): big vol on down day then next day close > prior high
How to use
Set the timeframe (works best on 1D for EOD scans).
Edit the 30 symbol slots to your VN30 constituents.
Choose Top N, toggle Show metrics/Only matches and enable/disable scenarios.
Read the table: Rank, Ticker, (metrics), Score, and comma-separated Signals fired.
Method notes
Z-scores use a population-std estimate; CLV×Vol is used for effort/location.
Rolling counts avoid ta.sum; OBV is computed manually; all logic is Pine v5-safe.
Intraday-only ideas (true VWAP magnets, auction volume, flows, futures/options) are not included—Pine can’t cross-scan those datasets.
Disclaimer: Educational tool, not financial advice. Always confirm signals on the chart and with your process.

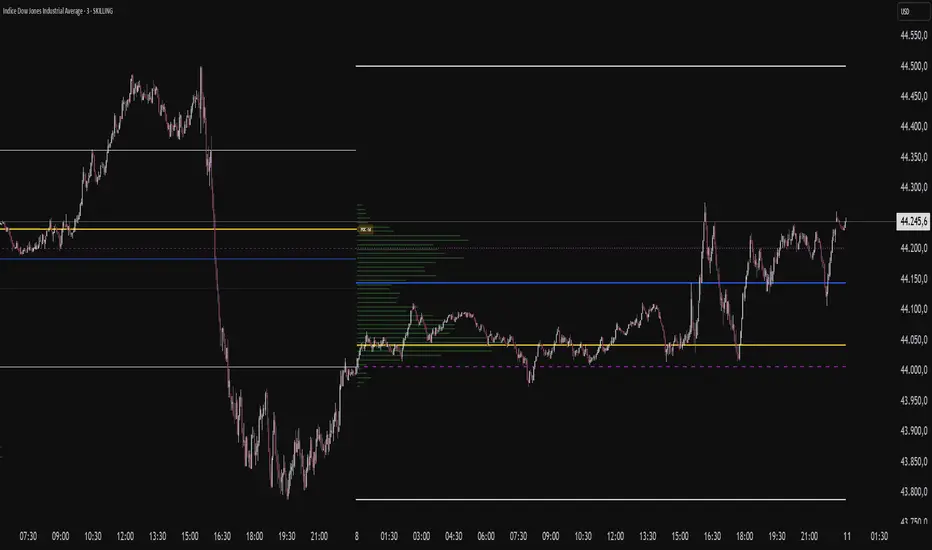
VP-Period with Previous Day Levels & Historical POC# Volume Profile with Previous Day Levels & Historical POCs
## Description
Comprehensive indicator combining Volume Profile analysis, previous day levels, and historical POC (Point of Control) levels for advanced technical analysis.
## Key Features
### Volume Profile
- **Customizable period**: 3 to 500 days
- **Calculation resolution**: 400 to 700 points
- **Current VPOC**: Point of Control line for current period
- **Volume bars**: graphical display of volume profile distribution
### Historical POCs
- **POC history**: up to 20 previous days
- **Time labels**: shows how many days ago for each POC
- **Dashed lines**: easy identification of historical levels
### Previous Day Levels (last 5 days)
- **High/Low**: daily highs and lows
- **Midpoint**: 50% level (High+Low)/2
- **Open/Close**: opening and closing prices
- **Progressive thickness**: day 1 thicker, decreasing for previous days
## Customization
- Fully configurable colors for each element
- Toggle on/off switches for every component
- Different line styles (solid, dashed, dotted)
## Usage
Perfect for traders using volume analysis and support/resistance based on previous daily levels. Ideal for identifying key zones and significant breakout points.
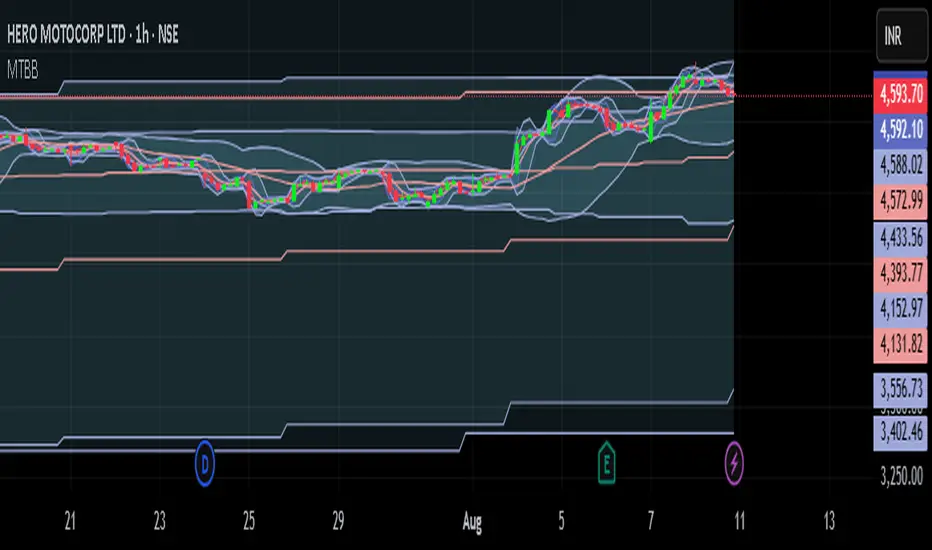
Multi Timeframe 7 Bollinger Bands by CSPMulti Timeframe 7 Bollinger Bands by CSP IT SHOW 1MT,5MT,10MT,1HR,D, W,M BOLLINGER BAND IN ASINGLE CHART.
Whaley Thrust — ADT / UDT / SPT (2010) + EDT (EMA) + Info BoxDescription
Implements Wayne Whaley’s 2010 Dow Award breadth-thrust framework on daily data, with a practical extension:
• ADT (Advances Thrust) — 5-day ratio of advances to (adv+dec). Triggers: > 73.66% (thrust), < 19.05% (capitulation).
• UDT (Up-Volume Thrust) — 5-day ratio of up-volume to (up+down). Triggers: > 77.88%, < 16.41%. Defaults to USI:UVOL / USI:DVOL (edit if your feed differs).
• SPT (Price Thrust) — 5-day % change of a benchmark (default SPY, toggle to use chart symbol). Triggers: > +10.05%, < −13.85%.
• EDT (EMA extension) — Declines-share thrust derived from WBT logic (not in Whaley’s paper): EMA/SMA of Declines / (Adv+Decl). Triggers: > 0.8095 (declines thrust), < 0.2634 (declines abating).
• All-Clear — Prints when ADT+ and UDT+ occur within N days (default 10); marks the second event and shades brighter green.
Visuals & Controls
• Shape markers for each event; toggle text labels on/off.
• Optional background shading (green for thrusts, red for capitulations; brighter green for All-Clear).
• Compact info box showing live ADT / UDT / SPT (white by default; turns green/red at thresholds).
• Min-spacing filter to prevent duplicate prints.
Tips
• Use on Daily charts (paper uses 5 trading days). Weekly views can miss mid-week crosses.
• If UDT shows 100%, verify your Down Volume symbol; the script requires both UVOL and DVOL to be > 0.
• Best use: treat capitulations (−) as setup context; act on thrusts (+)—especially when ADT+ & UDT+ cluster (All-Clear).
Credit
Core method from Wayne Whaley (2010), Planes, Trains and Automobiles (Dow Award). EDT is an added, complementary interpretation using WBT-style smoothing.

Chiefs sessions 4.1This indicator marks out the most recent asian session and London sessions highs and lows. It also marks off the previous days candles highs and lows in white. Asian session is blue and London is red. This indicator resets every day.
Relative Strength Buy/Sell SignalsThis Pine Script builds on the MarketSurge-style Relative Strength indicator. It calculates the RS line by comparing the stock's close to a benchmark (default: SPY). Buy signals are generated when the RS line crosses above its moving average (default 10-period SMA), indicating improving relative strength. Sell signals occur when it crosses below, suggesting weakening relative strength. Signals are labeled "BUY" (green) and "SELL" (red) on the chart, with background highlights.
It also retains the new 52-week RS highs (orange circles) and lows (purple circles), which can serve as additional confirmation for outperformance or underperformance.
Note: This approximates relative strength for trading signals but does not replicate the proprietary IBD RS Rating (a 1-99 percentile rank across all stocks). For best results, use on daily charts and combine with other analysis. Backtest thoroughly, as no strategy guarantees profits

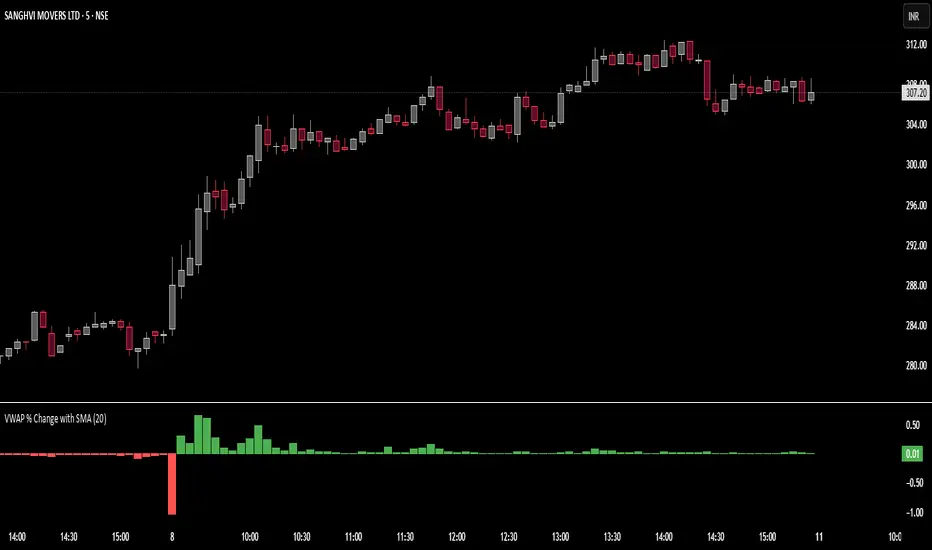
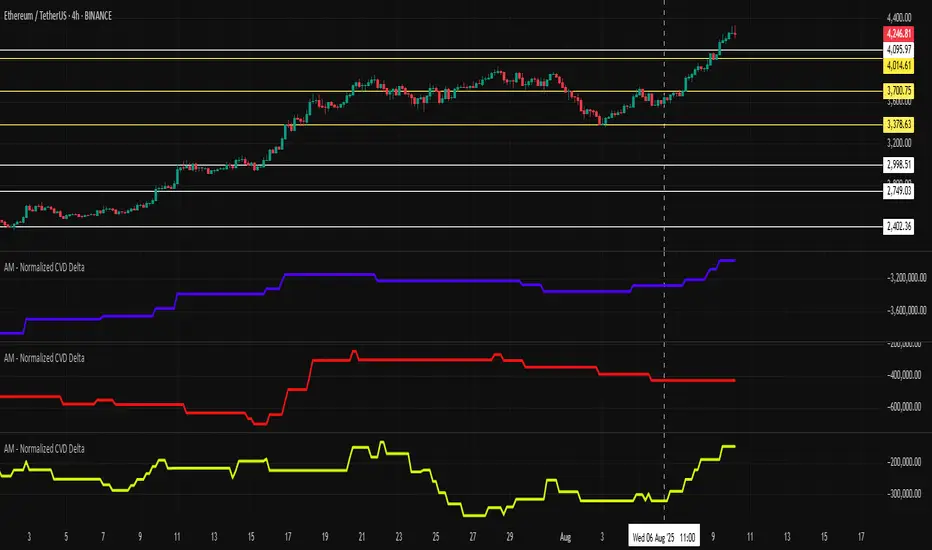
AM - Normalized CVD DeltaHow to Use Normalized CVD
Concept:
CVD = the cumulative sum of (buy volume – sell volume) over time.
“Normalized” = CVD scaled into a percentage for easier comparison between order size groups.
Benefits:
Shows order flow by size groups (whales, retail, etc.).
Makes it easy to see which group is buying or selling more aggressively.
Enables comparison across different time periods and groups.
How to Use:
Watch each line for different order size groups → near 100% = strong buying, near 0% = strong selling.
Compare with the Order Book heatmap to confirm support/resistance zones.

ICT/SMC Liquidity Map V3 KyroowThe indicator is designed to map liquidity on the chart following the ICT/SMC logic, with the added feature of precise tracking of the Asian session.
It shows you:
PDH / PDL → Previous Day High & Low, automatically removed once taken out.
EQH / EQL → Equal Highs & Equal Lows (double tops/bottoms), with pip tolerance and a check to ensure no candle has already "cleared" the range.
ASH / ASL → Asian Session High & Low (the highs/lows of each closed Asian session).
Asian Session → Displayed as a box or shaded area, with visual history.
Dynamic tolerance management → EQH/EQL can have different tolerances depending on the timeframe.
Automatic removal → Levels are removed once the market takes them (via wick or body, configurable).
💡 In practice:
It helps you quickly identify likely liquidity grab zones, whether they come from the previous day, the Asian session, or equal highs/lows. This allows you to anticipate market reactions around these levels.

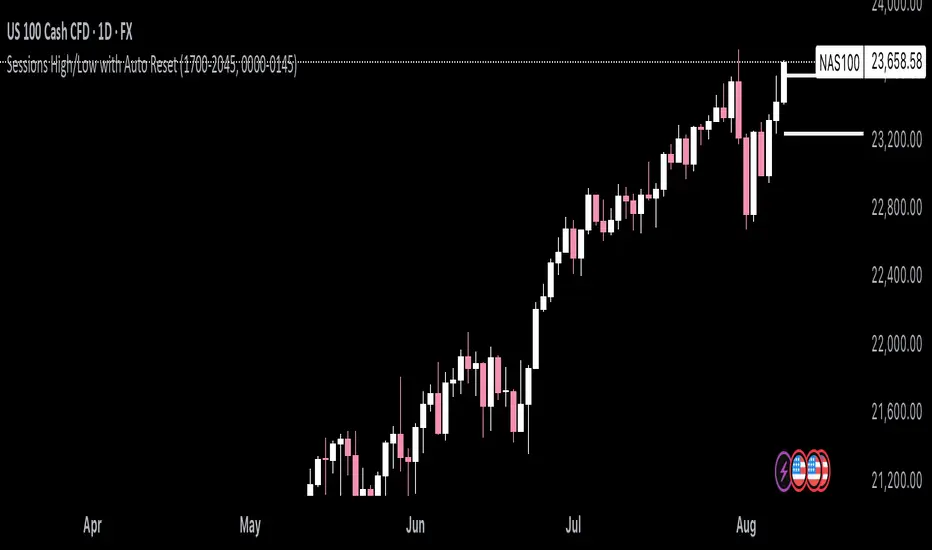
Day Range EU/Rome 00:00-22:30 Final Version# Day Range EU/Rome 00:00–22:30 — live + historical (colors)
**What it does**
Draws, for each day (timezone **Europe/Rome**), a rectangle that contains the **high** and **low** recorded between **00:00** and **22:30**.
* During the day it creates a **live box** that updates bar by bar (it extends to the latest candle).
* At the end of the session (after 22:30) it saves a **fixed historical box** for that day.
* The rectangle is **split horizontally**: half **top** and half **bottom** (customizable colors).
* Boxes are **anchored in time** (*xloc = bar\_time*): they don’t “slide” when you zoom or pan the chart.
* Works on **intraday** timeframes (recommended **15m**; also fine on 5m, 30m, 1h).
* Includes **all days**, **Friday included**.
---
## How it works
* The code detects the **00:00 → 22:30 (Europe/Rome)** session with `time("0000-2230","Europe/Rome")`.
* Within that window it continuously updates the day’s **High/Low**.
* When the **session closes** it creates two historical boxes (upper and lower halves) using the **H/L** of the day that just ended.
* The current day’s box remains **live** and follows the chart until 22:30.

Day Range EU/Rome 00:00-22:30 - live + storico (colori)# Day Range EU/Rome 00:00–22:30 — live + historical (colors)
**What it does**
Draws, for each day (timezone **Europe/Rome**), a rectangle that contains the **high** and **low** recorded between **00:00** and **22:30**.
* During the day it creates a **live box** that updates bar by bar (it extends to the latest candle).
* At the end of the session (after 22:30) it saves a **fixed historical box** for that day.
* The rectangle is **split horizontally**: half **top** and half **bottom** (customizable colors).
* Boxes are **anchored in time** (*xloc = bar\_time*): they don’t “slide” when you zoom or pan the chart.
* Works on **intraday** timeframes (recommended **15m**; also fine on 5m, 30m, 1h).
* Includes **all days**, **Friday included**.
---
## How it works
* The code detects the **00:00 → 22:30 (Europe/Rome)** session with `time("0000-2230","Europe/Rome")`.
* Within that window it continuously updates the day’s **High/Low**.
* When the **session closes** it creates two historical boxes (upper and lower halves) using the **H/L** of the day that just ended.
* The current day’s box remains **live** and follows the chart until 22:30.

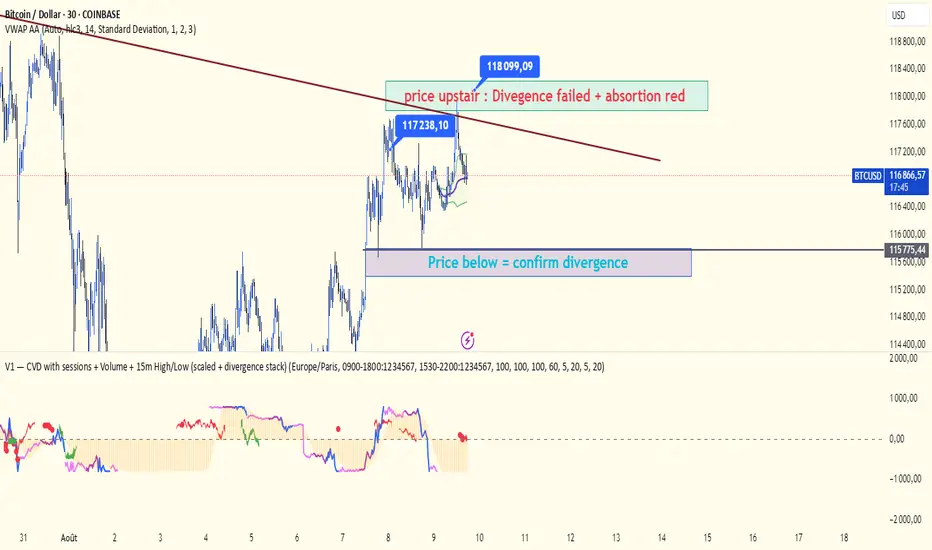
V1 — CVD with sessions scaled + divergence stackCVD with session: the three different session colors (fuchsia, purple, and blue).
There are two areas — green and red — which represent divergences with the price.
Be careful: both divergence and confirmation require a valid structure change.
The bubble is a visual aid to help validate or reject the divergence.
A bubble is calculated based on the previous session. You can adjust the volatility using lookbackCloseLL and lookbackHighBR.
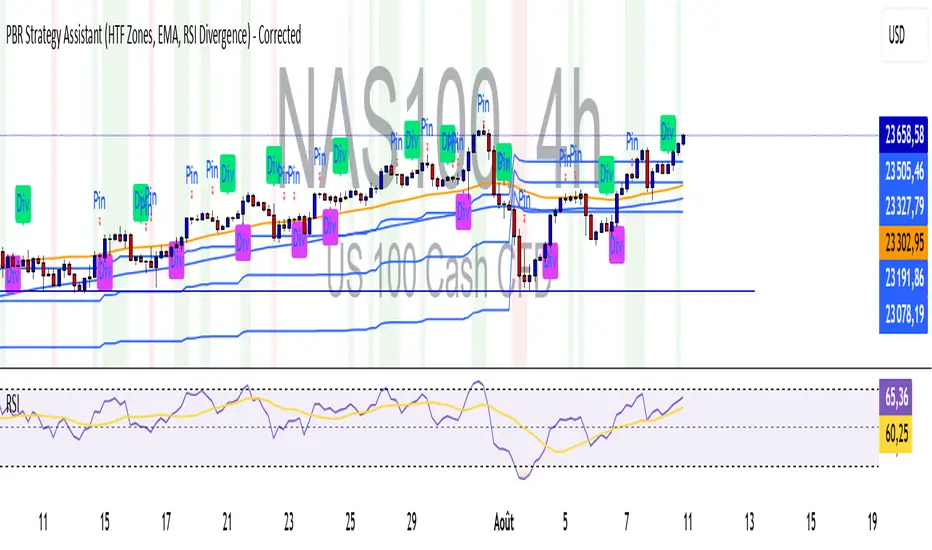
PBR Strategy Assistant Gold.D FingerGold.D Finger Strategy. This indicator gives an overview of my first strategies with several confluences. I just wanted to test what it would look like in this format, but it does not exactly match the one I actually use.
_mr_beach Sunday Entwicklung Version 1_mr_beach Sunday Development Version 1
Short Description (for TradingView publication):
This indicator combines EMA crossovers, VWAP with standard deviation bands, gap detection, pivot-based support & resistance, and VWAP distance labels in a single overlay. Perfect for discretionary traders aiming to efficiently identify gap fills, trend reversals, and key price levels. All components can be toggled on/off via the settings menu.
Full Indicator Description:
🧠 Purpose of the Indicator:
This all-in-one tool merges several analytical features to visualize trend direction, market structure, key price levels (e.g., gaps, VWAP distance, pivot support), and entry signals at a glance.
🔧 Integrated Features:
EMA20 / EMA50: Trend detection via moving averages. Crossover signals indicate potential entries.
VWAP + Band: Volume-weighted average price with visual deviation bands.
GAP-Up / GAP-Down: Price gaps are highlighted in color (brown/yellow), optionally showing only open ones.
VWAP Distance Label: Displays the current price’s percentage deviation from the VWAP as a chart label.
Buy/Sell Signals: Triggered by EMA20 and EMA50 crossovers.
HH/LL SL-Marker: Identifies local highs/lows using pivots.
Support & Resistance: Automatically calculated pivot zones.
Customizable Visibility: All features can be toggled in the settings menu.
Dummy Plot: plot(na) ensures error-free compilation.
⚙️ Settings Menu Options:
Show VWAP: Displays VWAP and deviation bands.
Show EMA20 / EMA50: Shows the moving averages.
Show Gaps: Enables gap detection.
Show Only Open Gaps: Hides already filled gaps.
Show VWAP Distance: Activates VWAP deviation label.
Support & Resistance: Displays pivot-based zones as support/resistance.
🔔 Alerts:
‘Mads Morningstar Signal’: Buy/Sell alerts based on EMA crossover.
📈 Use Cases:
Trend-following setups using EMA crossover
Gap-fill trading strategies
VWAP reversion trades
SL/TP based on HH/LL or pivot levels
Visual chart preparation for scalping, intraday, or swing trading
🛠 Suggested Extensions:
Gap table showing open levels
Take-Profit/Stop-Loss strategy
Alerts for new gap formation
Strategy tester module with gap-based entries