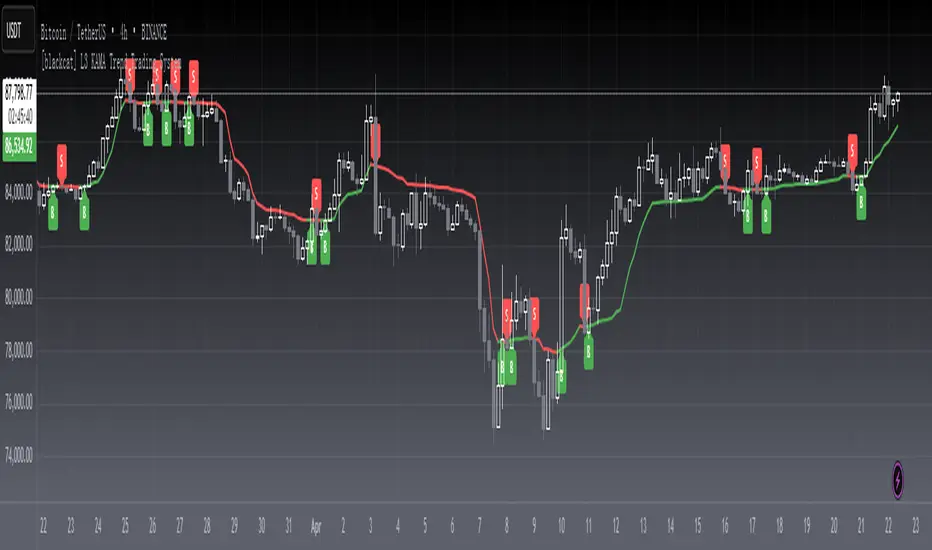
[blackcat] L3 KAMA Trend Trading SystemLevel: 3
Background
Kaufman’s Adaptive Moving Average ( KAMA ) was developed by American quantitative financial theorist Perry J. Kaufman in 1998.
Function
This is an improved KAMA trading system with my customized algorithm.You can use KAMA like any other trend-following indicator, such as a moving average. You can look for price crosses, directional changes and filtered signals. First, a cross above or below KAMA indicates directional changes in prices. As with any moving average, a simple crossover system will generate lots of signals and lots of whipsaws. Second, You can use the direction of KAMA to define the overall trend for a security. This may require a parameter adjustment to smooth the indicator further. You can change the fastline and slowline parameters to smooth KAMA and look for directional changes. The trend is down as long as KAMA is falling and forging lower lows. The trend is up as long as KAMA is rising and forging higher highs. Finally, You can combine signals and techniques. You can use a longer-term KAMA to define the bigger trend and a shorter-term KAMA for trading signals.
I have included in the indicator an input named "EnableSmooth" that allows you to determine if the KAMA line should be smoothed or not. A "True" as the input value smoothes the calculation. An "False" simply plots the raw KAMA line. When market volatility is low, Kaufman’s Adaptive Moving Average remains near the current market price, but when volatility increases, it will lag behind. What the KAMA indicator aims to do is filter out “market noise” – insignificant, temporary surges in price action. One of the primary weaknesses of traditional moving averages is that when used for trading signals, they tend to generate many false signals. The KAMA indicator seeks to lessen this tendency – generate fewer false signals – by not responding to short-term, insignificant price movements. Traders generally use the moving average indicator to identify market trends and reversals.
Remarks
Feedbacks are appreciated.
Blackcat1402
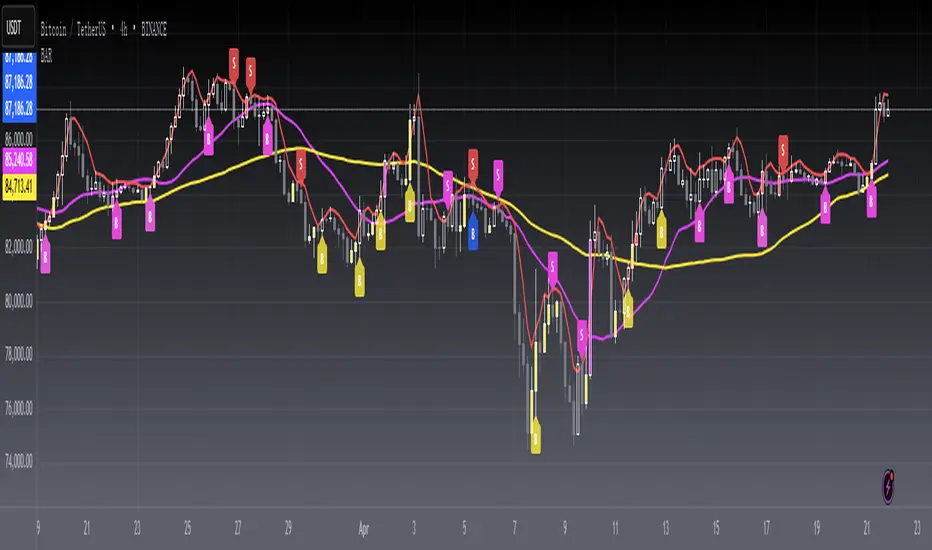
[blackcat] L1 Buy After RetracementLevel 1
Background
A summary of Buy After Retracement Entry Points.
Function
The "retraction to the moving average buying method", as the name suggests, is a buying reference for short-term adjustment and retracement to the key moving average after a single stock rises. For example, after the index has undergone a sharp correction, many strong stock varieties have retreated or are about to retreat to the key moving average position, and the buying point generated at this time is the "retraction to moving average buying method". Because candlesticks and moving averages have different styles, I summarize what I think of through this script.
Remarks
Feedbacks are appreciated.
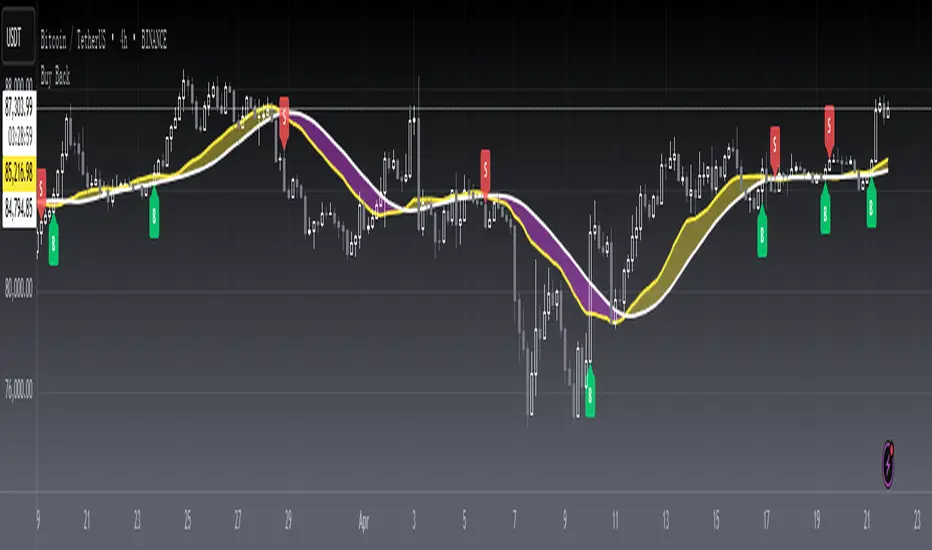
[blackcat] L1 Buy BackLevel 1
Background
This indicator models the situation before big money or whales lurking, buying chips, and about to pull up.
Function
When is the time to buy, even if you know that whales are accumulating, but how long it needs to be lurking, and when it will rise is unknown. This indicator has been conditionally modeled through statistical high probability events, and the main judgment is that it is the key to step back before rising The bit, once the signal appears, will be pulled up.
This includes: using a moving average of custom parameters (the parameters of this key moving average need to be found through backtesting for different markets and trading varieties) as the basis for the main characterization of large-capacity trading behavior. Then build a model through the volume-price relationship:
1. There is a feature that the lowest price is lower than the moving average after the downward pressure of large funds.
2. The closing price must effectively stand above the moving average.
3. The ratio of closing prices for two consecutive days is less than the moving average value.
4. The moving average is just above the heavy volume, and the volume ratio meets certain requirements, indicating that it is a feature of heavy volume. (Amplified volume is an important manifestation of banker fund action)
Remarks
Feedbacks are appreciated.
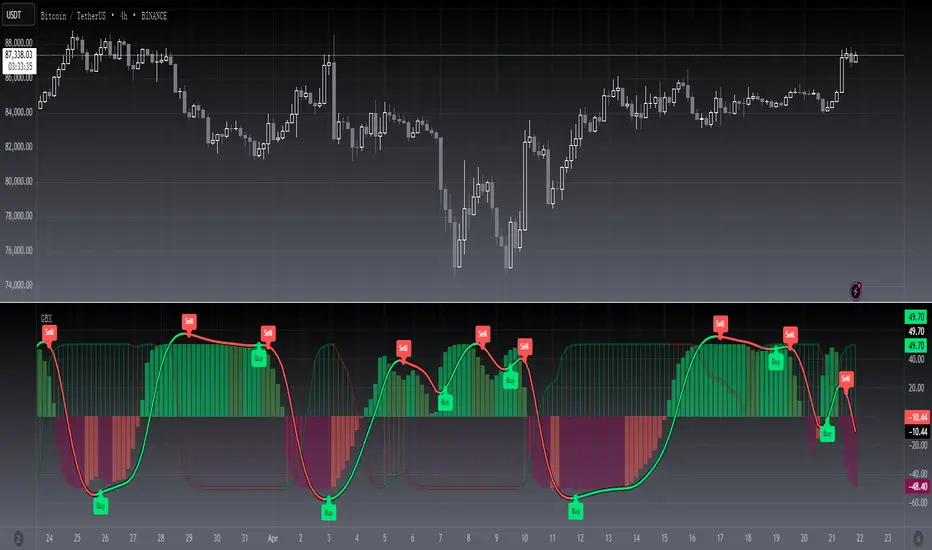
[blackcat] L3 Gann B-XtrenderLevel 3
Background
The Gann Slope indicator has been welcomed by the community since its release, and many people are trying to integrate it into their trading systems. One of these is the need to integrate Gann Slope into QuantTherapy's B-Xtrender @Puppytherapy.
Function
You can find QuantTherapy's script above , he recreated a trend following indicator published in IFTA Journal by Bharat Jhunjhunwala. It is mainly to be traded on big timeframes.
As requested, i replaced the oscillator part with my Gann slope oscillator. However, I found the setting for input parameters for B-Xtrender is rather complex, you need to take great care to tuning them for specific time frame and trading pairs. Pls don't be lazy to apply this indicator to your chart and expect good results. You have to try and find proper values of them to obtain acceptable results.
Remarks
Feedbacks are appreciated.
[blackcat] L3 Gann SlopeLevel 3
Background
William Gann (Wilian D. Gann) is one of the most famous investors in the twentieth century. His outstanding achievements in the stock and futures markets are unparalleled. The theory he created that perfectly combines time and price has been It is still talked about and highly praised by the investment community.
Function
The slope is the degree of the angle line relative to the time axis (X axis). Volatility is the ratio of unit amplitude to unit time. At the heart of Gann angles is the determination of volatility. Gann angle is the movement of price defined by time unit and price unit. Each angle is determined by the relationship between time and price. In the rising angle, the angle with the larger slope means that the stock price is rising stronger and falling. In a trend line, the larger the slope, the stronger the downtrend.
This technical indicator speaks of the Gann slope expressed as an oscillator. Its value varies from 0 to 100. The positive slope means rising, and the negative slope means falling. For rising and falling, the strength of rising and falling is distinguished by the thickness and color of the oscillating line:
1. The thin white line represents the basic oscillator curve and has no special meaning.
2. Light red indicates that an uptrend is established, and dark red indicates a very strong uptrend.
3. Light green indicates an established downtrend, dark green indicates a very strong downtrend.
Remarks
Feedbacks are appreciated.
[blackcat] L3 Stock VWAP Slope in DegreesLevel 3
Background
Smooth VWAP based on stock turnover and calculate the slope of the smoothed VWAP
Function
This is a technical indicator for stocks only. Because of the use of TradingView's financial functions, the scope of use is limited to stocks. It will give an error when you use it for other trading pairs. According to if the VWAP is smoothed according to the stock turnover rate, and the angle of the VWAP is calculated to judge the trend. The specific method of use is: the fast line crosses the slow line at a large angle, which can be regarded as a buy intervention point, and the fast line crosses the slow line in a small amount and then steps back on the slow line, which can also be regarded as a buy intervention point. The slow line is the 3-period moving average of the fast line.
Remarks
Feedbacks are appreciated.

[blackcat] L1 Slope OscillatorLevel 1
Background
This technical indicator can judge the upside potential of individual stocks based on the slope
Function
This technical indicator determines whether the trend continues or reverses by defining a fast slope and a slow slope. If it shows a golden cross to buy at a low level, a dead cross to sell. It can be combined with other types of fast technical indicators to determine the resonance of buying and selling points. The premise of buying stocks is that this indicator has a golden cross and the individual stocks are trending upwards.
Remarks
Feedbacks are appreciated.

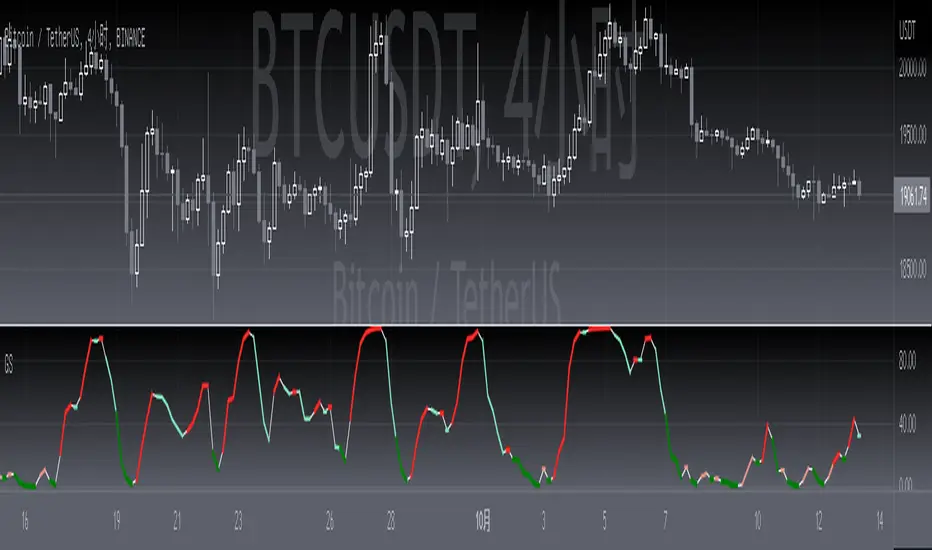
[blackcat] L3 Candle Skew 3821 TraderLevel 3
Background
By modeling skew to produce long and short entry points.
Function
The concept of skew comes from physics and statistics, and is used in market technical analysis to reflect the expectation of future stock price distribution. Because the return distribution of stocks in the trend market has skew (Skew), it is reasonable to judge the trend continuity according to the historical and current skew. It is precisely because the stock price rises that there is a skew. The greater the strength of the rise, the greater the angle of inclination and the greater the skew. The degree of this upward or downward slope in the statistical distribution of stock prices is defined as skew. Through the size of skew, we can know the direction, inertia and extent of the stock's rise or fall, and find stocks with a high probability of quick profit. The technical indicator introduced today is a simplified but effective stock price skew model used to generate buying and selling points.
The principle of this technical indicator is based on the success rate test results of different moving averages corresponding to different skews as follows:
10 trading cycles profit 5% success rate (%)
5 period moving average 10 period moving average 20 period moving average 30 period moving average 60 period moving average
skew>=0 51.36 52.26 52.65 52.55 52.08
skew>=0.5 55.44 58.06 60.56 62.37 65.66
skew>=1 59.72 63.06 67.07 69.78 70.62
skew>=1.5 63.01 67.08 71.61 72.9 70.61
skew>=2 65.53 70.22 74.18 73.76 70.12
skew>=2.5 67.89 72.93 75.32 73.66 68.92
skew>=3 70.07 75.32 75.69 72.54 67.45
skew>=3.5 71.85 77.05 75.32 73.63 63.82
skew>=4 73.6 78.06 74.19 68.96 59.91
skew>=4.5 76.04 78.56 72.85 69.55 49.24
skew>=5 77.44 78.88 71.58 67.28 51.69
skew>=5.5 78.97 78.39 70.33 64.31 49.7
skew>=6 79.68 78.07 68.82 61.65 53.57
Table 1
As can be seen from the above table, with the increase of the 5-period and 10-period moving average skew values, the success rate is increasing, but after the 20- and 30-period moving average skew values increase to an upper bound, it shows a downward trend. When the skew of the 20-period and 30-period moving averages is greater than 0.5, the 10-period profit of 5% is above 60%, and when it is greater than 1.5, the success rate can reach above 70%. The larger the 5-period moving average skew, the higher the success rate, but often because the short-term skew is too large, the stock price has risen rapidly to a high level, and chasing up is risky, which is not suitable for the investment habits of most people, so prudent investors may like to do swings. Investors may wish to pay more attention to the skew of the 20-period and 30-period moving averages. Based on the above analysis, as a short-term trading enthusiast, I need to choose the 5-period and 10-period moving average skew, and consider the medium-term trend as a compromise, and I also need to consider the 20-period moving average skew. Finally, according to the principle of personal preference, I chose 3 groups of periods based on Fibonacci magic numbers: 3 periods, 8 periods, 21 periods, and skews that take into account both short-term and mid-line trends. So, I named this indicator number 3821 as a distinction.
002084 1D from TradingView
BTCUSDT 1H from TradingView
Tesla 1D from TradingView
[blackcat] L3 Gradient Swings of Bull and BearLevel 3
Background
Some friends in the TradingView community say that my technical indicators are too complicated to write. Is there anything that is easy to use? This time I will publish a simple indicator to use.
Function
This indicator uses a custom stochastic indicator as its initial value. Calculate the difference between the short-term and long-term EMA moving averages twice. Find the geometric mean of the above values and calculate the variance value. According to this algorithm, two sets of variance values are calculated respectively, one is the fast line and the other is the slow line. Finally, the 22-period EMA of the fast and slow lines is used as the final output value. This output can effectively reflect the band characteristics of the price.
Because this output is relatively smooth, it can effectively filter out clutter noise, so you can clearly see the shape of the entire band. Go long during an uptrend and go short on the contrary. I use red and green gradients for longs and shorts respectively. The entry points are identified by red and green labels at the start of the band. In addition, the filtered peaks and troughs are also the basis for technical divergence judgments, so I added divergence identification lines.
The disadvantage of this indicator is that it is prone to many interference signals in the sideway stage. In order to filter out these signals and extract only useful trend signals, the user can enter a threshold in the settings dialog and select an appropriate display threshold in combination with the amplification factor. This way the part between 0 and the threshold will be grayed out. The gray area is the sideway, where the signal can be ignored.
Remarks
Feedbacks are appreciated.
[blackcat] L3 God Hunter ScalpingLevel 3
Background
An ultra-short scaler that I integrate with multiple custom function implementations. Because of its responsiveness it is suitable for small cycle applications.
Function
The first technical indicator to integrate is the stoch. By combining the stoch indicators of long and short periods, I can not only ensure its high-speed reaction speed, but also be compatible with stability.
The second is the improved KDJ indicator to further strengthen buying and selling conditions. Because the final trend output is relatively fast, I used a variety of long-short conditions to improve adaptability. and minimize noise. It is well known that price fluctuations in small cycles are more random.
The third feature is the classification of buying and selling points, not only through the reversal of the trend curve, but also several other buying and selling point conditions, oversold and overbought signals, signal divergence techniques, etc.
Finally, through the nested RSI, the momentum trend strength of the trend signal is represented by a gradient color to assist in judging whether the reversal point is approaching.
Remarks
For differnent instruments and time frames, overbought and oversold threshold should be adjusted accordingly, or it may not work well.
Feedbacks are appreciated.

[blackcat] L3 Swing Whale CatcherLevel 3
Background
Whale catcher is a resonance indicator combining both customized MACD and customized KDJ. It use two resonance bands to identify oppotunities of middle-short term.
Function
When we use MACD and KDJ alone, in the trend market, the prices are arranged in the order of the moving average, and the operation is simple and the profit space is large. The MACD and KDJ diverge from reality and can be a good catch of trend reversal tops and bottoms. The disadvantage of this system is also very serious. In the volatile market, the moving average fails, and the false divergence of MACD and KDJ has become a contrarian operation. Everyone should know the degree of danger of contrarian operations in a unilateral market.
Therefore, this indicator can confirm each other by improving the performance of the separate MACD and KDJ and combining the two in one main chart. When the two resonate, a more reliable signal can be prompted.
In order to adapt to different time periods, I designed a look-up table (LUT) that automatically assigns parameters according to the icon period. It can make this indicator more stable over different time periods.
The green and purple ribbons are the trend lines of the customized version of MACD, and the red and blue ribbons are the trend lines of the customized version of KDJ. In most cases, the two trends are different, but obviously KDJ is more sensitive than MACD and is suitable for judging entry and exit points. MACD is more likely to see large-scale trends. When the two are combined, the judgment can be strengthened. For example, use the logical AND operation to combine the two.
Finally, except for the two fast and slow line combinations of MACD and KDJ. I also plot the difference column of the two. Because the performance of the two sub-levels represented by the difference bar is more conducive to obtaining the information of the trend reversal in advance. The dark green above zero and the dark red below zero are the differential columns of KDJ. Four-color difference offline is the difference column of MACD. In this way, it is not easy to be confused by the graphic expression, I hope you like it.
Remarks
Feedbacks are appreciated.

[blackcat] L3 RMI Trading StrategyLevel 3
Background
My view of correct usage of RSI and the relationship between RMI and RSI. A proposed RMI indicator with features is introduced
Descriptions
The Relative Strength Index (RSI) is a technical indicator that many people use. Its focus indicates the strength or weakness of a stock. In the traditional usage of this point, when the RSI is above 50, it is strong, otherwise it is weak. Above 80 is overbought, below 20 is oversold. This is what the textbook says. However, if you follow the principles in this textbook and enter the actual trading, you would lose a lot and win a little! What is the reason for this? When the RSI is greater than 50, that is, a stock enters the strong zone. At this time, the emotions of market may just be brewing, and as a result, you run away and watch others win profit. On the contrary, when RSI<20, that is, a stock enters the weak zone, you buy it. At this time, the effect of losing money is spreading. You just took over the chips that were dumped by the whales. Later, you thought that you had bought at the bottom, but found that you were in half mountainside. According to this cycle, there is a high probability that a phenomenon will occur: if you sell, price will rise, and if you buy, price will fall, who have similar experiences should quickly recall whether their RSI is used in this way. Technical indicators are weapons. It can be either a tool of bull or a sharp blade of bear. Don't learn from dogma and give it away. Trading is a game of people. There is an old saying called “people’s hearts are unpredictable”. Do you really think that there is a tool that can detect the true intentions of people’s hearts 100% of the time?
For the above problems, I suggest that improvements can be made in two aspects (in other words, once the strategy is widely spread, it is only a matter of time before it fails. The market is an adaptive and complex system, as long as it can be fully utilized under the conditions that can be used, it is not easy to use. throw or evolve):
1. RSI usage is the opposite. When a stock has undergone a deep adjustment from a high level, and the RSI has fallen from a high of more than 80 to below 50, it has turned from strong to weak, and cannot be bought in the short term. But when the RSI first moved from a low to a high of 80, it just proved that the stock was in a strong zone. There are funds in the activity, put into the stock pool.
Just wait for RSI to intervene in time when it shrinks and pulls back (before it rises when the main force washes the market). It is emphasized here that the use of RSI should be combined with trading volume, rising volume, and falling volume are all healthy performances. A callback that does not break an important moving average is a confirmed buying point or a second step back on an important moving average is a more certain buying point.
2. The RSI is changed to a more stable and adjustable RMI (Relative Momentum Indicator), which is characterized by an additional momentum parameter, which can not only be very close to the RSI performance, but also adjust the momentum parameter m when the market environment changes to ensure more A good fit for a changing market.
The Relative Momentum Index (RMI) was developed by Roger Altman and described its principles in his article in the February 1993 issue of the journal Technical Analysis of Stocks and Commodities. He developed RMI based on the RSI principle. For example, RSI is calculated from the close to yesterday's close in a period of time compared to the ups and downs, while the RMI is compared from the close to the close of m days ago. Therefore, in principle, when m=1, RSI should be equal to RMI. But it is precisely because of the addition of this m parameter that the RMI result may be smoother than the RSI.
Not much more to say, the below picture: when m=1, RMI and RSI overlap, and the result is the same.
The Shanghai 50 Index is from TradingView (m=1)
The Shanghai 50 Index is from TradingView (m=3)
The Shanghai 50 Index is from TradingView (m=5)
For this indicator function, I also make a brief introduction:
1. 50 is the strength line (white), do not operate offline, pay attention online. 80 is the warning line (yellow), indicating that the stock has entered a strong area; 90 is the lightening line (orange), once it is greater than 90 and a sell K-line pattern appears, the position will be lightened; the 95 clearing line (red) means that selling is at a climax. This is seen from the daily and weekly cycles, and small cycles may not be suitable.
2. The purple band indicates that the momentum is sufficient to hold a position, and the green band indicates that the momentum is insufficient and the position is short.
3. Divide the RMI into 7, 14, and 21 cycles. When the golden fork appears in the two resonances, a golden fork will appear to prompt you to buy, and when the two periods of resonance have a dead fork, a purple fork will appear to prompt you to sell.
4. Add top-bottom divergence judgment algorithm. Top_Div red label indicates top divergence; Bot_Div green label indicates bottom divergence. These signals are only for auxiliary judgment and are not 100% accurate.
5. This indicator needs to be combined with VOL energy, K-line shape and moving average for comprehensive judgment. It is still in its infancy, and open source is published in the TradingView community. A more complete advanced version is also considered for subsequent release (because the K-line pattern recognition algorithm is still being perfected).
Remarks
Feedbacks are appreciated.

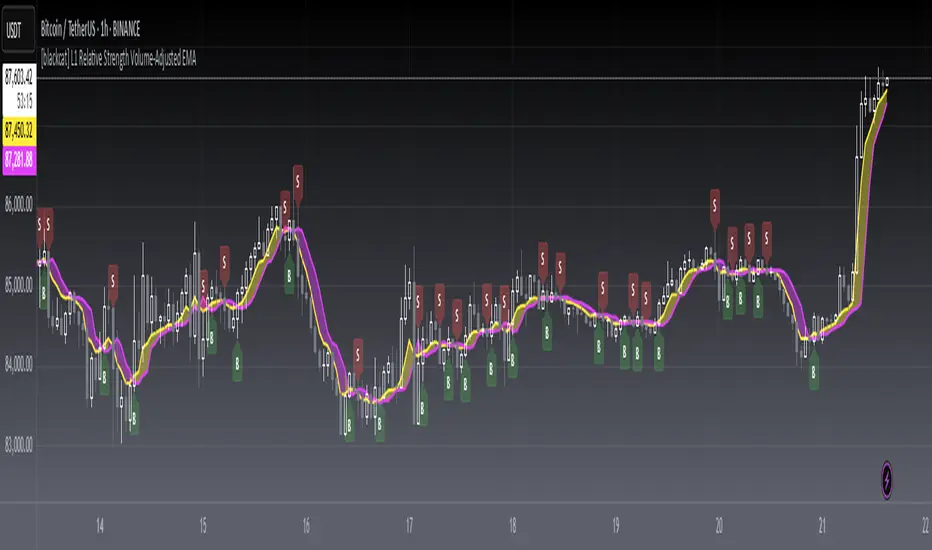
[blackcat] L1 Relative Strength Volume-Adjusted EMALevel 1
Background
Vitali Apirine proposed an idea of “Relative Strength Moving Averages, Part 2 (RS VA EMA)” on October 2022.
Function
Based on my understanding, Vitali combines the merits of RSI, volume and EMA to improve moving average performance. It takes the relative volume strength into account and includes a measurement between positive and negative volume flow in the calculation, which gives direction to the volume input. In details, volume is considered positive when the close is higher than the previous close and negative when the close is lower than the previous close. I used 2 period lagged signal as trigger so that the pair fast and slow lines can form golden cross and dead cross where entry signal can be produced.
Remarks
Feedbacks are appreciated.
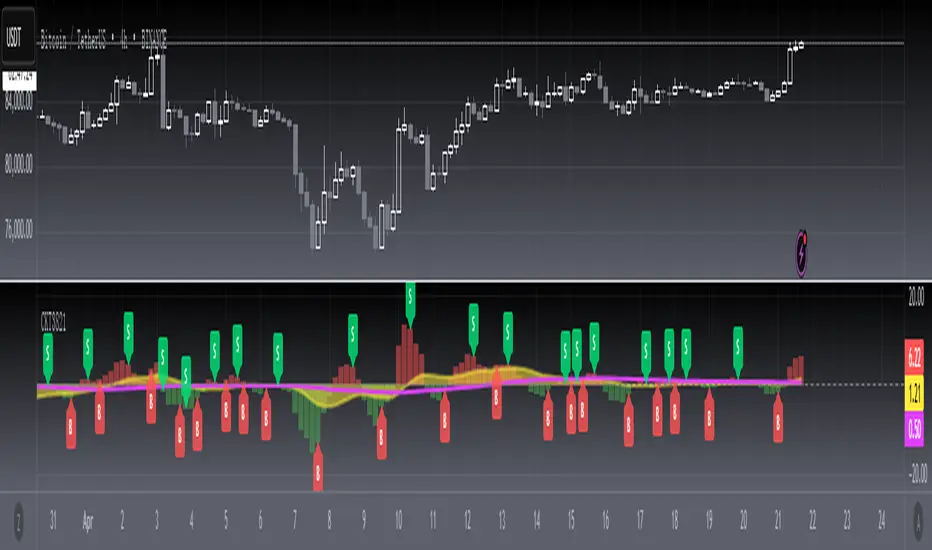
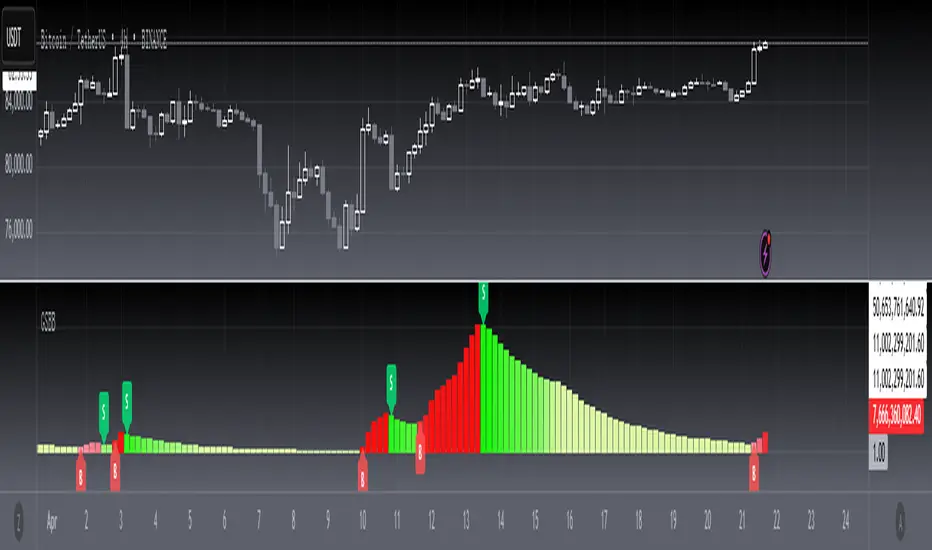
[blackcat] L3 Banker Fund AttackLevel 3
Background
This indicator is used to capture the movement of the banker fund. The buying and selling point is determined according to whether the momentum of the banker fund and the price momentum resonate.
How to use the indicator:
The red column line indicates that the banker fund accumulation signal appears, and the following 2 conditions are all satisfied to buy; (both above the green line of the banker fund attack threshold)
1. The yellow line and the purple line all cross the red accumulation histogram signal;
2. The yellow and purple trend lines are up
Key point: If the yellow line crosses the green line of the banker fund attack threshold, it will be pulled up or the big market will open! The main thing is to see the red accumulation histogram signal, or the green line that crosses the banker fund attack threshold. If there is a red accumulation histogram signal, it means that there are main low-acquisition chips, and start trading on the left to open a position. The area above the green line of the banker fund attack threshold belongs to the main force pulling stage. When the green line of the banker fund attack threshold is not broken upwards, there is still a lot of profit space, but if it can be effectively broken through, it is highly profitable!
Remarks
This indicator only effective for instruments that contains banker fund. If there is no obvious large fund inside, the indicator is not as meaningful as it is called.
I verified it worked well for > 4H or 1D timeframe. For the other time frames, you may need to check and verify by yourself.
Feedbacks are appreciated.

[blackcat]L3 Blackcat DMILevel 3
Background
Here ia a noval Directional Movement Index (DMI) which I uses customized functions to eliminate noise.
Function
This Directional Movement Index (DMI) helps determine whether a security is trending and attempts to measure the strength of the trend. The DMI ignores the direction of security. It's just trying to determine if there is a trend and if that trend is strong.
Bull--> White
Bear--> Yellow
ADX --> Orange
ADXR --> Aqua
Remarks
Closed Source
Feedbacks are appreciated.

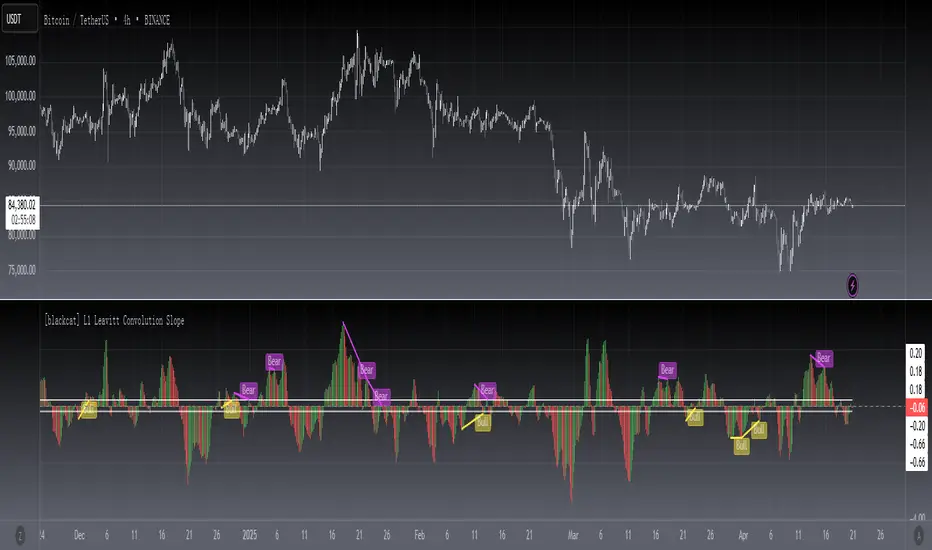
[blackcat] L1 Leavitt Convolution SlopeLevel 1
Background
First of all, I would like to thank @ashok1961 for his donation. Second, he made an interesting request: can I write a pine version of LeavittConvSlope.
Function
The indicator uses linear regression of price data to derive slope and acceleration information that helps traders spot trends and turning points. After trying this metric myself, I think it works better with the divergence detector. So I added it. Let me know what you think of this divergence detector.
Remarks
Feedbacks are appreciated.
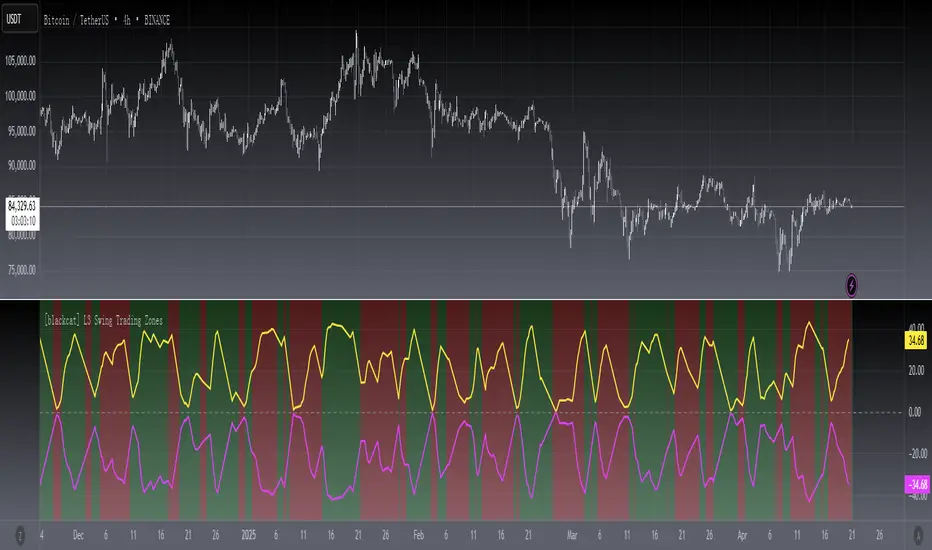
[blackcat] L3 Swing Trading ZonesLevel 3
Background
For swing trading, I consider a combination of multiple technical indicators to indicate periods of long and short positions.
Function
First, judge the daily-level long and short recommendations by the J value of the KDJ indicator in the weekly cycle. in addition. Second, draw bull-bear lines by integrating existing technical indicators such as rsi, adx, cci, dmi, etc. The bull line is above 0, the bear line is below 0, and the other is offsetting each other. When both are relatively close to the zero axis, it means that the strength is equal, and there will be signs of sideways.
Remarks
"D" timeframe ONLY.
Feedbacks are appreciated.
[blackcat] L1 Linear Regression-Adjusted EMALevel 1
Background
Vitali Apirine proposed a new idea named "The Linear Regression-Adjusted Exponential Moving Average". Here it is the pine v4 impelementation of this idea.
Function
Linear Regression Adjusted Exponential Moving Average (LRAdj EMA) is used to combine a linear regression (linreg in tradingview) with an EMA. It can be used to define the trend reveral points while filtering price action. The LRAdj EMA can be used in combination with a traditional EMA of the same length to facilitate trend identification or it can serve as an important MA candicate in a trading system to potentially replace T3, JMA, KAMA or other MA functions.
Remarks
Feedbacks are appreciated.

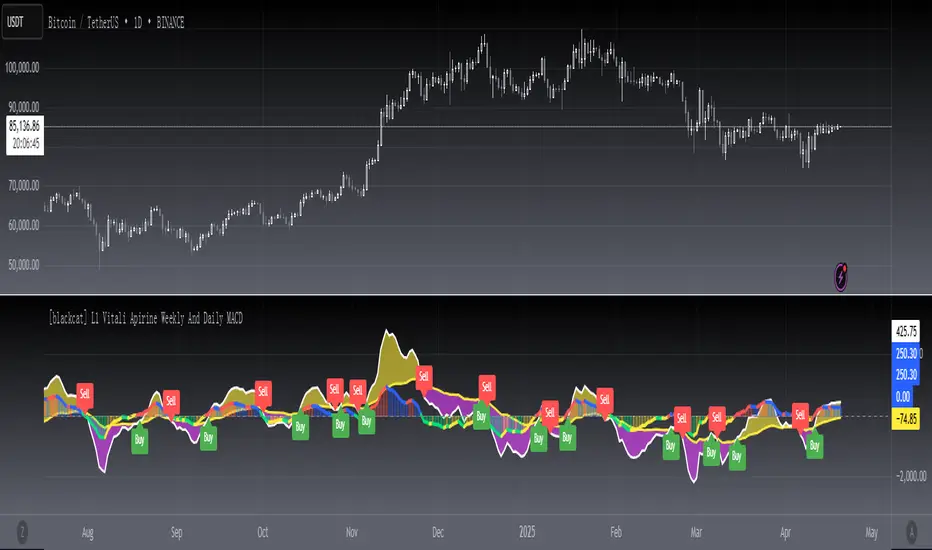
[blackcat] L1 Vitali Apirine Weekly And Daily MACDLevel 1
Background
This indicator was originally formulated by Vitali Apirine for TASC - December 2017 Traders Tips, “Weekly & Daily MACD”.
Function
In the article “Weekly & Daily MACD” in this issue, author Vitali Apirine introduces a novel approach to using the classic MACD indicator in a way that simulates calculations based on different timeframes while using just a daily-interval chart. He describes a number of ways to use this new indicator that allows traders to adapt it to differing markets and conditions.
Remarks
Feedbacks are appreciated.
[blackcat] L0 Understand request.security_lower_tf() functionLevel 0
Background
I am learning to use new function request.security_lower_tf() to realize some new features.
Function
Requests data from a lower timeframe than the chart's. The key difference is that the return is no longer series type but array. If you want to combine lower tf with higher tf to form a mtf, you may need to be good at array operations.
This is a very simple demonstration for request.security_lower_tf(), you will see how array grows under 15min tf with 1min intrabar data changes. It may help you understand how request.security_lower_tf() easier.
Remarks
Feedbacks are appreciated.

[blackcat] L1 Vitali Apirine HHs & LLs StochasticsLevel 1
Background
This indicator was originally formulated by Vitali Apirine for TASC - February 2016 Traders Tips.
Function
According to Vitali Apirine, his momentum indicator–based system HHLLS (higher high lower low stochastic) can help to spot emerging trends, define correction periods, and anticipate reversals. As with many indicators, HHLLS signals can also be generated by looking for divergences and crossovers. Because the HHLLS is an oscillator, it can also be used to identify overbought & oversold levels.
Remarks
I changed EMA or SMA into hanning windowing function to reduce lag issue.
colorful area is bearish power.
colorful solid thick line is bull power.
Feedbacks are appreciated.

[blackcat] L2 Vitali Apirine Weekly & Daily StochasticsLevel 2
Background
Vitali Apirine’s articles in the Sep issues on 2018,“Weekly & Daily Stochastics”
Function
In “Weekly & Daily Stochastics” in this issue, author Vitali Apirine introduces a novel approach to using the classic stochastic indicator in a way that simulates calculations based on different timeframes while using just a daily interval chart. He describes a number of ways to use this new indicator that allows traders to detect the state of longer-term trends while looking for entry points and reversals. Here, I am providing the TradingView pine code for an indicator based on the author’s ideas.
Remarks
Feedbacks are appreciated.

[blackcat] L2 Sylvain Vervoort SVE PivotsLevel 2
Background
Sylvain Vervoort’s articles in the May issues on 2018,“The V-Trade, Part 3: Technical Analysis—Fibonacci Projections And Daily Pivots”
Function
Sylvain Vervoort, in his May 2018 STOCKS & COMMODITIES article, “The V-Trade, Part 3: Technical Analysis—Fibonacci Projections And Daily Pivots,” introduces a modified version of the venerable floor trader pivots that he calls SvePivots. With his new SvePivots, he identifies additional support & resistance levels beyond the standard calculations. These include mid-levels between the between normal support & resistance as well as prior day highs and lows.
Remarks
you can customize 'res' parameter in setting to setup pivots' reference time frame.
Feedbacks are appreciated.
