Alt Market Index (Halving-Adjusted BTC Supply, EMA)
암호화폐 알트코인 시총 상위 125개를 모아서
나스닥 기반의 계산식을 활용한 알트코인지수125를 만들었습니다.
반감기에 따른 비트코인 하루 채굴량 갯수 추가까지 포함한 버전입니다.
일봉이 기준이 됩니다.
I created the Altcoin Index 125 by compiling the top 125 altcoins by market capitalization in the cryptocurrency market, using a calculation method based on the Nasdaq index.
This version also includes adjustments for Bitcoin’s halving events, reflecting changes in daily mining output. The index is based on daily candles.
Bitcoinprice

MVRV Ratio [Alpha Extract]The MVRV Ratio Indicator provides valuable insights into Bitcoin market cycles by tracking the relationship between market value and realized value. This powerful on-chain metric helps traders identify potential market tops and bottoms, offering clear buy and sell signals based on historical patterns of Bitcoin valuation.
🔶 CALCULATION The indicator processes MVRV ratio data through several analytical methods:
Raw MVRV Data: Collects MVRV data directly from INTOTHEBLOCK for Bitcoin
Optional Smoothing: Applies simple moving average (SMA) to reduce noise
Status Classification: Categorizes market conditions into four distinct states
Signal Generation: Produces trading signals based on MVRV thresholds
Price Estimation: Calculates estimated realized price (Current price / MVRV ratio)
Historical Context: Compares current values to historical extremes
Formula:
MVRV Ratio = Market Value / Realized Value
Smoothed MVRV = SMA(MVRV Ratio, Smoothing Length)
Estimated Realized Price = Current Price / MVRV Ratio
Distance to Top = ((3.5 / MVRV Ratio) - 1) * 100
Distance to Bottom = ((MVRV Ratio / 0.8) - 1) * 100
🔶 DETAILS Visual Features:
MVRV Plot: Color-coded line showing current MVRV value (red for overvalued, orange for moderately overvalued, blue for fair value, teal for undervalued)
Reference Levels: Horizontal lines indicating key MVRV thresholds (3.5, 2.5, 1.0, 0.8)
Zone Highlighting: Background color changes to highlight extreme market conditions (red for potentially overvalued, blue for potentially undervalued)
Information Table: Comprehensive dashboard showing current MVRV value, market status, trading signal, price information, and historical context
Interpretation:
MVRV ≥ 3.5: Potential market top, strong sell signal
MVRV ≥ 2.5: Overvalued market, consider selling
MVRV 1.5-2.5: Neutral market conditions
MVRV 1.0-1.5: Fair value, consider buying
MVRV < 1.0: Potential market bottom, strong buy signal
🔶 EXAMPLES
Market Top Identification: When MVRV ratio exceeds 3.5, the indicator signals potential market tops, highlighting periods where Bitcoin may be significantly overvalued.
Example: During bull market peaks, MVRV exceeding 3.5 has historically preceded major corrections, helping traders time their exits.
Bottom Detection: MVRV values below 1.0, especially approaching 0.8, have historically marked excellent buying opportunities.
Example: During bear market bottoms, MVRV falling below 1.0 has identified the most profitable entry points for long-term Bitcoin accumulation.
Tracking Market Cycles: The indicator provides a clear visualization of Bitcoin's market cycles from undervalued to overvalued states.
Example: Following the progression of MVRV from below 1.0 through fair value and eventually to overvalued territory helps traders position themselves appropriately throughout Bitcoin's market cycle.
Realized Price Support: The estimated realized price often acts as a significant
support/resistance level during market transitions.
Example: During corrections, price often finds support near the realized price level calculated by the indicator, providing potential entry points.
🔶 SETTINGS
Customization Options:
Smoothing: Toggle smoothing option and adjust smoothing length (1-50)
Table Display: Show/hide the information table
Table Position: Choose between top right, top left, bottom right, or bottom left positions
Visual Elements: All plots, lines, and background highlights can be customized for color and style
The MVRV Ratio Indicator provides traders with a powerful on-chain metric to identify potential market tops and bottoms in Bitcoin. By tracking the relationship between market value and realized value, this indicator helps identify periods of overvaluation and undervaluation, offering clear buy and sell signals based on historical patterns. The comprehensive information table delivers valuable context about current market conditions, helping traders make more informed decisions about market positioning throughout Bitcoin's cyclical patterns.

Long-Term VWAP Mean Reversion SDCACore Idea:
This indicator is designed to support Strategic Dollar Cost Averaging (SDCA) for Bitcoin using a cumulative VWAP-based mean reversion model. It helps long-term investors identify high-conviction buy zones and overbought conditions using statistical deviation from the cumulative VWAP. This indicator evaluates how much price is stretched from the true market average price, weighted by cumulative volume over time.
Core Concepts and Formulas:
Cumulative VWAP (Volume Weighted Average Price):
VWAP cumulative = ∑(Price×Volume) / ∑Volume
A long-term anchor that reflects the average dollar cost of all market participants across all candles. This version does not reset daily, unlike intraday VWAP.
VWAP Deviation % :
Deviation% = Price - VWAP cumulative / VWAP cumulative x 100
Shows how far current price has diverged from the long-term fair value.
Z-Score of VWAP Deviation:
Z= (Price−VWAP)−μ / σ (lookback period: default 200)
SDCA Multiplier Mapping:
*Keep in mind in my Z-Score system, -2 represents the overbought level (white horizontal line) and +2 represents oversold (cyan horizontal line) conditions. So the scores on the Y axis and Z-score in the table are reversed.
| Z-Score Range | SDCA Multiplier |
---------------------------------------------
| ≤ -2 | 0.25×
| -1 to +1 | 1.0×
| > +2 | 2.0×
The pink line plots this multiplier. It’s meant to control buy weight at each time step.
How to Use This for SDCA:
-Buy normally when the multiplier is 1.0× (Z-score between -1 and +1)
-Accelerate buying when Z-score is deeply negative (price far below VWAP)
-Slow or pause buying when Z-score is high (price far above VWAP)
-Use the stats panel to track current Z-score, VWAP level, deviation %, and multiplier
-Watch the red/blue backgrounds as visual confirmation of oversold/overbought zones
Inputs:
Z-Score Lookback Length:
Default: 200 but can be adjusted.
Visuals:
Z-Score Line (cyan): shows current standardized deviation from VWAP
Multiplier Line (bright pink): your SDCA intensity signal
Background Zones: cyan = oversold, white = overbought
Horizontal Lines: +2 and -2 standard deviation thresholds
Stats Panel (bottom right): live values for Z-score, multiplier, price, VWAP, and the deviation formula
Suited For:
-Long-term Bitcoin investors
-SDCA Systems
-Mean reversion systems
-Macro-level buy/sell planning

Bitcoin as % Global M2 signalThis script provides signal system:
Buy signal: each time the YoY of the Global M2 rises more than 2.5% while the distance between the bitcoin price as a percentage of the Global M2 is below its yearly SMA.
Sell signal: the distance between the bitcoin price as a percentage of the Global M2 and its yearly SMA is > 0.7
This is a very simple system, but it seems to work pretty well to ride the bitcoin price cycle wave.
The parameters are hard coded but they can be easily changed to test different levels for both the buy and sell signals.

Global M2 YoY % Increase signalThe script produces a signal each time the global M2 increases more than 2.5%. This usually coincides with bitcoin prices pumps, except when it is late in the business cycle or the bitcoin price / halving cycle.
It leverages dylanleclair Global M2 YoY % change, with several modifications:
adding a 10 week lead at the YoY Change plot for better visibility, so that the bitcoin pump moreless coincides with the YoY change.
signal increases > 2.5 in Global M2 at the point at which they occur with a green triangle up.

BTC Price-Volume Efficiency Z-Score (PVER-Z)Overview:
This PVER-Z Score measures Bitcoin’s price movement efficiency relative to trading volume, normalized using a Z-Score over a long-term 200-day period.
It highlights statistically rare inefficiencies, helping investors spot extreme accumulation and distribution zones for systematic SDCA strategies.
Concept:
- Measures how efficiently price has moved relative to the volume that supported it over a long historical window (Default 200 days) but can be adjustable.
- It compares cumulative price changes vs cumulative volume flow.
- Then normalizes those inefficiencies using Z-Score statistics.
How It Works:
1. Calculates the absolute daily price change divided by volume (price-volume efficiency ratio).
2. Applies EMA smoothing to remove noisy fluctuations.
3. Normalizes the result into a Z-Score to detect statistically significant outliers.
4. Plots dynamic heatmap colors as the efficiency score moves through different deviation zones.
5. Background fills appear when the Z-Score moves beyond ±2 to ±3 SD, signaling rare macro opportunities.
Why is Bitcoin price rising while PVER-Z is falling toward green zone?
1. PVER-Z is not just "price" — it's price change relative to volume. PVER-Z measures how efficient the price movement is relative to volume. It's not "price going up" or "price going down" directly. It's how unusual or inefficient the price versus volume relationship is, compared to its historical average.
2. A rising Bitcoin price + weak efficiency = PVER-Z falls.
If Bitcoin rises but volume is super strong (normal buying volume), no problem, the PVER-Z stays normal. If Bitcoin rises but with very weak volume support, PVER-Z falls.
***Usage Notes***:
- Best used on the daily timeframe or higher.
- When the Z-Score enters the green zone (-2 to -3 SD), it signals a historically rare accumulation zone — favoring long-term buying for SDCA.
- When the Z-Score enters the red zone (+2 to +3 SD), it signals overextended distribution — caution recommended.
- Designed strictly for mean-reversion analysis, no trend-following signals.
- The red zone on a proper Z chart would be -2SD to -3SD and +2SD to +3SD for the green zone. At the time of publishing I do not know how to adjust the values on the indicator itself. The red zone at -2SD is actually +2 Standard Deviations on a Z Score SD Chart. (overbought zone).
- Your green zone at +2SD is actually -2SD Standard Deviations (oversold zone).
- Built manually with no reliance on built-in indicators
- Designed for Bitcoin on the 1D, 3D, or Weekly timeframes. NOT for intraday trading.
- DO NOT SOELY RELY ON THIS INDICATOR FOR YOUR LONG TERM VALUATION. I AM NOT RESPONSIBLE FOR YOUR FINANICAL ASSETS.

Sentiment OscillatorIn the complex world of trading, understanding market sentiment can be like reading the emotional pulse of financial markets. Our Sentiment Oscillator is designed to be your personal market mood translator, helping you navigate through the noise of price movements and market fluctuations.
Imagine having a sophisticated tool that goes beyond traditional price charts, diving deep into the underlying dynamics of market behavior. This indicator doesn't just show you numbers – it tells you a story about market sentiment, combining multiple financial signals to give you a comprehensive view of potential market directions.
The Sentiment Oscillator acts like a sophisticated emotional barometer for stocks, cryptocurrencies, or any tradable asset. It analyzes price changes, market volatility, trading volume, and long-term trends to generate a unique sentiment score. This score ranges from highly bullish to deeply bearish, providing traders with an intuitive visual representation of market mood.
Green zones indicate positive market sentiment, suggesting potential buying opportunities. Red zones signal caution, hinting at possible downward trends. The oscillator's gray neutral zone helps you identify periods of market uncertainty, allowing for more calculated trading decisions.
What sets this indicator apart is its ability to blend multiple market factors into a single, easy-to-understand indicator. It's not just about current price – it's about understanding the deeper currents moving beneath the surface of market prices.
Traders can use this oscillator to:
- Identify potential trend reversals
- Understand market sentiment beyond price movement
- Spot periods of market strength or weakness
- Complement other technical analysis tools
Whether you're a day trader, swing trader, or long-term investor, the Sentiment Oscillator provides an additional layer of insight to support your trading strategy. Remember, no indicator is a crystal ball, but this tool can help you make more informed decisions in the dynamic world of trading.

Cabal Dev IndicatorThis is a TradingView Pine Script (version 6) that creates a technical analysis indicator called the "Cabal Dev Indicator." Here's what it does:
1. Core Functionality:
- It calculates a modified version of the Stochastic Momentum Index (SMI), which is a momentum indicator that shows where the current close is relative to the high/low range over a period
- The indicator combines elements of stochastic oscillator calculations with exponential moving averages (EMA)
2. Key Components:
- Uses configurable input parameters for:
- Percent K Length (default 15)
- Percent D Length (default 3)
- EMA Signal Length (default 15)
- Smoothing Period (default 5)
- Overbought level (default 40)
- Oversold level (default -40)
3. Calculation Method:
- Calculates the highest high and lowest low over the specified period
- Finds the difference between current close and the midpoint of the high-low range
- Applies EMA smoothing to both the range and relative differences
- Generates an SMI value and further smooths it using a simple moving average (SMA)
- Creates an EMA signal line based on the smoothed SMI
4. Visual Output:
- Plots the smoothed SMI line in green
- Plots an EMA signal line in red
- Shows overbought and oversold levels as gray horizontal lines
- Fills the areas above the overbought level with light red
- Fills the areas below the oversold level with light green
This indicator appears designed to help traders identify potential overbought and oversold conditions in the market, as well as momentum shifts, which could be used for trading decisions.
Would you like me to explain any specific part of the indicator in more detail?

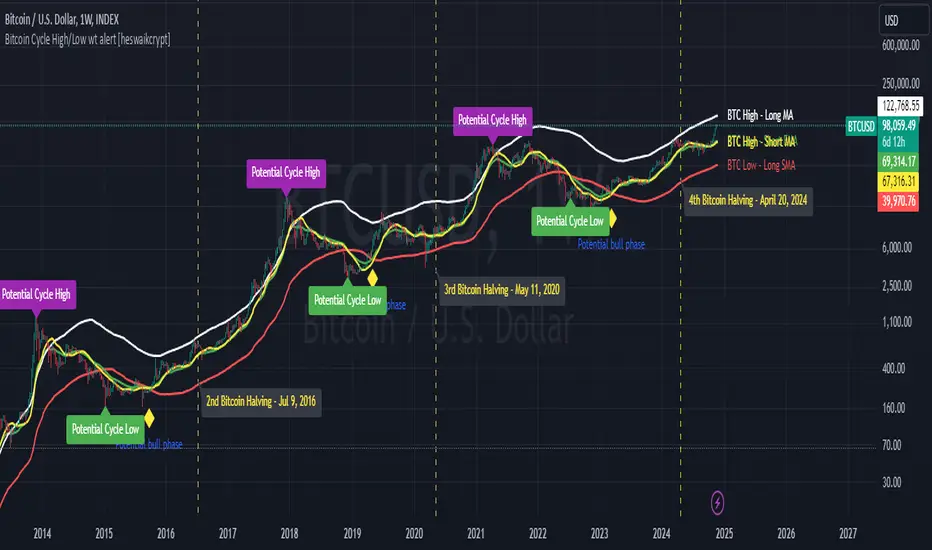
Bitcoin Cycle High/Low with functional Alert [heswaikcrypt]Introduction
Just as machines are fine-tuned for maximum efficiency, trading indicators must evolve to meet the demands of ever-changing markets.
Credit goes to the initial author, @NoCreditsLeft I only improved the existing Pi-cycle indicator with a functional alert and included a bull mode indicator in the script. The alert can help you get a live alert at candle close when the cycle tops, bottoms, and the potential bull phase switch occurs.
Philip Swift’s Pi Cycle Top Indicator is a brilliant example of leveraging mathematical relationships to signal critical turning points in Bitcoin’s price cycles. Historically, it has identified market and local tops with some relative accuracy, often within three days, as demonstrated in all the previous bull run cycles.
At its core, the Pi Cycle Indicator derives its name from the mathematical constant π (pi), achieved by using simple moving averages (MAs) in a specific ratio: 𝜋 = Long MA/short MA
The Bull mode switch is calculated using a crossover of the short exponentia moving average and the long moving average.
.
.
.
Knowing when Bitcoin reaches its top—and receiving timely alerts about it—is crucial for successful trading. The indicator is designed to signal;
Potential Bitcoin tops: Purple label
Potential Bitcoin bottoms : green Label, and
Parabolic swing : Yellow diamond shape (relating to the market switching to a potential bull mode)
"Please note: This indicator is tailored for Bitcoin using historical data analysis and should not be considered definitive. However accurate it might be."
Setting alerts
To set the alert conditions, select any alert function call to get alert whenever the conditions are met. The script is configured on dialy TF; you can set it on 1D or weekly TF.
Enjoy and Trade smartly
2024 - Median High-Low % Change - Monthly, Weekly, DailyDescription:
This indicator provides a statistical overview of Bitcoin's volatility by displaying the median high-to-low percentage changes for monthly, weekly, and daily timeframes. It allows traders to visualize typical price fluctuations within each period, supporting range and volatility-based trading strategies.
How It Works:
Calculation of High-Low % Change: For each selected timeframe (monthly, weekly, and daily), the script calculates the percentage change from the high to the low price within the period.
Median Calculation: The median of these high-to-low changes is determined for each timeframe, offering a robust central measure that minimizes the impact of extreme price swings.
Table Display: At the end of the chart, the script displays a table in the top-right corner with the median values for each selected timeframe. This table is updated dynamically to show the latest data.
Usage Notes:
This script includes input options to toggle the visibility of each timeframe (monthly, weekly, and daily) in the table.
Designed to be used with Bitcoin on daily and higher timeframes for accurate statistical insights.
Ideal for traders looking to understand Bitcoin's typical volatility and adjust their strategies accordingly.
This indicator does not provide specific buy or sell signals but serves as an analytical tool for understanding volatility patterns.

Bitcoin CME-Spot Z-Spread - Strategy [presentTrading]This time is a swing trading strategy! It measures the sentiment of the Bitcoin market through the spread of CME Bitcoin Futures and Bitfinex BTCUSD Spot prices. By applying Bollinger Bands to the spread, the strategy seeks to capture mean-reversion opportunities when prices deviate significantly from their historical norms
█ Introduction and How it is Different
The Bitcoin CME-Spot Bollinger Bands Strategy is designed to capture mean-reversion opportunities by exploiting the spread between CME Bitcoin Futures and Bitfinex BTCUSD Spot prices. The strategy uses Bollinger Bands to detect when the spread between these two correlated assets has deviated significantly from its historical norm, signaling potential overbought or oversold conditions.
What sets this strategy apart is its focus on spread trading between futures and spot markets rather than price-based indicators. By applying Bollinger Bands to the spread rather than individual prices, the strategy identifies price inefficiencies across markets, allowing traders to take advantage of the natural reversion to the mean that often occurs in these correlated assets.
BTCUSD 8hr Performance
█ Strategy, How It Works: Detailed Explanation
The strategy relies on Bollinger Bands to assess the volatility and relative deviation of the spread between CME Bitcoin Futures and Bitfinex BTCUSD Spot prices. Bollinger Bands consist of a moving average and two standard deviation bands, which help measure how much the spread deviates from its historical mean.
🔶 Spread Calculation:
The spread is calculated by subtracting the Bitfinex spot price from the CME Bitcoin futures price:
Spread = CME Price - Bitfinex Price
This spread represents the difference between the futures and spot markets, which may widen or narrow based on supply and demand dynamics in each market. By analyzing the spread, the strategy can detect when prices are too far apart (potentially overbought or oversold), indicating a trading opportunity.
🔶 Bollinger Bands Calculation:
The Bollinger Bands for the spread are calculated using a simple moving average (SMA) and the standard deviation of the spread over a defined period.
1. Moving Average (SMA):
The simple moving average of the spread (mu_S) over a specified period P is calculated as:
mu_S = (1/P) * sum(S_i from i=1 to P)
Where S_i represents the spread at time i, and P is the lookback period (default is 200 bars). The moving average provides a baseline for the normal spread behavior.
2. Standard Deviation:
The standard deviation (sigma_S) of the spread is calculated to measure the volatility of the spread:
sigma_S = sqrt((1/P) * sum((S_i - mu_S)^2 from i=1 to P))
3. Upper and Lower Bollinger Bands:
The upper and lower Bollinger Bands are derived by adding and subtracting a multiple of the standard deviation from the moving average. The number of standard deviations is determined by a user-defined parameter k (default is 2.618).
- Upper Band:
Upper Band = mu_S + (k * sigma_S)
- Lower Band:
Lower Band = mu_S - (k * sigma_S)
These bands provide a dynamic range within which the spread typically fluctuates. When the spread moves outside of these bands, it is considered overbought or oversold, potentially offering trading opportunities.
Local view
🔶 Entry Conditions:
- Long Entry: A long position is triggered when the spread crosses below the lower Bollinger Band, indicating that the spread has become oversold and is likely to revert upward.
Spread < Lower Band
- Short Entry: A short position is triggered when the spread crosses above the upper Bollinger Band, indicating that the spread has become overbought and is likely to revert downward.
Spread > Upper Band
🔶 Risk Management and Profit-Taking:
The strategy incorporates multi-step take profits to lock in gains as the trade moves in favor. The position is gradually reduced at predefined profit levels, reducing risk while allowing part of the trade to continue running if the price keeps moving favorably.
Additionally, the strategy uses a hold period exit mechanism. If the trade does not hit any of the take-profit levels within a certain number of bars, the position is closed automatically to avoid excessive exposure to market risks.
█ Trade Direction
The trade direction is based on deviations of the spread from its historical norm:
- Long Trade: The strategy enters a long position when the spread crosses below the lower Bollinger Band, signaling an oversold condition where the spread is expected to narrow.
- Short Trade: The strategy enters a short position when the spread crosses above the upper Bollinger Band, signaling an overbought condition where the spread is expected to widen.
These entries rely on the assumption of mean reversion, where extreme deviations from the average spread are likely to revert over time.
█ Usage
The Bitcoin CME-Spot Bollinger Bands Strategy is ideal for traders looking to capitalize on price inefficiencies between Bitcoin futures and spot markets. It’s especially useful in volatile markets where large deviations between futures and spot prices occur.
- Market Conditions: This strategy is most effective in correlated markets, like CME futures and spot Bitcoin. Traders can adjust the Bollinger Bands period and standard deviation multiplier to suit different volatility regimes.
- Backtesting: Before deployment, backtesting the strategy across different market conditions and timeframes is recommended to ensure robustness. Adjust the take-profit steps and hold periods to reflect the trader’s risk tolerance and market behavior.
█ Default Settings
The default settings provide a balanced approach to spread trading using Bollinger Bands but can be adjusted depending on market conditions or personal trading preferences.
🔶 Bollinger Bands Period (200 bars):
This defines the number of bars used to calculate the moving average and standard deviation for the Bollinger Bands. A longer period smooths out short-term fluctuations and focuses on larger, more significant trends. Adjusting the period affects the responsiveness of the strategy:
- Shorter periods (e.g., 100 bars): Makes the strategy more reactive to short-term market fluctuations, potentially generating more signals but increasing the risk of false positives.
- Longer periods (e.g., 300 bars): Focuses on longer-term trends, reducing the frequency of trades and focusing only on significant deviations.
🔶 Standard Deviation Multiplier (2.618):
The multiplier controls how wide the Bollinger Bands are around the moving average. By default, the bands are set at 2.618 standard deviations away from the average, ensuring that only significant deviations trigger trades.
- Higher multipliers (e.g., 3.0): Require a more extreme deviation to trigger trades, reducing trade frequency but potentially increasing the accuracy of signals.
- Lower multipliers (e.g., 2.0): Make the bands narrower, increasing the number of trade signals but potentially decreasing their reliability.
🔶 Take-Profit Levels:
The strategy has four take-profit levels to gradually lock in profits:
- Level 1 (3%): 25% of the position is closed at a 3% profit.
- Level 2 (8%): 20% of the position is closed at an 8% profit.
- Level 3 (14%): 15% of the position is closed at a 14% profit.
- Level 4 (21%): 10% of the position is closed at a 21% profit.
Adjusting these take-profit levels affects how quickly profits are realized:
- Lower take-profit levels: Capture gains more quickly, reducing risk but potentially cutting off larger profits.
- Higher take-profit levels: Let trades run longer, aiming for bigger gains but increasing the risk of price reversals before profits are locked in.
🔶 Hold Days (20 bars):
The strategy automatically closes the position after 20 bars if none of the take-profit levels are hit. This feature prevents trades from being held indefinitely, especially if market conditions are stagnant. Adjusting this:
- Shorter hold periods: Reduce the duration of exposure, minimizing risks from market changes but potentially closing trades too early.
- Longer hold periods: Allow trades to stay open longer, increasing the chance for mean reversion but also increasing exposure to unfavorable market conditions.
By understanding how these default settings affect the strategy’s performance, traders can optimize the Bitcoin CME-Spot Bollinger Bands Strategy to their preferences, adapting it to different market environments and risk tolerances.

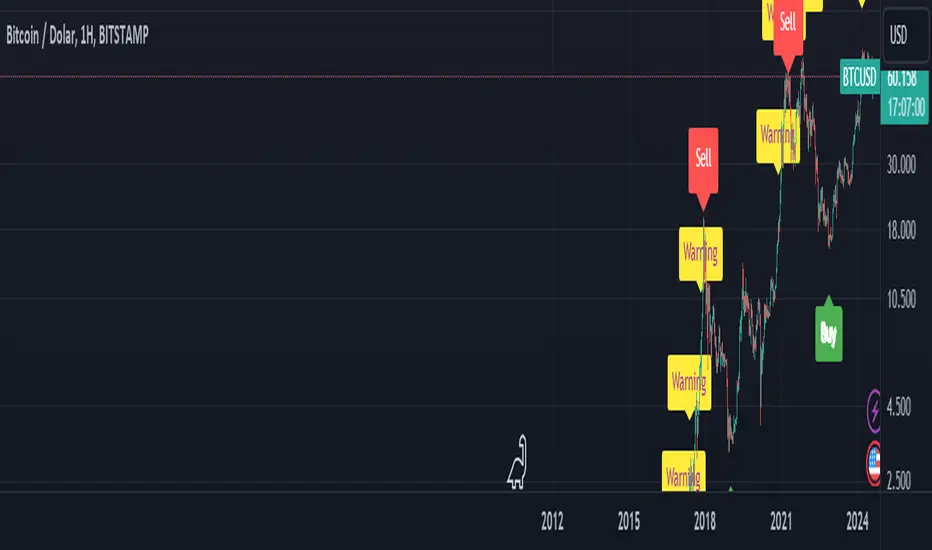
BTC Arcturus IndicatorBTC Arcturus Indicator: This indicator is designed to create buy and sell signals based on the market value of Bitcoin. It also predicts potential market tops with the Pi Cycle Top indicator.
How Does It Work?
1. MVRVZ (Market Value to Realized Value-Z Score) Calculation:
MC: Bitcoin's market cap (Market Cap) is pulled daily from Glassnode data.
MCR: Realized Market Cap of Bitcoin is taken daily from Coinmetrics data.
MVRVZ: It is calculated by dividing the difference between Bitcoin's market value and realized market value by one standard deviation. This value indicates whether the market is overvalued or undervalued.
2. Reception and Warning Signals:
Buy Signal: When MVRVZ falls below the -0.255 threshold value, the indicator gives a "Buy" signal. This indicates that Bitcoin is undervalued and may be a buying opportunity.
Warning Signal: A warning signal turns on when MVRVZ exceeds the threshold value of 2.765. This indicates that the market is approaching saturation and caution is warranted.
3. Tracking the Highest MVRVZ Value:
The indicator records the highest MVRVZ value in the last 10 candlesticks. This value is used to determine whether the market has reached its highest risk levels.
4. Warning Display:
If the MVRVZ value matches the highest value in the last 10 bars and this warning has not been displayed before, a "Warning" signal is displayed.
Once the warning signal is shown, no further warnings are shown for 10 candles.
5. Pi Cycle Top Indicator:
Pi Cycle Top: This indicator predicts Bitcoin tops by comparing two moving averages (350-day and 111-day). If the short-term moving average falls below the long-term moving average, this is considered a sell signal.
The indicator displays this signal with the label "Sell", indicating a potential market top.
User Guide:
Green Buy Signal: It means Bitcoin is cheap and offers a buying opportunity.
Yellow Warning Signal: Indicates that Bitcoin has reached possible profit taking points and caution should be exercised.
Red Sell Signal: Indicates that Bitcoin has reached market saturation and it may be appropriate to sell.
Atlantean Bitcoin Weekly Market Condition - Top/Bottom BTC Overview:
The "Atlantean Bitcoin Weekly Market Condition Detector - Top/Bottom BTC" is a specialized TradingView indicator designed to identify significant turning points in the Bitcoin market on a weekly basis. By analyzing long-term and short-term moving averages across two distinct resolutions, this indicator provides traders with valuable insights into potential market bottoms and tops, as well as the initiation of bull markets.
Key Features:
Market Bottom Detection: The script uses a combination of a simple moving average (SMA) and an exponential moving average (EMA) calculated over long and short periods to identify potential market bottoms. When these conditions are met, the script signals a "Market Bottom" label on the chart, indicating a possible buying opportunity.
Bull Market Start Indicator: When the short-term EMA crosses above the long-term SMA, it signals the beginning of a bull market. This is marked by a "Bull Market Start" label on the chart, helping traders to prepare for potential market upswings.
Market Top Detection: The script identifies potential market tops by analyzing the crossunder of long and short-term moving averages. A "Market Top" label is plotted, suggesting a potential selling point.
Customizable Moving Averages Display: Users can choose to display the moving averages used for detecting market tops and bottoms, providing additional insights into market conditions.
How It Works: The indicator operates by monitoring the interactions between the specified moving averages:
Market Bottom: Detected when the long-term SMA (adjusted by a factor of 0.745) crosses over the short-term EMA.
Bull Market Start: Detected when the short-term EMA crosses above the long-term SMA.
Market Top: Detected when the long-term SMA (adjusted by a factor of 2) crosses under the short-term SMA.
These conditions are highlighted on the chart, allowing traders to visualize significant market events and make informed decisions.
Intended Use: This indicator is best used on weekly Bitcoin charts. It’s designed to provide long-term market insights rather than short-term trading signals. Traders can use this tool to identify strategic entry and exit points during major market cycles. The optional display of moving averages can further enhance understanding of market dynamics.
Originality and Utility: Unlike many other indicators, this script not only highlights traditional market tops and bottoms but also identifies the aggressive start of bull markets, offering a comprehensive view of market conditions. The unique combination of adjusted moving averages makes this script a valuable tool for long-term Bitcoin traders.
Disclaimer: The signals provided by this indicator are based on historical data and mathematical calculations. They do not guarantee future market performance. Traders should use this tool as part of a broader trading strategy and consider other factors before making trading decisions. Not financial advice.
Happy Trading!
By Atlantean

BAERMThe Bitcoin Auto-correlation Exchange Rate Model: A Novel Two Step Approach
THIS IS NOT FINANCIAL ADVICE. THIS ARTICLE IS FOR EDUCATIONAL AND ENTERTAINMENT PURPOSES ONLY.
If you enjoy this software and information, please consider contributing to my lightning address
Prelude
It has been previously established that the Bitcoin daily USD exchange rate series is extremely auto-correlated
In this article, we will utilise this fact to build a model for Bitcoin/USD exchange rate. But not a model for predicting the exchange rate, but rather a model to understand the fundamental reasons for the Bitcoin to have this exchange rate to begin with.
This is a model of sound money, scarcity and subjective value.
Introduction
Bitcoin, a decentralised peer to peer digital value exchange network, has experienced significant exchange rate fluctuations since its inception in 2009. In this article, we explore a two-step model that reasonably accurately captures both the fundamental drivers of Bitcoin’s value and the cyclical patterns of bull and bear markets. This model, whilst it can produce forecasts, is meant more of a way of understanding past exchange rate changes and understanding the fundamental values driving the ever increasing exchange rate. The forecasts from the model are to be considered inconclusive and speculative only.
Data preparation
To develop the BAERM, we used historical Bitcoin data from Coin Metrics, a leading provider of Bitcoin market data. The dataset includes daily USD exchange rates, block counts, and other relevant information. We pre-processed the data by performing the following steps:
Fixing date formats and setting the dataset’s time index
Generating cumulative sums for blocks and halving periods
Calculating daily rewards and total supply
Computing the log-transformed price
Step 1: Building the Base Model
To build the base model, we analysed data from the first two epochs (time periods between Bitcoin mining reward halvings) and regressed the logarithm of Bitcoin’s exchange rate on the mining reward and epoch. This base model captures the fundamental relationship between Bitcoin’s exchange rate, mining reward, and halving epoch.
where Yt represents the exchange rate at day t, Epochk is the kth epoch (for that t), and epsilont is the error term. The coefficients beta0, beta1, and beta2 are estimated using ordinary least squares regression.
Base Model Regression
We use ordinary least squares regression to estimate the coefficients for the betas in figure 2. In order to reduce the possibility of over-fitting and ensure there is sufficient out of sample for testing accuracy, the base model is only trained on the first two epochs. You will notice in the code we calculate the beta2 variable prior and call it “phaseplus”.
The code below shows the regression for the base model coefficients:
\# Run the regression
mask = df\ < 2 # we only want to use Epoch's 0 and 1 to estimate the coefficients for the base model
reg\_X = df.loc\ [mask, \ \].shift(1).iloc\
reg\_y = df.loc\ .iloc\
reg\_X = sm.add\_constant(reg\_X)
ols = sm.OLS(reg\_y, reg\_X).fit()
coefs = ols.params.values
print(coefs)
The result of this regression gives us the coefficients for the betas of the base model:
\
or in more human readable form: 0.029, 0.996869586, -0.00043. NB that for the auto-correlation/momentum beta, we did NOT round the significant figures at all. Since the momentum is so important in this model, we must use all available significant figures.
Fundamental Insights from the Base Model
Momentum effect: The term 0.997 Y suggests that the exchange rate of Bitcoin on a given day (Yi) is heavily influenced by the exchange rate on the previous day. This indicates a momentum effect, where the price of Bitcoin tends to follow its recent trend.
Momentum effect is a phenomenon observed in various financial markets, including stocks and other commodities. It implies that an asset’s price is more likely to continue moving in its current direction, either upwards or downwards, over the short term.
The momentum effect can be driven by several factors:
Behavioural biases: Investors may exhibit herding behaviour or be subject to cognitive biases such as confirmation bias, which could lead them to buy or sell assets based on recent trends, reinforcing the momentum.
Positive feedback loops: As more investors notice a trend and act on it, the trend may gain even more traction, leading to a self-reinforcing positive feedback loop. This can cause prices to continue moving in the same direction, further amplifying the momentum effect.
Technical analysis: Many traders use technical analysis to make investment decisions, which often involves studying historical exchange rate trends and chart patterns to predict future exchange rate movements. When a large number of traders follow similar strategies, their collective actions can create and reinforce exchange rate momentum.
Impact of halving events: In the Bitcoin network, new bitcoins are created as a reward to miners for validating transactions and adding new blocks to the blockchain. This reward is called the block reward, and it is halved approximately every four years, or every 210,000 blocks. This event is known as a halving.
The primary purpose of halving events is to control the supply of new bitcoins entering the market, ultimately leading to a capped supply of 21 million bitcoins. As the block reward decreases, the rate at which new bitcoins are created slows down, and this can have significant implications for the price of Bitcoin.
The term -0.0004*(50/(2^epochk) — (epochk+1)²) accounts for the impact of the halving events on the Bitcoin exchange rate. The model seems to suggest that the exchange rate of Bitcoin is influenced by a function of the number of halving events that have occurred.
Exponential decay and the decreasing impact of the halvings: The first part of this term, 50/(2^epochk), indicates that the impact of each subsequent halving event decays exponentially, implying that the influence of halving events on the Bitcoin exchange rate diminishes over time. This might be due to the decreasing marginal effect of each halving event on the overall Bitcoin supply as the block reward gets smaller and smaller.
This is antithetical to the wrong and popular stock to flow model, which suggests the opposite. Given the accuracy of the BAERM, this is yet another reason to question the S2F model, from a fundamental perspective.
The second part of the term, (epochk+1)², introduces a non-linear relationship between the halving events and the exchange rate. This non-linear aspect could reflect that the impact of halving events is not constant over time and may be influenced by various factors such as market dynamics, speculation, and changing market conditions.
The combination of these two terms is expressed by the graph of the model line (see figure 3), where it can be seen the step from each halving is decaying, and the step up from each halving event is given by a parabolic curve.
NB - The base model has been trained on the first two halving epochs and then seeded (i.e. the first lag point) with the oldest data available.
Constant term: The constant term 0.03 in the equation represents an inherent baseline level of growth in the Bitcoin exchange rate.
In any linear or linear-like model, the constant term, also known as the intercept or bias, represents the value of the dependent variable (in this case, the log-scaled Bitcoin USD exchange rate) when all the independent variables are set to zero.
The constant term indicates that even without considering the effects of the previous day’s exchange rate or halving events, there is a baseline growth in the exchange rate of Bitcoin. This baseline growth could be due to factors such as the network’s overall growth or increasing adoption, or changes in the market structure (more exchanges, changes to the regulatory environment, improved liquidity, more fiat on-ramps etc).
Base Model Regression Diagnostics
Below is a summary of the model generated by the OLS function
OLS Regression Results
\==============================================================================
Dep. Variable: logprice R-squared: 0.999
Model: OLS Adj. R-squared: 0.999
Method: Least Squares F-statistic: 2.041e+06
Date: Fri, 28 Apr 2023 Prob (F-statistic): 0.00
Time: 11:06:58 Log-Likelihood: 3001.6
No. Observations: 2182 AIC: -5997.
Df Residuals: 2179 BIC: -5980.
Df Model: 2
Covariance Type: nonrobust
\==============================================================================
coef std err t P>|t| \
\------------------------------------------------------------------------------
const 0.0292 0.009 3.081 0.002 0.011 0.048
logprice 0.9969 0.001 1012.724 0.000 0.995 0.999
phaseplus -0.0004 0.000 -2.239 0.025 -0.001 -5.3e-05
\==============================================================================
Omnibus: 674.771 Durbin-Watson: 1.901
Prob(Omnibus): 0.000 Jarque-Bera (JB): 24937.353
Skew: -0.765 Prob(JB): 0.00
Kurtosis: 19.491 Cond. No. 255.
\==============================================================================
Below we see some regression diagnostics along with the regression itself.
Diagnostics: We can see that the residuals are looking a little skewed and there is some heteroskedasticity within the residuals. The coefficient of determination, or r2 is very high, but that is to be expected given the momentum term. A better r2 is manually calculated by the sum square of the difference of the model to the untrained data. This can be achieved by the following code:
\# Calculate the out-of-sample R-squared
oos\_mask = df\ >= 2
oos\_actual = df.loc\
oos\_predicted = df.loc\
residuals\_oos = oos\_actual - oos\_predicted
SSR = np.sum(residuals\_oos \*\* 2)
SST = np.sum((oos\_actual - oos\_actual.mean()) \*\* 2)
R2\_oos = 1 - SSR/SST
print("Out-of-sample R-squared:", R2\_oos)
The result is: 0.84, which indicates a very close fit to the out of sample data for the base model, which goes some way to proving our fundamental assumption around subjective value and sound money to be accurate.
Step 2: Adding the Damping Function
Next, we incorporated a damping function to capture the cyclical nature of bull and bear markets. The optimal parameters for the damping function were determined by regressing on the residuals from the base model. The damping function enhances the model’s ability to identify and predict bull and bear cycles in the Bitcoin market. The addition of the damping function to the base model is expressed as the full model equation.
This brings me to the question — why? Why add the damping function to the base model, which is arguably already performing extremely well out of sample and providing valuable insights into the exchange rate movements of Bitcoin.
Fundamental reasoning behind the addition of a damping function:
Subjective Theory of Value: The cyclical component of the damping function, represented by the cosine function, can be thought of as capturing the periodic fluctuations in market sentiment. These fluctuations may arise from various factors, such as changes in investor risk appetite, macroeconomic conditions, or technological advancements. Mathematically, the cyclical component represents the frequency of these fluctuations, while the phase shift (α and β) allows for adjustments in the alignment of these cycles with historical data. This flexibility enables the damping function to account for the heterogeneity in market participants’ preferences and expectations, which is a key aspect of the subjective theory of value.
Time Preference and Market Cycles: The exponential decay component of the damping function, represented by the term e^(-0.0004t), can be linked to the concept of time preference and its impact on market dynamics. In financial markets, the discounting of future cash flows is a common practice, reflecting the time value of money and the inherent uncertainty of future events. The exponential decay in the damping function serves a similar purpose, diminishing the influence of past market cycles as time progresses. This decay term introduces a time-dependent weight to the cyclical component, capturing the dynamic nature of the Bitcoin market and the changing relevance of past events.
Interactions between Cyclical and Exponential Decay Components: The interplay between the cyclical and exponential decay components in the damping function captures the complex dynamics of the Bitcoin market. The damping function effectively models the attenuation of past cycles while also accounting for their periodic nature. This allows the model to adapt to changing market conditions and to provide accurate predictions even in the face of significant volatility or structural shifts.
Now we have the fundamental reasoning for the addition of the function, we can explore the actual implementation and look to other analogies for guidance —
Financial and physical analogies to the damping function:
Mathematical Aspects: The exponential decay component, e^(-0.0004t), attenuates the amplitude of the cyclical component over time. This attenuation factor is crucial in modelling the diminishing influence of past market cycles. The cyclical component, represented by the cosine function, accounts for the periodic nature of market cycles, with α determining the frequency of these cycles and β representing the phase shift. The constant term (+3) ensures that the function remains positive, which is important for practical applications, as the damping function is added to the rest of the model to obtain the final predictions.
Analogies to Existing Damping Functions: The damping function in the BAERM is similar to damped harmonic oscillators found in physics. In a damped harmonic oscillator, an object in motion experiences a restoring force proportional to its displacement from equilibrium and a damping force proportional to its velocity. The equation of motion for a damped harmonic oscillator is:
x’’(t) + 2γx’(t) + ω₀²x(t) = 0
where x(t) is the displacement, ω₀ is the natural frequency, and γ is the damping coefficient. The damping function in the BAERM shares similarities with the solution to this equation, which is typically a product of an exponential decay term and a sinusoidal term. The exponential decay term in the BAERM captures the attenuation of past market cycles, while the cosine term represents the periodic nature of these cycles.
Comparisons with Financial Models: In finance, damped oscillatory models have been applied to model interest rates, stock prices, and exchange rates. The famous Black-Scholes option pricing model, for instance, assumes that stock prices follow a geometric Brownian motion, which can exhibit oscillatory behavior under certain conditions. In fixed income markets, the Cox-Ingersoll-Ross (CIR) model for interest rates also incorporates mean reversion and stochastic volatility, leading to damped oscillatory dynamics.
By drawing on these analogies, we can better understand the technical aspects of the damping function in the BAERM and appreciate its effectiveness in modelling the complex dynamics of the Bitcoin market. The damping function captures both the periodic nature of market cycles and the attenuation of past events’ influence.
Conclusion
In this article, we explored the Bitcoin Auto-correlation Exchange Rate Model (BAERM), a novel 2-step linear regression model for understanding the Bitcoin USD exchange rate. We discussed the model’s components, their interpretations, and the fundamental insights they provide about Bitcoin exchange rate dynamics.
The BAERM’s ability to capture the fundamental properties of Bitcoin is particularly interesting. The framework underlying the model emphasises the importance of individuals’ subjective valuations and preferences in determining prices. The momentum term, which accounts for auto-correlation, is a testament to this idea, as it shows that historical price trends influence market participants’ expectations and valuations. This observation is consistent with the notion that the price of Bitcoin is determined by individuals’ preferences based on past information.
Furthermore, the BAERM incorporates the impact of Bitcoin’s supply dynamics on its price through the halving epoch terms. By acknowledging the significance of supply-side factors, the model reflects the principles of sound money. A limited supply of money, such as that of Bitcoin, maintains its value and purchasing power over time. The halving events, which reduce the block reward, play a crucial role in making Bitcoin increasingly scarce, thus reinforcing its attractiveness as a store of value and a medium of exchange.
The constant term in the model serves as the baseline for the model’s predictions and can be interpreted as an inherent value attributed to Bitcoin. This value emphasizes the significance of the underlying technology, network effects, and Bitcoin’s role as a medium of exchange, store of value, and unit of account. These aspects are all essential for a sound form of money, and the model’s ability to account for them further showcases its strength in capturing the fundamental properties of Bitcoin.
The BAERM offers a potential robust and well-founded methodology for understanding the Bitcoin USD exchange rate, taking into account the key factors that drive it from both supply and demand perspectives.
In conclusion, the Bitcoin Auto-correlation Exchange Rate Model provides a comprehensive fundamentally grounded and hopefully useful framework for understanding the Bitcoin USD exchange rate.

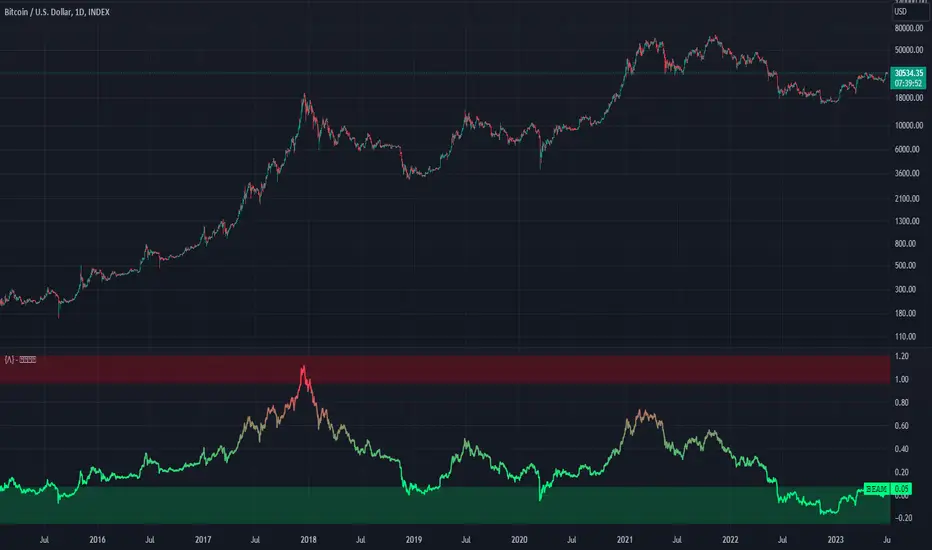
Bitcoin Economics Adaptive MultipleBEAM (Bitcoin Economics Adaptive Multiple) is an indicator that assesses the valuation of Bitcoin by dividing the current price of Bitcoin by a moving average of past prices. Its purpose is to provide insights into whether Bitcoin is under or overvalued at any given time. The thresholds for the buy and sell zones in BEAM are adjustable, allowing users to customize the indicator based on their preferences and trading strategies.
BEAM categorizes Bitcoin's valuation into two distinct zones: the green buy zone and the red sell zone.
Green Buy Zone:
The green buy zone in BEAM indicates that Bitcoin is potentially undervalued. Traders and investors may interpret this zone as a favorable buying opportunity. The threshold for the buy zone can be adjusted to suit individual preferences or trading strategies.
Red Sell Zone:
The red sell zone in BEAM suggests that Bitcoin is potentially overvalued. Traders and investors may consider selling their Bitcoin holdings during this zone to secure profits or manage risk. The threshold for the sell zone is adjustable, allowing users to adapt the indicator based on their trading preferences.
Methodology:
BEAM calculates the indicator value using the following formula:
beam = math.log(close / ta.sma(close, math.min(count, 1400))) / 2.5
The calculation involves taking the natural logarithm of the ratio between the current price of Bitcoin and a simple moving average of past prices. The moving average period used is a minimum of the specified count or 1400, providing a suitable historical reference for valuation assessment.
The resulting value of BEAM provides a standardized measure that can be compared across different time periods. By adjusting the thresholds for the buy and sell zones, users can customize BEAM to their preferred levels of undervaluation and overvaluation.
Utility:
BEAM serves as a tool for investors in the Bitcoin market, offering insights into Bitcoin's valuation and potential buying or selling opportunities. By monitoring BEAM, market participants can gauge whether Bitcoin is potentially undervalued or overvalued, helping them make informed decisions regarding their Bitcoin positions.
It is important to note that BEAM should be used in conjunction with other technical and fundamental analysis tools to validate signals and avoid relying solely on this indicator for trading decisions. Additionally, traders and investors are encouraged to adjust the threshold values based on their specific trading strategies, risk tolerance, and market conditions.
Credit: The BEAM (Bitcoin Economics Adaptive Multiple) indicator was originally developed by BitcoinEcon
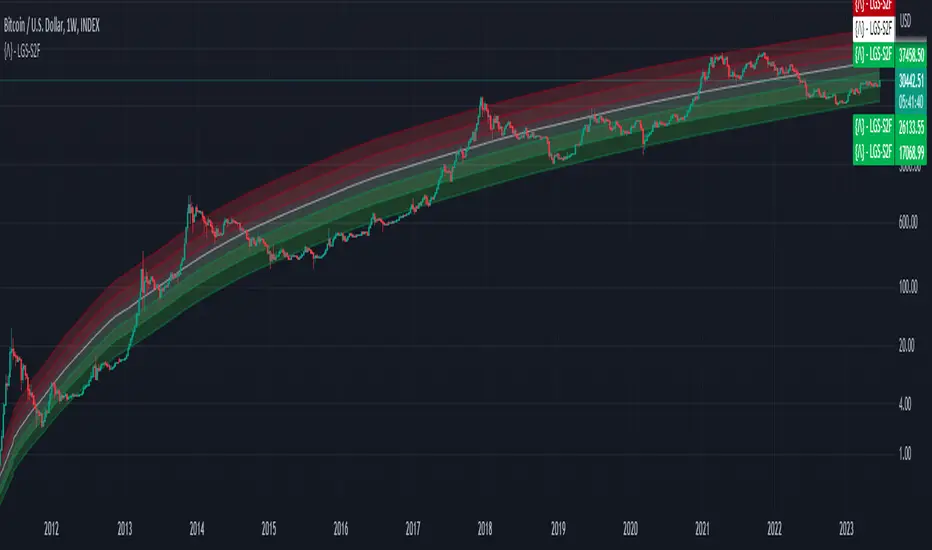
Bitcoin Limited Growth ModelThe Bitcoin Limeted Growth is a model proposed by QuantMario that offers an alternative approach to estimating Bitcoin's price based on the Stock-to-Flow (S2F) ratio. This model takes into account the limitations of the traditional S2F model and introduces refinements to enhance its analysis.
The S2F model is commonly used to analyze Bitcoin's price by considering the scarcity of the asset, measured by the stock (existing supply) relative to the flow (new supply). However, the LGS-S2F Bitcoin Price Formula recognizes the need for improvements and presents an updated perspective on Bitcoin's price dynamics.
Invalidation of the Normal S2F Model:
The normal S2F model has faced criticisms and challenges. One of the limitations is its assumption of a linear relationship between the S2F ratio and Bitcoin's price, overlooking potential nonlinearities and other market dynamics. Additionally, the normal S2F model does not account for external influences, such as market sentiment, regulatory developments, and technological advancements, which can significantly impact Bitcoin's price.
Addressing the Issues:
The LGS-S2F Bitcoin Price Formula introduces refinements to address the limitations of the traditional S2F model. These refinements aim to provide a more comprehensive analysis of Bitcoin's price dynamics:
Nonlinearity: The LGS-S2F model recognizes that the relationship between the S2F ratio and Bitcoin's price may not be linear. It incorporates a logistic growth function that considers the diminishing returns of scarcity and the saturation of market demand.
Data Analysis: The LGS-S2F model employs statistical analysis and data-driven techniques to validate its predictions. It leverages historical data and econometric modeling to support its analysis of Bitcoin's price.
Utility:
The LGS-S2F Bitcoin Price Formula offers insights for traders and investors in the cryptocurrency market. By incorporating a more refined approach to analyzing Bitcoin's price, this model provides an alternative perspective. It allows market participants to consider various factors beyond the S2F ratio alone, potentially aiding in their decision-making processes.
Key Features:
Adjustable Coefficients
Sigma calculation methods: Normal or Stdev
Credit:
The LGS-S2F Bitcoin Price Formula was developed by QuantMario, who has contributed to the field of cryptocurrency analysis through their research and modeling efforts.
USDT Inflow TrackerUSDT INFLOW TRACKER
What does this script do? It looks for important inflow from USDT and write it below or above your chart.
Does it matter? Yes because Tether with planned USDT inflow highly manipulate the crypto market.
With this simple script you can study what and when something strange is going to happen on your favourite token.
HOW IT WORKS?
Pretty simple. It just continuosly check USDT (and USDC) Market Cap and verify if the last candle is way higher than last one. If it was way higher than expected it plot a green square and write a note with the total Inflow of USDT in the crypto market (not specifcially for your token)
Now you can see when an important inflow is done and start to plan your entry and exit strategy in the crypto market.
AUTOSET
With Autoset you can rely on standard values
5min TF : Inflow greater than of 15 mln (in 1 candle)
30min TF : Inflow greater than of 150 mln (in 1 candle)
60min TF : Inflow greater than of 300 mln (in 1 candle)
1Day TF : Inflow greater than of 900 mln (in 1 candle)
So you can check your favourite coin in no time looking for a good trading position
MANUAL SETTINGS
Otherwise you can set directly your Inflow to track based on your needs.
In the example below I've set to check everytime an Inflow of 25mln USDT or greater was done.
As you can see it highly influence the relative token.

MVRV Z Score and MVRV Free Float Z-ScoreIMPORTANT: This script needs as much historic data as possible. Please run it on INDEX:BTCUSD , BNC:BLX or another chart of sufficient length.
MVRV
The MVRV (Market Value to Realised Value Ratio) simply divides bitcoins market cap by bitcoins realized market cap. This was previously impossible on Tradingview but has now been made possible thanks to Coinmetrics providing us with the realized market cap data.
In the free float version, the free float market cap is used instead of the regular market cap.
Z-Score
The MVRV Z-score divides the difference between Market cap and realized market cap by the historic standard deviation of the market cap.
Historically, this has been insanely accurate at detecting bitcoin tops and bottoms:
A Z-Score above 7 means bitcoin is vastly overpriced and at a local top.
A Z-Score below 0.1 means bitcoin is underpriced and at a local bottom.
In the free float version, the free float market cap is used instead of the regular market cap.
The Z-Score, also known as the standard score is hugely popular in a wide range of mathematical and statistical fields and is usually used to measure the number of standard deviations by which the value of a raw score is above or below the mean value of what is being observed or measured.
Credits
MVRV Z Score initially created by aweandwonder
MVRV initially created by Murad Mahmudov and David Puell

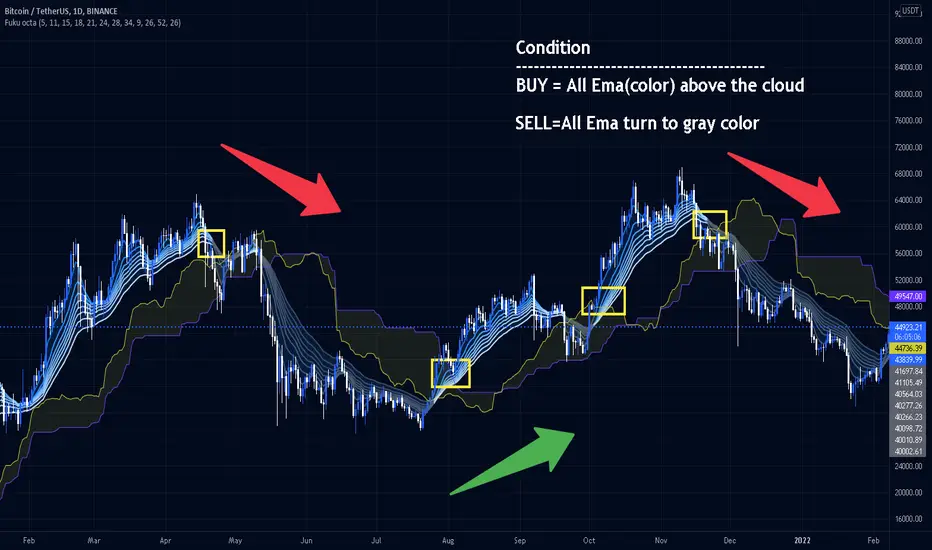
Fukuiz Octa-EMA + IchimokuThis indicator base on EMA of 8 different period and Ichimoku Cloud.
#A brief introduction to Ichimoku #
The Ichimoku Cloud is a collection of technical indicators that show support and resistance levels, as well as momentum and trend direction. It does this by taking multiple averages and plotting them on a chart. It also uses these figures to compute a “cloud” that attempts to forecast where the price may find support or resistance in the future.
#A brief introduction to EMA#
An exponential moving average (EMA) is a type of moving average (MA) that places a greater weight and significance on the most recent data points. The exponential moving average is also referred to as the exponentially weighted moving average. An exponentially weighted moving average reacts more significantly to recent price changes than a simple moving average (SMA), which applies an equal weight to all observations in the period.
I combine this together to help you reduce the false signals in Ichimoku.
#How to use#
EMA (Color) = Bullish trend
EMA (Gray) = Bearish trend
#Buy condition#
Buy = All Ema(color) above the cloud.
#Sell condition#
SELL= All Ema turn to gray color.
BTC Multi Exchange Perpetual PremiumThis script tracks the premium/discount of Bitcoin perpetual contracts at various exchanges.
The premium/discount is calculated against an index price. The index price is calculated from spot exchange prices and are weighted as follows:
Bitstamp:28,81%
Bittrex:5,5%
Coinbase: 38,07%
Gemini: 7,34%
Kraken: 20,28
The difference between this script and other available scripts, is that exciting script seems to only focus on one exchange. This script is also open source.

Bitcoin Comparison to GBTC!This script tells you if GBTC is overvalued or undervalued compared to Bitcoin.

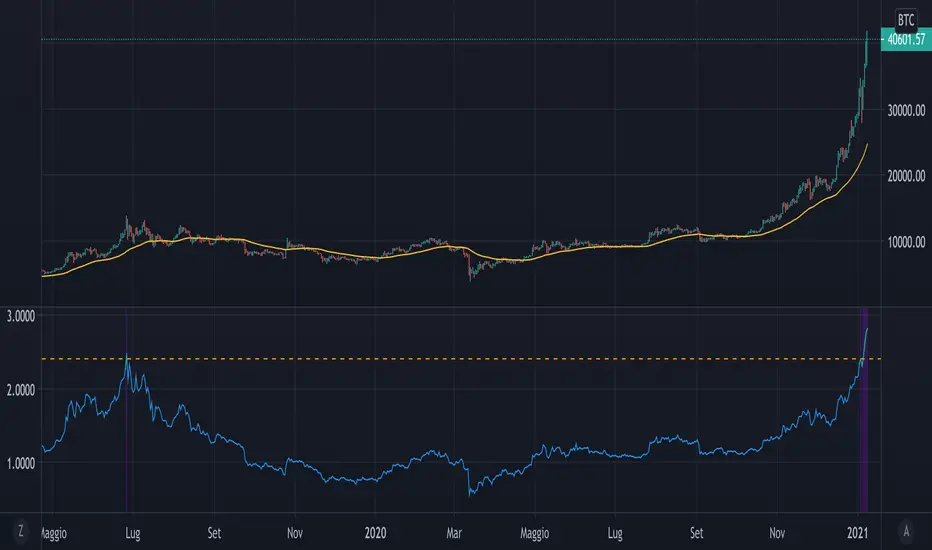
Mayer MultipleThe script implements a custom version of the Mayer multiple and it may be useful for analyzing the price of Bitcoin in a historical context.
Note n.1: Mayer multiple does not tell whether to buy, sell or hold, but highlights the best long-term area when the bitcoin price is below a threshold value (2.4).
Note n.2: the threshold value (2.4) has been determined in the past by simulations performed.
The script user may decide whether to use the shown graph or another graph for the calculation of the Mayer multiple.
The script is very easy to use and it is possible to change the following parameters:
the period of SMA (default value is 200)
the threshold (default value 2.4)
Show or not the sell area
Use or not the shown graph to calculate the Mayer multiple (default value is true)
name of exchange to use for calculation of the Mayer multiple (default value is BNC)
name of chart to use for calculation of the Mayer multiple (default value is BLX)
MAFIA CANDLESMafia Candles is a Exhaustion bar count and candle count indicator, Using the Leledc Candles and 1-3 counting candle play gives you a pretty good idea where a so called "top" will be or a so called "bottom" will be!
In this example, getting the transparent round circles ( either lime or red ) would mean that the move will be a good size move!
EXAMPLE=1 You see a down trend and then the Mafia Candles Flashes a Green Dot on the forming new red candle. This is where in theory you might want to consider going long on the market!
EXAMPLE=2 If you see a RED $ symbol, after a uptrend, this means in theory, there might be room for a short play or room for a small pullback in the price!
THE CIRCLES(RED OR LIME COLORED) ARE INDICATING BIGGER MOVES!
THE $ SYMBOLS (RED OR LIME COLORED) ARE INDICATING SMALLER PULLBACKS OR SMALLER PUMPS IN PRICE!
RED IS CONSIDERED TO BE A SELL!
LIME COLOR IS CONSIDERED TO BE A BUY!
AS MUCH IS BASED OF THE 1-3 CANDLE COUNT AND THE LEDLEC CANDLE DEVIATION STRATEGY, LET ME EXPLAIN THE THEORY ON BOTH THE 1-3 CANDLE COUNT AND THE LELEDC STRATEGY I COMBINE TO BRING YOU THIS ADDITION OF THE INDICATOR....
LELEDC THEORY USAGE...
An Exhaustion Bar is a bar which signals
the exhaustion of the trend in the current direction. In other words an
exhaustion bar is “A bar of last seller” in case of a downtrend and “A bar of
last buyer”in case of an uptrend.
Having said that when a party cannot take the price further in their direction,naturally the other party comes in , takes charge and reverses the direction of the trend.
TO EASIER UNDERSTAND I GIVE YOU A EASY EXAMPLE OF WHAT AN LELEDC EXHAUSTION BAR IS...
1. A wide range bar ( a bar with
long body!!!).
2. A long wick at the bottom of
the bar and no or negligible wick at the top of the bar in case of “Bear exhaustion bar” and
a long wick at the top and no or
negligible wick at the bottom of the bar in case of
“Bull exhuation bar”!!!
3. Extreme volume and.....
4. Bar forming at a key support or resistance
area including a Round Number (RN) and Big Round Number ( BRN ).THE PSYCHOLOGY BEHIND THIS!!!
Now let's assume that we have a group
of people,say 100 people who decides to go for a casual running. After running for few KM's few of
them will say “I am exhausted. I cannot run further”. They will quit running.
After running further, another bunch of runners will say “I am exhausted. I can’t run
further” and they also will quit running.
This goes on and on and then there will be a stage where only few will be left in the running. Now a stage will come where the last person left in the running will say “I
am exhausted” and he stops running. That means no one is left now in the
running.This means all are exhausted in the running.
The same way an exhaustion bar works and if we can figure out that
exhaustion bar with all the tools available on hand, we will be in a big trade
for sure!!.The reason is an exhaustion bar is formed at exact tops and bottoms most of the times.In forex with wide variety of pairs available at the counter ,one can trade this technique to make lifetime gains.
NOW LET ME EXPLAIN THE 1-3 CANDLE CORRECTION COUNT THEORY WHICH IS USED TO GET THE SUM UP SIGNALS FROM THIS INDICATOR FROM ITS INPUT LEVELS!!!
1-3 CANDLES....
The 1-3 Candlestick pattern is basically like sequential, aka a candle counting system!
1-3 CANDLE COUNT means you count the number of bullish=green candles or the bearish=red candles!
3 BULL/GREEN CANDLES in a row, each closing its close higher than the previous one before it is the 1-3 candle top count idea!
lets say you get 3 red bear candles, each candle after the first closes its body below the previous red candle before it, then you see 3 red candles with each closing lower bodies lower than the previous candle, THATS A POSSIBLE SIGN OF BEARISH EXHAUSTION, AND YOU MIGHT HAVE SOME BULLS STEP IN TO TAKE THE PRICE UP AFTER THE IMMEDIATE DOWNFALL OF THOSE 3 RED CANDLES!!
PLEASE IF ANYONE HAS QUESTIONS OR NEEDS ANY FURTHER EXPLANATION, DONT HESISITATE TO MESSAGE ME! CHALRES KNIGHT IS THE ORIGINAL AUTHOR OF THE 1-3 CANDLE COUNT AND THE LELEDC EXHAUSTION BAR INDICATOR ON METE-TRADER! R.IP CHARLES F KNIGHT!!! WE LOVE YOU AND MISS YOU BROTHER!
CHARLES KNIGHT PASSED DOWN ALL OF HIS INDICATORS AND SCRIPTS IN ORIGINAL CODE TO MYSELF WHEN HE PASSED AWAY AND I WILL CONTINUE TO HONOR HIS MEMORY BY ENHANCING HIS ORIGINAL SOURCE CODED SCRIPTS TO ENHANCE THE LIFE FOR ALL TRADERS!
CHARLIE LOVED WHEN I WOULD PUT MY OWN SWING ON HIS INDICATORS! HE TAUGHT ME EVERYTHING I KNOW AND I KNOW ONE DAY I WILL SEE HIM AGAIN!
TRADE IN PARADISE CHARLIE!!!
THE BEST TRADER IN THE WORLD!!!
