Abnormal bar % v.1This script helps you find abnormal bars on the charts.
An abnormal bar is a bar that is larger than the adjacent bar by at least 50 percent.
The script can search for bars on any time frame.
The search for an abnormal bar, is possible in two ways:
- on the absolute value, for example - all that is higher than 0.5% is considered an abnormal bar, on different timeframes it is necessary to change the percentage values;
- on the basis of the ATR, in my opinion it is a more objective result.
In the settings available:
- choice of color to display percentages on the screen;
- choice of calculation method;
- Selecting the value - what is considered an abnormal bar.
======
Данный скрипт помогает найти на графиках аномальные бары.
Аномальный бар - это бар который, больше рядом стоящего бара как минимум на 50 процентов.
Скрипт может искать бары на любом тайм-фрейма.
Поиск аномального бара, возможен в двух вариантах:
- по абсолютному значению, например - всё что выше 0.5%, считается аномальным баром, на разных тайм-фреймах нужно менять значения процентов;
- на основание ATR, на мой взгляд это более объективный результат.
В настройках доступно:
- выбор цвета для отображения процентов на экране;
- выбор способа поиска;
- выбор значения - что считаем аномальным баром.
==
BAR

Strategy Myth-Busting #10 - InsideBar+EMA - [MYN]This is part of a new series we are calling "Strategy Myth-Busting" where we take open public manual trading strategies and automate them. The goal is to not only validate the authenticity of the claims but to provide an automated version for traders who wish to trade autonomously.
Our 10th one we are automating is the " 75% Win Rate High Profit Inside Bar Trading Strategy - What If You ... " strategy from " Trade Pro " who claims to have backtested this manually and achieved 11,063% profit with a 75% winrate over 100 trades. I was unable to emulate these results consistently accommodating for slippage and commission but even so, the results look promising. I was only able to achieve this win-rate with some multiple take profit staggering. Even so the markdown is above where I would normally consider comfortable (>20%).
If you know of or have a strategy you want to see myth-busted or just have an idea for one, please feel free to message me.
This strategy uses a combination of 2 open-source public indicators:
Inside Bar Ind/Alert by CMA
EMA (built-in)
Trading Rules
4 hour candles
Stop Loss at EMA Line with TP Target 1.5x the risk
Long Entry when these conditions are true
inside bar and bullish
Bar close's above 50 ema
Price action rises above high of inside bar .
Short Entry when these conditions are true
inside bar and bearish
Bar close below 50 ema
Price action falls below low of inside bar

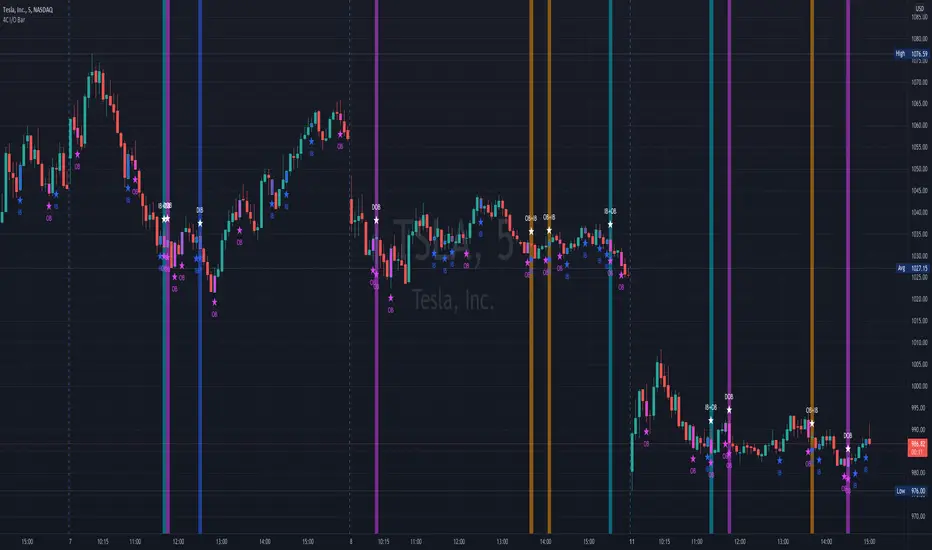
Wall St. Cheat SheetThis is my best attempt to recreate the famous Wall St. Cheat Sheet BAR/CANDLE Colors. There is a lot of exotic math, oscillators, and other underlying functions that help determine the appropriate colors based on emotional sentiment.
There are some new colors like Purple that help to represent fractal patterns.
White candles help to show over-bought and over-sold conditions.

[SS]Multicolor BB with Squeez Moving Average & Colored BarsHello Followers,
Hope u guyz doing well in the market.
Came with a standalone Trading System which helps u with the trend & choppiness zone.
This system is combination of multiple stretagies which makes it better than single published indicators.
=========================================================================================================
We have used Variety-Filtered, Squeeze Moving Averages which is a chop zone indicator that identifies when price is below a specific volatility threshold calculated as the difference between a fast and slow moving average and filtered using ATR- or Pips-based threshold. This indicator can be use as both an entry and exit indicator. It identifies both chop zones and breakouts/breakdowns
Uses:-
When the candles turn white and the threshold bands appear on the chart, this is indicative of low volatility
When price exits the threshold bands, price will usually explode up or down giving a long or short signal. This acts as a sort of squeeze momentum.
Included:
Bar coloring
Signals
Alerts, 4 types of alerts: Squeeze started, Squeeze ended, long, and short
<<------------------------------------->>
Multicolour Bollinger Bands indicator that indicates market phases.
It plots on the price chart, thanks to different color zones between the bands, a breakdown of the different phases that the price operates during a trend.
The different zones are identified as follows:
- red color zone: trend is bearish , price is below the 200 periods moving average
--> orange color zone: price operate a technical rebound below the 200 periods moving average
- yellow color zone: (phase 1 which indicate a new bearish cycle)
- light green zone: (phase 2 which indicate a new bullish cycle)
--> dark green zone: trend is bullish , price is above the 200 periods moving average
- grey color zone: calm phase of price/low volatility
- dark blue color zone: price is consolidating in either bullish or bearish trend
- light blue zones: price will revert to a new opposite trend (either long or short new trend)
By identifying clearly the different market phases with the multicolor Bollinger bands , the market entries by either a the beginning of a new trend or just after a rebound or a consolidating phase is easier to spot on.
<<==========================>>
The credit of above indicator souce goes to loxx & Deveatt. I just backtested and modified it to increase accuracy of trade and clear visual representation for trades.
Modified the trend based SMA and BB period and entry criteria.
<<===========================>>
<>
1) Look for BB COLOR and SMA for trend either up or down.
2) Look Bar coloring, enter when price above sma and green for long else short.

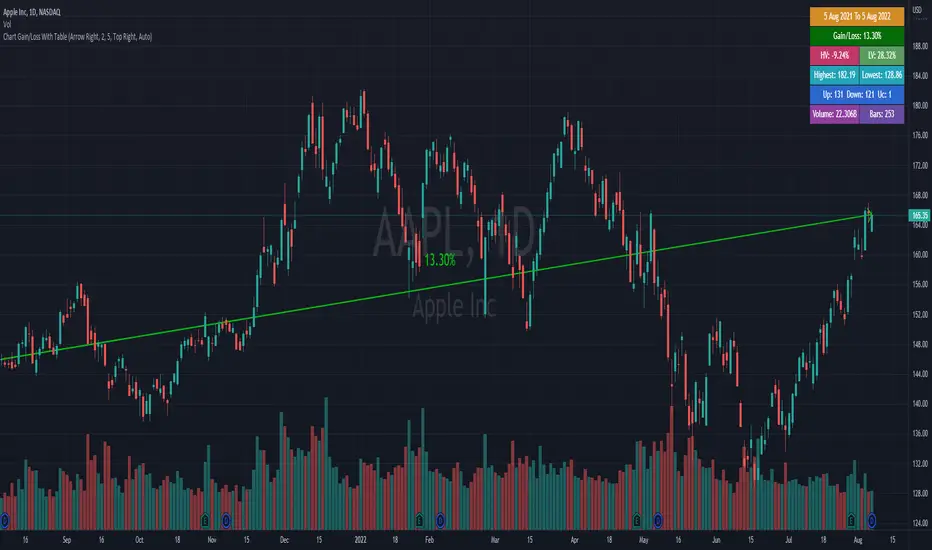
Chart Gain Or Loss With TableThis indicator auto calculate the first visible bar to the last visible bar
1. Gain or loss in percentage
2. Highest price
3. Lowest price
4. Total up bar
5. Total down bar
6. Total unchanged bar
7. Total bar
8. Total volume
*This indicator is not working on this page, you must add it in to your chart.
Chervolinos_Rob Hoffman_Inventory Retracement Bar_and_OverlayHere is something like a combo from the well known Rob Hoffman (Overlay) Indicator and the Inventory Retracement Bar without any ballast
This really smart strategy with a low risk and a quick profit. I combine this two Indicators to save space.
The first condition is that the orange line and the lime line must be parallel and there is no other line between them because this condition is moving under 45 angle.
The second condition is that the target candles must be below the orange line in the case of the downtrend as we see.
As we see it here in the case of an uptrend should be candles above the orange line and this is logical as we see here.
Sometimes we noticed the appearance of the signal onto the candle but the conditions were not applicable because there is an orange line between the green line and the orange line and this means that the signal is fake.
This candle is also good for entry and we can place a buy order above it but is it beginner, so you must respect the conditions in order to be able to master it very well.
Enter with Confidence all conditions are present a red arrow above the candle and the candle is above the orange line and there are no lines between the lime and
orange line. Yes this is our target the entry-point will be a little above the wicked the candle, that is you will not buy now but it's a price exceeds the weight limit
even slightly, we will buy directly it is hoffman's method. Expected if the price in which resistance occurred which is the resistance represented
by the candlewick will be broken the price for rise up and strongly and if it does not happen you will not lose anything anyway to stop loss and take profit. Try the ratio by 1,5.
This part of this strategy is one of the best trading strategies with a low risk rate and can be used as an initial guide to know the market movement and to enter successful trades.
Let's start correctly. This strategy can be used on any time frame from one minute to one day or even more, but I recommend using it on a 10-minute frame one hour or 30 minutes frame. Here I use the 30-Minute frame.
This strategy is based on two things: Tramp Direction and the inventory retracement bar. Don't worry and don't think about it because all this will be automatic but let's understand some simple terms.
There many arrows in green and red. Please read the discription above.
Please read the following tipps:
To avoid the trend Reversal, try to add one one of the Divergence indicators to your chart.
To avoid entering in a pullback movement as much as possible.
--> Combine it with other indicators <--
Best Regards Chervolino
if there were any typographical errors, please forgive me
Note: Buy/Sell signals using non-standard chart types (Heikin Ashi, Renko, Kagi, Point & Figure, and Range) are not allowed, as they produce unrealistic results

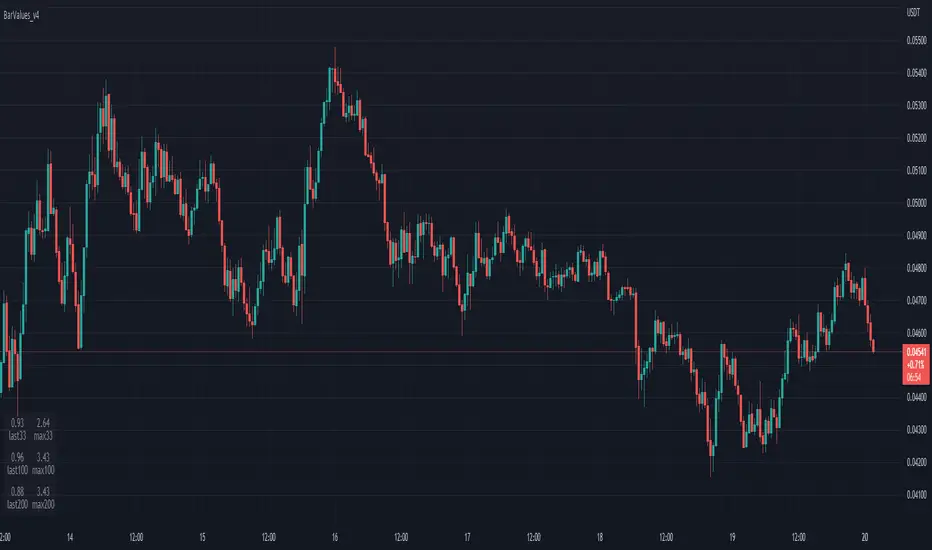
TableBarValues_v4It give you the absolute value of bar changes for different period of tims (33, 100, 200) AND the max barchange ont the same period.
Can be added in v4 in all codes. Stupid but useful.
You can add it to any v4 script. The location of the table can be changed easily
Inspired from the tradingview community. Don't forget to hydrate. @Magnumm
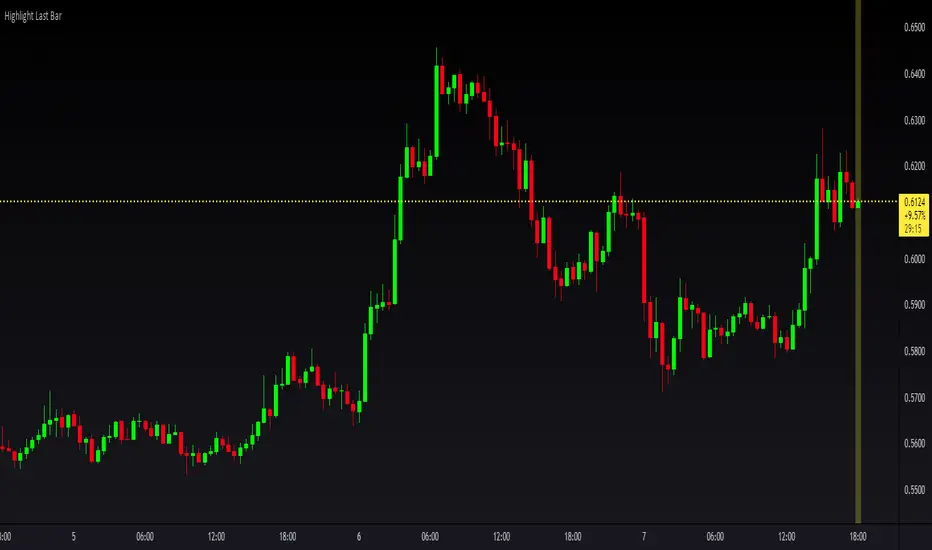
Highlight last bar, work on all timeframe, v4 & v5 @magnummHighlight last bar only. No refresh needed.
Works on all time frame and for version 4 & 5.
Can be added in your own scripts copy/pasting just one line.
//DON'T FORGET TO HYDRATE
4C Inside/Outside BarThis indicator colors the candle body based on whether it closed as an Inside Bar (IB) or an Outside Bar (OB).
Inside and outside bars can be powerful triggers to enter or exit trades from, when price breaks above or below the candle.
The coloring of only the body and not the border of the candle makes it possible to still know whether the candle was bullish/bearish.
This indicator has the unique ability to add/hide labels for each IB and OB.
Small labels are printed on the chart directly below the candle. (See below)
It also has the unique ability to paint the chart background when an IB forms directly after an OB.
This is a special combination of the two, and can also be a powerful signal.
This feature can be turned on/off. (See below)
Thanks to Craig Stine, as some parts of this indicator were adapted from Custom Candle color Inside/Outside candles, Highwave, Star Patt. by Craig_Stine
Session Bar CountingIf you follow Al Brooks - he has a bar counting overlay from the start of the session.
The timing is set to Trading View - EXCHANGE TIME - so customise the start of the session you like.
Enjoy!

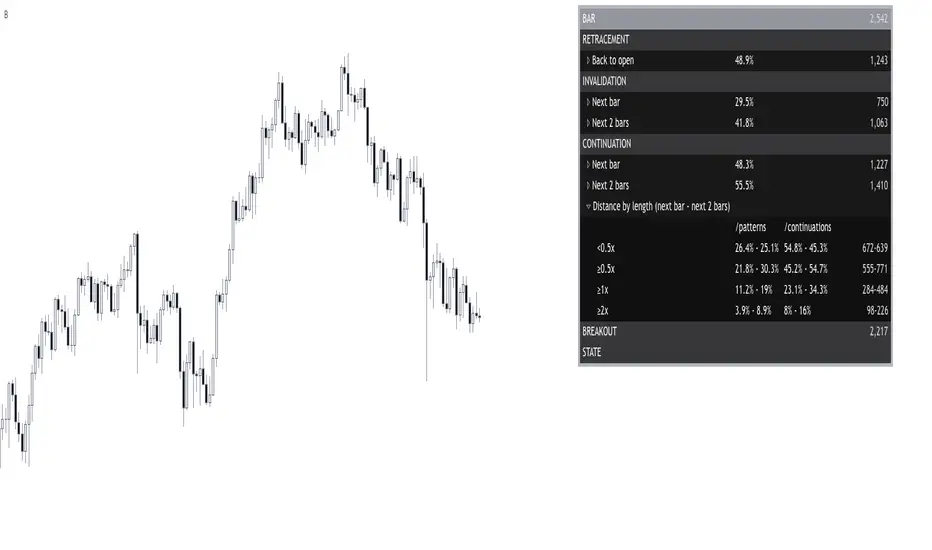
Bar█ OVERVIEW
This indicator demonstrates how we can use Pine script for collecting data to study the market.
By building a statistical report based on the chart candlestick analysis, discover if there is an edge or not, when and where?
Compare it with a specific candlestick pattern and know how its behavior diverges. I have already covered some here .
I hope it can bring you ideas for researching new edges, testing, and trying new things.
█ FEATURES
Sections
The report organizes the data into the following sections: retracement , invalidation , continuation , breakout , and state . Each of them provides insights into the price behavior and answers to questions such as: How often does price retrace? Does the pattern often invalidate? If it does not, does it break in the pattern's direction? How far does the price go? What are the odds of a false breakout? What is the likelihood of the next bar being a down candle?
Highlighter
The indicator highlights flat bars (open and close at the same price). It also highlights bullish and bearish bars once a filter is applied.
Settings
Filtering of bars closing beyond their prior bar’s high and low;
Filtering of reversal bars (two modes available);
Displaying distances relative to the bars length or Average True Range;
Collapsing/expanding each section;
Changing the report’s coloring and positioning;
█ NOTES
Computation
The script computation occurs on bar close.
Distances in ATR
When using a period of 20, for example, the first 19 candles are ignored because the ATR is not defined yet.
Plot Real Open and Close - SamXI built this indicator as a personal request from a friend. He often trades using Heiken Ashi charts, but wanted a way to easily cross-reference real-price open and close values for the same timeframe on the same chart (as HA candles are by design lagging, they can take a few periods to catch up to a large move). This can also be used to help guide support and resistance zones using real-price data points should you so choose.
There are 2 major ways to configure this indicator to display real-price open and close:
As a Bar or Hollow Candle style chart overlay
As on-chart shapes (allowing individual control over which data to show - open, close, or both)

SessionInfoLibrary "SessionInfo"
Utility functions for session specific information like the bar index of the session.
inSession(spec) Returns true if the current bar is in the session specification.
Parameters:
spec : session.regular (default), session.extended or other time spec.
Returns: True if the current is in session; otherwise false.
minutesToLen(minutes, multiple) Converts the number of minutes to a length to be used with indicators.
Parameters:
minutes : The number of minutes.
multiple : The length multiplier.
Returns: math.ceil(minutes * multiple / timeframe.multiplier)
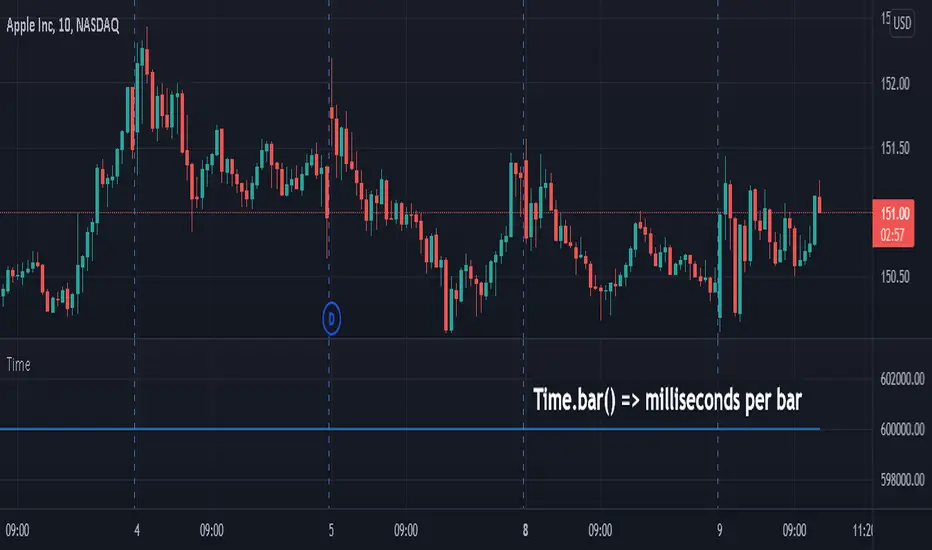
bar(spec, res) Returns the intraday bar index. May not always map directly to time as a bars can be skipped.
Parameters:
spec : session.regular (default), session.extended or other time spec.
res : The resolution (default = "1440").
Returns: The integer index of the bar of the session.
isFirstBar(spec, res) Returns true if the current bar is the first one of the session.
Parameters:
spec : session.regular (default), session.extended or other time spec.
res : The resolution (default = "1440").
Returns: True if the current bar is the first one of the session.
wasLastBar(spec, res) Returns Returns true if the previous bar was the last of the session.
Parameters:
spec : session.regular (default), session.extended or other time spec.
res : The resolution (default = "1440").
Returns: True if was the last bar of the session.

LabelHelperLibrary "LabelHelper"
Utility for managing active labels on the chart.
add(level, txt, labelColor, textColor) For displaying a lable at the last bar.
Parameters:
level : The value to display the label at.
txt : The text to show on the label.
labelColor : The color of the label.
textColor : The text color of the label.
Returns: The label being managed.

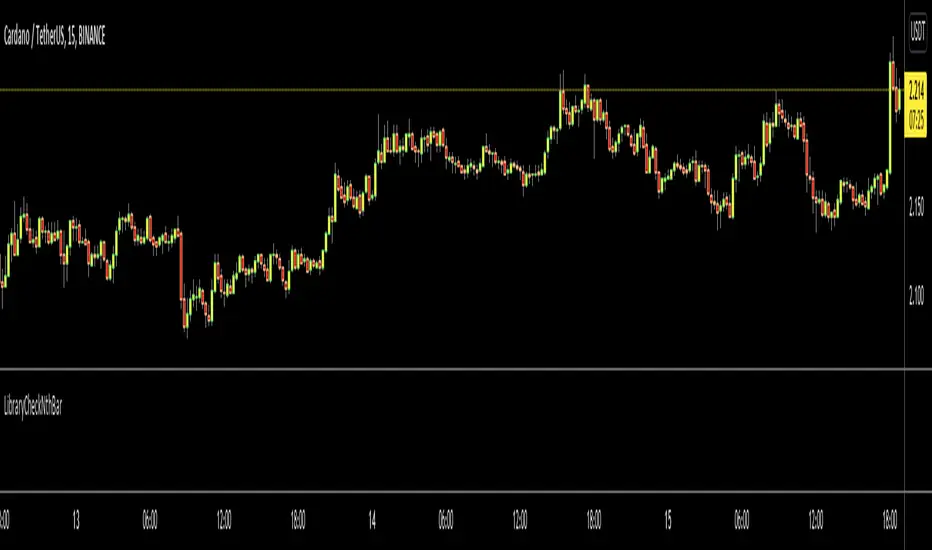
LibraryCheckNthBarLibrary "LibraryCheckNthBar"
TODO: add library description here
canwestart(UTC, prd) this function can be used if current bar is in last Nth bar
Parameters:
UTC : is UTC of the chart
prd : is the length of last Nth bar
Returns: true if the current bar is in N bar
Zendog Bar PercentageThis script will add text to bars showing the price change of the bar as a percentage, both for open/close and high/low.
It can be used together with Rate of Change to better get an idea of how the price moved at a previous point in time.
Script uses labels for text, as there is a maximum limit of 500 labels if you want to study price movement for a specific timeframe, you can limit the timeframe from the script settings. Keep in mind that labels are applied to the last 500 candles of any timeframe.
Script also displays statistics for max changes in the selected time period, for both green and red candles both as percentage and base currency absolute value.
Uses:
- Study the behavior of an asset under previous market conditions, black swan events a.s.o.
- Calculate leverage position risk versus extreme price movements
Example: ZENUSDT pumped ~35% on 15 Sep 2021 in the first seconds after the news on getting listed on Coinbase so shorts with 3x leverage would have been liquidated.

Bar StatisticsThis script calculates and displays some bar statistics.
For the bar length statistics, it takes every length of upper or lower movements and calculates their average (with SD), median, and max. That way, you can see whether there is a bias in the market or not.
Eg.: If for 10 bars, the market moved 2 up, then 1 down, then 3 up, then 2 down, and 2 up, the average up bars length would be at 2.33, while the average for the down length would be at 1.5, showing that upper movements last longer than down movements.
For the range statistics, it takes the true range of each bar and calculates where the close of the bar is in relation to the true low of it. So if the closing of the bar is at 10.0, the low is at 9.0, and the high is at 10.2, the candle closed in the upper third of the bar. This process is calculated for every bar and for both closing prices and open prices. It is very useful to locate biasses, and they can you a better view of the market, since for most of the time a bar will open on an extreme and close on another extreme.
Eg.: Here on the DJI, we can see that for most of the time, a month opens at the lower third (near the low) and closes at the upper third (near the high). We can also see that it is very difficult for a month to open or close on the middle of the candle, showing how important the first and the last day are for determining the trend of the rest of the month.

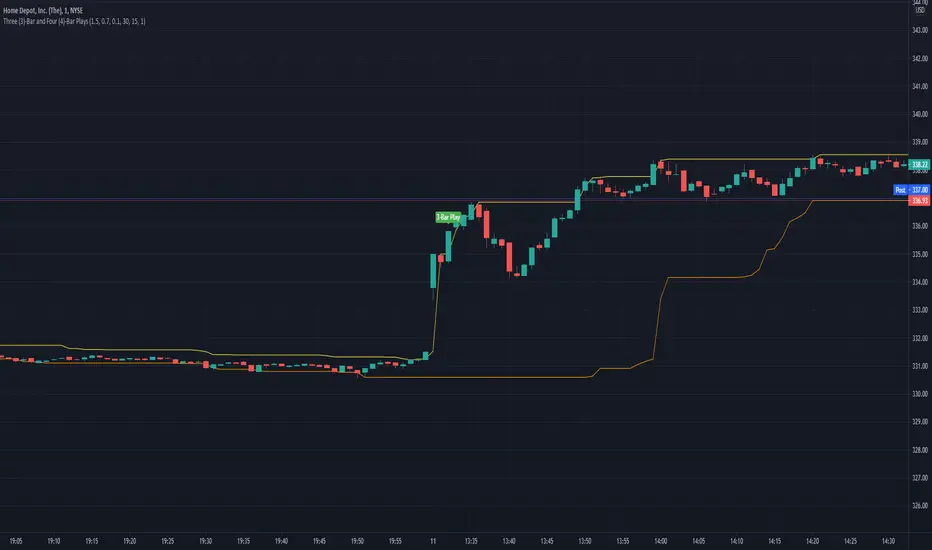
Three (3)-Bar and Four (4)-Bar Plays StrategyThis strategy analyzes the three and four-bar play which is when price action has a wide igniting bar that has a full body, then one or two narrow bars which have a relatively equal high for long plays and relatively equal low for short plays, then a continuation bar. You should not take plays that will encounter resistance. The stop loss is placed for long plays below the 2nd bar (or 3rd bar for 4-bar play).
This is commonly used on 1m, 2m, 5m, and 10m charts.
Jared Wesley is one of the more notable traders that use this setup. You can edit as an input the start date, end date, igniting bar size, the body percentage of the igniting bar, the relative equality of the 2nd bar (and 3rd bar for 4-bar play) compared to the igniting bar, and profit multiplier.

Three (3)-Bar and Four (4)-Bar PlaysThis indicator shows the three and four-bar play which is when price action has a wide igniting bar that has a full body, then one or two narrow bars which have a relatively equal high for long plays and relatively equal low for short plays, then a continuation bar. You should not take plays that will encounter resistance.
Jared Wesley is one of the more notable traders that use this setup. There will be a label placed on the chart when a play occurs. You can edit as an input the igniting bar size, the body percentage of the igniting bar, and the relative equality of the 2nd (and 3rd bar for 4 bar play) compared to the igniting bar.
candle countsmall script for count bar ...it count bar from open of day till end of day ...
in lower time its deleting candle count because of tradingview label limit 50
. bar counting it help me to teach trader bar by bar ...some of bar in all world chart are very important ..in al brook sir book and his website he marked many imortant bar no
for reference al brook sir said about bar counting method
the highest probability trade was the one that I said. When bar 62 was happening, I said, “Traders are buying,” you know, “I’m buying, it’s going up,” right? So 62 is the highest probability trade, but that does not mean it’s the easiest trade. It just means the probability that we’re going to get some kind of a measured move out of 62 is very high, probably 70 percent.
thanks to stack overflow that code is ans there
in this script many people help me thanks to @HappyBaby86 and @Kjaerbye#7503
sorry my english is not good.my native language is Hindi ..

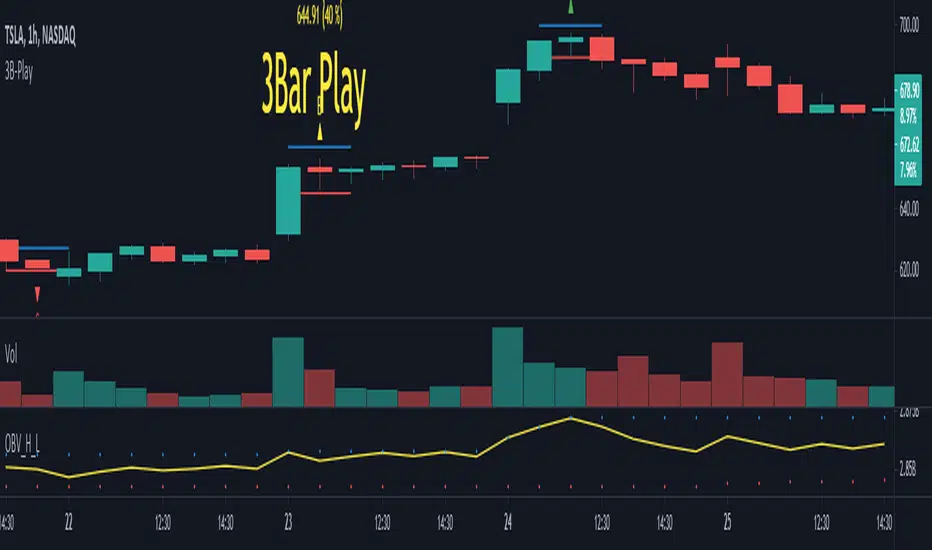
3B-Play Finder1 - Objective
2 - How to use (Theory)
3 - How to use (Grade System)
4 - Inputs
5 - Extras and Alerts
6 - Notes
Objective
This script aims to mark 3 Bar play patterns (both short and long) by identifying them on the chart, with an arrow pointing up from long and down for short. Aswell, setting alerts based on grade.
Following the base concept, this script comes with a "grade" system (A, B, C), which aims to classify 3B-Play according to input parameters.
2 - How to use (Theory)
The pattern is described by a wide range Ignite bar followed by a narrow resting bar.
Long
Given a 3 Bar play pattern, with a wide range green bar, the entry point should be above the ignite and narrow bar wicks (high) with stop loss set below the resting bar wick low but within ignite wide range bar.
The exit depends on the chart analysis, and there is no set rule for it.
Short
Similar to long but is with a wide range red bar and entry is defined on wick low and stop-loss at wick high.
3 - How to use (Grade System)
Since 3B-play come in all sort of shapes, some are "textbook" perfect, others a bit more "loose". I set a grading system, to differentiate each one.
The way the 3 Bar play quality is determined is based on the percentage size of the resting bar in relation to igniting bar size, starting from de close. An example of how this works is the following. Note: enabling the extra draws lines helps visually to adjust the grades to your preference.
4 - Inputs
3B Quality section
Enable/disable each grade.
CONTROL LONG / SHORT
Set the percentage values for each grade.
Extras
Enable/Disable extra plots.
5 - Extras and Alerts
This script comes with an extra section, enabling it, draws lines on the max and min values, as well, showing the values in text and the set percentage.
Also, you can set alerts based on the grade and short/long, note you should set the alert to bar close to avoid pre-trigger warnings.
6 - Notes
The script can be shorted a lot, by only looking for a single 3 bar play, to less than 30 lines.
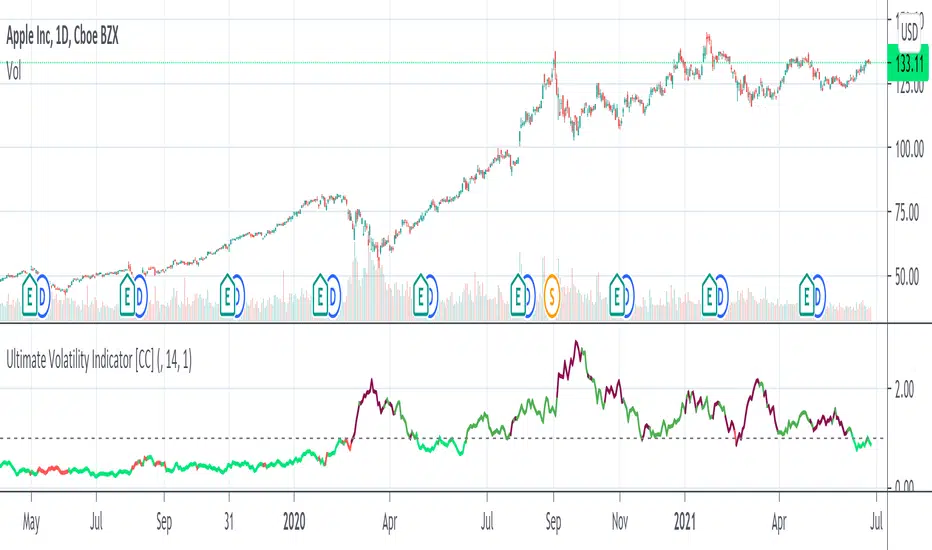
Ultimate Volatility Indicator [CC]The Ultimate Volatility Indicator was created by Richard Poster (Stocks and Commodities July 2021 pg 21) and this is a very simple but effective indicator. The idea behind volatility indicators is that when the indicator rises above a certain threshold then volatility is high enough and you can make a good amount of money riding the trend in the current direction and then exit when volatility drops below the threshold or until the underlying trend changes.
I have included a threshold that you can change from the default but I would recommend trying out different values to see what works best for you. This indicator will let you know as soon as volatility increases and reacts very quickly. I have included strong buy and sell signals in addition to normal ones so darker colors are strong buy and sell signals and lighter colors are normal signals. Buy when the line turns green and sell when it turns red.
Please let me know if you would like to see me publish any other indicators!