VWAP For NIFTY & BANKNIFTY [Zero54]NIFTY and BANKNIFTY Being Index do not have VWAP (because there is no volume generated). This is a simple script that displays NIFTY's future VWAP on NIFTY's Spot chart and similarly, displays BANKNIFTY's future VWAP on BANKNIFTY's sport chart. Fast and quick. Just few lines of code. No hefty un-necessary calculations.
No settings necessary. The script automatically detects NIFTY and BANKNIFTY and displays the corresponding VWAP.
Enjoy and share the knowledge. If you love this script, please boost/love this script and add a comment. Cheers!
NSE:NIFTY
NSE:BANKNIFTY
BANKNIFTY
IPB_PBOThis indicator is called Indian Pivot Boss _ Pivot Based Oscillator.
This is an oscillator based on pivot level of each candle. It is based on the concept outlined in the Secrets of Pivot Boss book.
It is the average of mutual differences between fast moving average, medium moving average and slow moving average of the candle pivots. This is then plotted as an oscillator.
When Pivot based oscillator is sloping upwards, it is suggested NOT TO STAY ON THE SHORT SIDE. Staying long side or Keeping quiet are the desirable options.
When Pivot based oscillator is sloping downwards, it is suggested NOT TO STAY ON THE LONG SIDE. Staying short side or Keeping quiet are the desirable options.
This indicator has to be used in conjunction with other indicators and should not be relied on a solo basis.

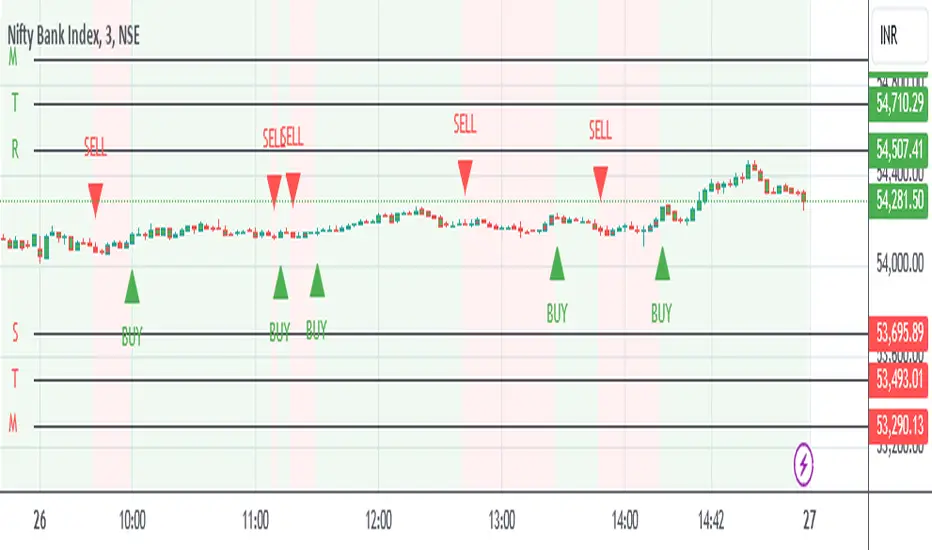
Banknifty BrahmāstraBanknifty Brahmastra Indicator is a Basic Simulating Indicator.
This indicator is built for capturing trend using average to plot buy / sell signal on chart.
Banknifty Brahmastra Indicator integrates visual labels to easily interpret signal for common people.
This indicator is also provide simple color code while trend continuations into candle colour along with background colour for confronts with trading decisions.
This basic indicator can use as an entry / exit reference points into complex strategies.
This Indicator can be used for any stocks and indexes but Indian traders can use this for especially into bank nifty futures & options to get maximum positive result decisions.
Supply and Demand MultiTimeFrameWhat Is the Law of Supply and Demand?
The law of supply and demand is a theory that explains the interaction between the sellers of a resource and the buyers for that resource . The theory defines the relationship between the price of a given good or product and the willingness of people to either buy or sell it. Generally, as price increases, people are willing to supply more and demand less and vice versa when the price falls. ( -Investopedia )
This Indicator Help's you to find possible Supply and Demand zones formed on chart on MultiTimeFrame.
All the Supply Zones are colored RED and are above the current price. It will vanish once price crosses over it.
All the Demand Zones are colored GREEN and are below the current price. It will vanish once price crosses under it.
Only Untested Zone are plotted on chart.
These zones can be plotted on Chart TimeFrame as well as MultiTimeFrame(Higher). That can be selected from Input Section.
Concept Behind the Zones
1. Rally Base Rally
2. Drop Base Drop
3. Drop Base Rally
4. Rally Base Drop
Drop base rally
Rally base drop
rally base rally
drop base drop
For Supply zones we try to find "Drop Base Drop" and "Rally Base Drop" , and plot RED zones on the width of base. Base can include any number of candle ranging from 1 to 6. This can be controlled from Input Section
For Demand zones we try to find "Rally Base Rally" and "Drop Base Rally" , and plot GREEN zones on the width of base. Base can include any number of candle ranging from 1 to 6. This can be controlled from Input Section
How to Trade
We recommend to use 5-8 time Higher TimeFrame as Supply and Demand Zones. For Example if chart is at 5 min Timeframe then Zones should be plotted on 25 min to 40 min TImeframe.
And when Price reaches closer to Supply/ Demand Zone then use some other indicator to confirm the reversal from that level, like trendline , moving average etc.
Targets should be nearest Supply/ Demand Zone .

IPB_JPMUPS_2022Introduction :
This indicator serves two purposes
a) It is a multi dimensional floor pivot indicator, which takes its concepts from Secrets of Pivot Boss book of Frank Ochoa. Most of the indicators suggested in the book are packed in one indicator.
b) It also has an inbuilt intraday strategy which identifies trend, direction and momentum based on CPR (Central Pivot Range) concepts and accordingly comes up with trading signals.
How this indicator is different from the published ones :
A). Role as an indicator
This indicator has all the CPR (Central Pivot Range) indicators packed together which provides a ready made solution for CPR based trading. The following are the salient features of this indicator :
1) This indicator plots daily CPR using previous day high, low and close. It also plots Support and Resistance levels based on floor pivots formula.
Moreover, it also plots developing CPR which is based on current day's high, low and close. Apart from that it also plots CPR for next day session as well which is useful for EOD analysis.
2) This indicator plots weekly CPR using previous week high, low and close. It also plots developing CPR which is based on current week's high, low and close.
3) This indicator plots monthly CPR using previous month high, low and close. It also plots developing CPR which is based on current month's high, low and close.
4) This indicator plots pivot EMA which is called PEMA. It uses three different EMAs which are customisable and uses them to plot a moving average web based on pivot points of each candle, which is called as PEMA. This also facilitates PEMA plotting for higher time frame (daily time frame) as well.
5) This indicator plots daily time frame moving average in intraday chart which can be used as a key zone during trading. The period is customisable.
B) Role as a strategy
This indicator also functions as an intraday trading strategy called JPMUPS (JP stands for author's nickname. MUPS stands for Manoj Ultimate Pivot Strategy). This strategy attempts to identify trend, direction and momentum and when all these three align together it gives buy and sell signals. The concepts are as under:
Trend identification :
Whenever a trend is established, the developing CPR starts to widen. Hence this strategy uses the width of the developing CPR and compares it with the MA of the width to identify the trend. If the width of the developing CPR crosses the 34 period MA (can be customised), it assumes a trend is developing.
Direction identification:
Whenever a direction is established, the CPR components, namely BC and TC shifts its position. Hence this strategy uses this concept to identify the direction. It computes MACD sort of histogram of the BC and TC difference and whenever the histogram slops upwards, it assumes bullish direction and vice versa.
Momentum identification :
Whenever momentum is established, the developing CPR starts sloping upwards. Hence this strategy uses this concept to identify the momentum. It computes RSI of the developing CPR and if the RSI is above the 34 period MA (can be customised) of RSI , it assumes momentum is establishing and vice versa.
When all the above are aligned together, it gives buy or sell signals suitably.
How to use it :
a) Indicator usage :
1) CPR zones are key zones which predominantly acts as support and resistance zones. Looking at the price action at these zones, one can look for trading opportunities in live market.
2) Developing CPR acts as pull back zones and is very useful in live trading and also EOD analysis for spotting opportunities by combining price action.
b) Strategy usage :
1). Strategy signals are only indicative. Users are strongly advised not to use the strategy blindly. Users are advised to go though the CPR concepts thoroughly and use this strategy signals only as a supplement for further decision making / analysis.
Markets meant for :
1). This indicator and Strategy is predominantly designed for I ndian stock markets . However it can be customised for other markets as well by changing the timings of the markets in the parameters.
Market conditions meant for :
1). This indicator is meant for all types of market conditions as its predominant role is to plot the key support and resistance zones using CPR concepts.
2). The strategy is mainly found to be effective in trending markets and predominantly indices like Nifty and Bank Nifty . Hence Users are advised to use this only as an indicative feature and not blindly trade based on signals. The strategy is found to be less effective in lower time frames like 1min / 3min, etc. 15 min time frame provides fair performance. However it doesnt mean that it will continue to perform in the same manner in the future.

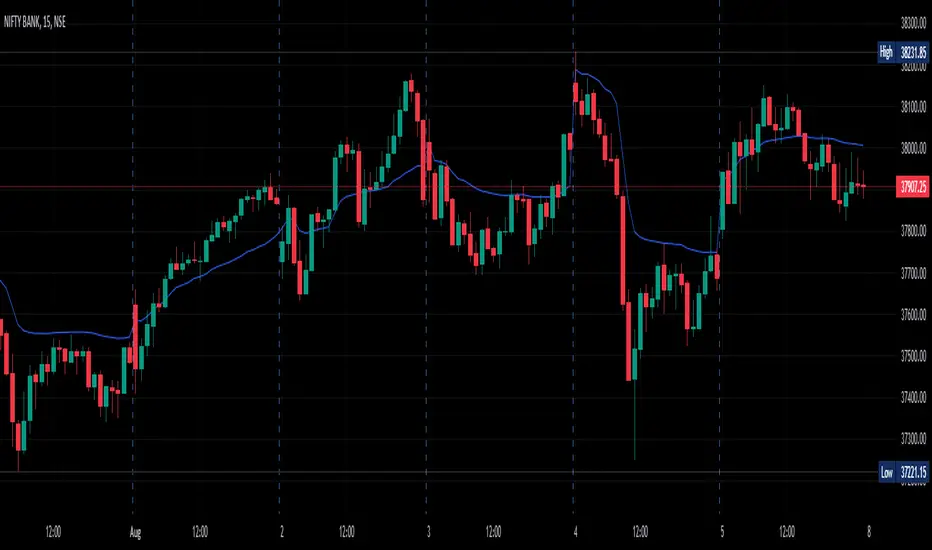
BankNifty VWAP VWAP - Volume-Weighted Average price ( VWAP )
The script draws Daily VWAP for BANKNIFTY SPOT , based on Futures Volume or underlying Index Stocks based on user input
BANKNIFTY INDICES IS THE WEIGHTAGE OF 12 STOCKS AS DECIDED BY EXCHANGE.
BANKNIFTY VWAP CALCULATES THE COMBINED VWAP OF THESE 12 STOCKS AND GENERATES VWAP FOR BANKNIFTY
It works with NIFTY as well. Please change the Symbol and Futures Volume symbol to "NSE:NIFTY" and "NSE:NIFTY1!"
NIFTY INDICES IS THE WEIGHTAGE OF 50 STOCKS AS DECIDED BY EXCHANGE.
NIFTY VWAP CALCULATES THE COMBINED VWAP OF THESE 50 STOCKS AND GENERATES VWAP FOR NIFTY
This script is intended for educational purposes only.
03/07/2022 WEIGHT AGE OF INDEX STOCKS (%)
HDFC Bank Ltd. - 27.63
ICICI Bank Ltd. - 22.98
Kotak Mahindra Bank Ltd. - 11.40
State Bank of India - 11.73
Axis Bank Ltd. - 11.6
IndusInd Bank Ltd. - 5.03
AU Small Finance Bank - Ltd. 2.54
Bandhan Bank Ltd. - 1.98
Bank of Baroda - 1.76
Federal Bank Ltd.- 1.76
PNB - 0.84
IDFC First Bank - 0.95

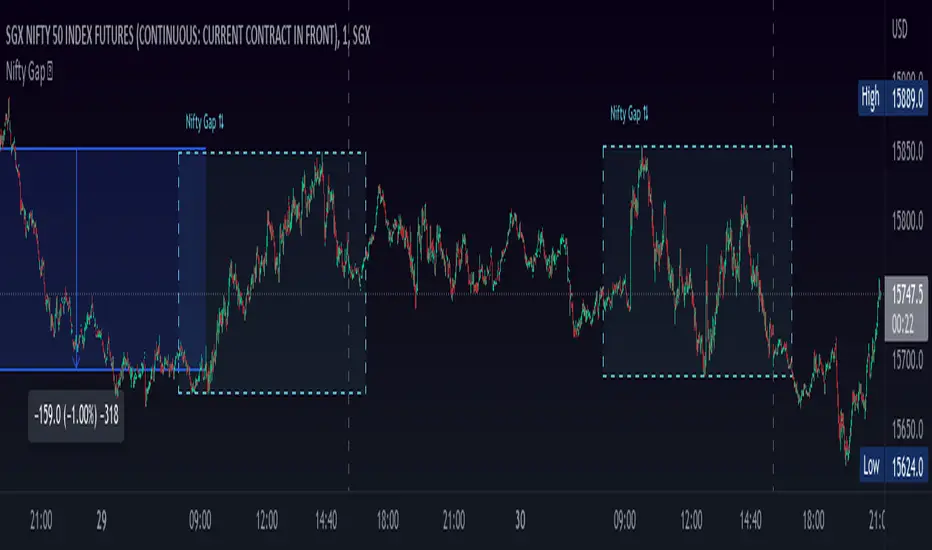
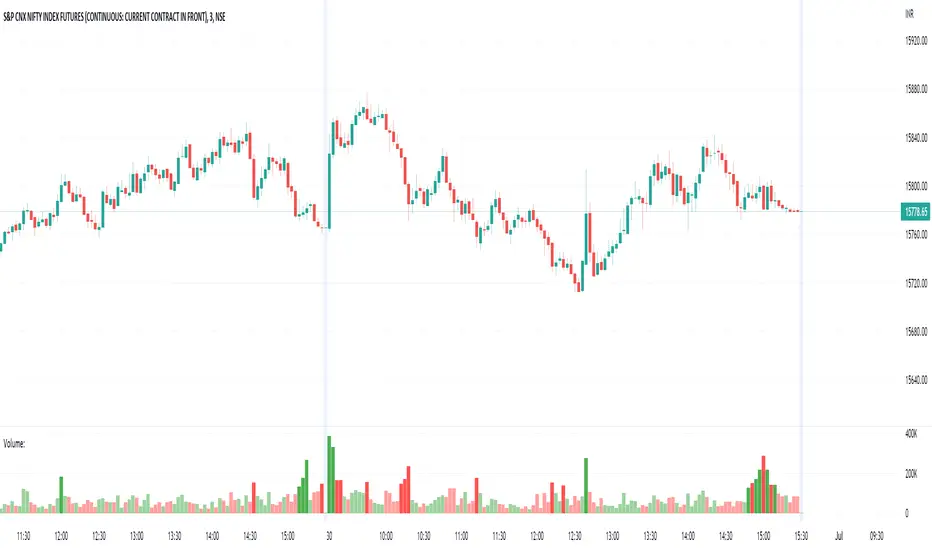
Nifty Gap ⇅This indicator help to find NIFTY gap up or gap down opening,
use this indicator on SGX NIFTY
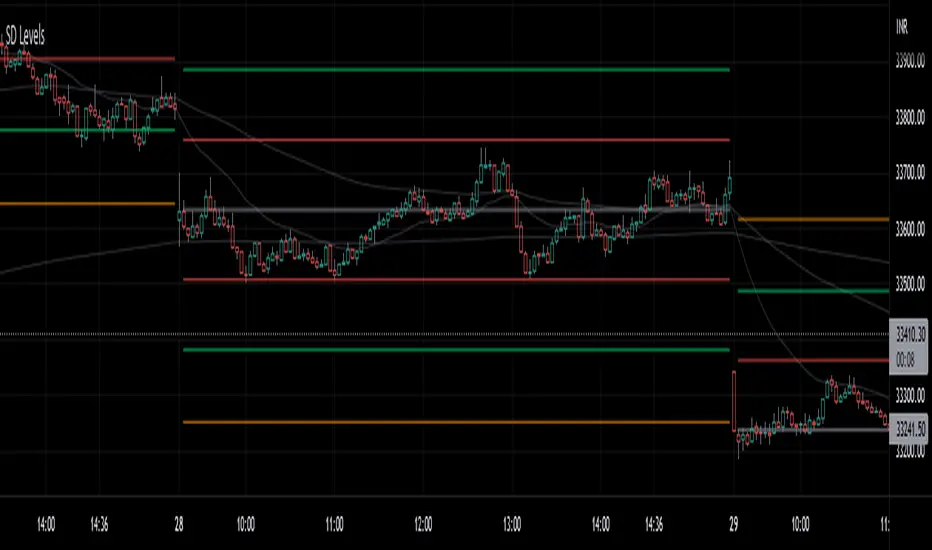
SD LevelsSD Levels is an indicator for the gap-up gap down markets
Works best on 5minute and lower time frames.
Involves standard deviation levels, Emas and Vwap.
Colorful lines are standard deviation levels which are +0.33,-0.33,+0.66,-0.66,+1.00 and -1.00 based.
Static Gray line is settlement line based on the first candle of the day and the tf you choose (default source OHLC4, also works good on close source)
Nifty VWAPVWAP - Volume-Weighted Average price (VWAP)
The script draws Daily VWAP for Nifty , based on Futures Volume or underlying Index Stocks based on user input
NIFTY INDICES IS WIEGHTAGE OF 50 STOCKS AS DECIDED BY EXCHANGE.
NIFTY VWAP CALCULATES COMBINED VWAP OF THESE 50 STOCKS AND GENERATES VWAP FOR NIFTY
It works with BANKNIFTY as well. Please change the Symbol and Futures Volume symbol to "NSE:BANKNIFTY" and "NSE:BANKNIFTY1!"
BANK NIFTY INDICES IS WIEGHTAGE OF 12 STOCKS AS DECIDED BY EXCHANGE.
BANK NIFTY VWAP CALCULATES COMBINED VWAP OF THESE 12 STOCKS AND GENERATES VWAP FOR BANK NIFTY
This script is intended for educational purposes only.
26/06/2022 WEIGHT AGE OF INDEX STOCKS (%)
RELIANCE INDS = 12.51
HDFCBANK = 8.38
INFY = 7.58
ICICIBANK = 7.21
HDFC = 5.75
TCS = 4.8
KOTAKBANK = 3.74
ITC = 3.26
HINDUNILVR = 2.89
LT = 2.75
AXISBANK = 2.49
SBIN = 2.47
BHARTIARTL = 2.28
BAJFINANCE = 2.23
ASIANPAINT = 1.78
HCLTECH = 1.52
MARUTI = 1.46
M_M = 1.36
SUNPHARMA = 1.28
TITAN = 1.27
TATASTEEL = 1.17
TATAMOTORS = 1.1
POWERGRID = 1.1
BAJAJFINSV = 1.08
NTPC = 1.02
TECHM = 1.01
ULTRACEMCO = 0.97
WIPRO = 0.97
NESTLEIND = 0.87
HINDALCO = 0.85
INDUSINDBK = 0.83
HDFCLIFE = 0.77
ONGC = 0.76
GRASIM = 0.74
DRREDDY = 0.73
JSWSTEEL = 0.73
ADANIPORTS = 0.73
SBILIFE = 0.71
CIPLA = 0.71
BAJAJ_AUTO = 0.69
TATACONSUM = 0.63
DIVISLAB = 0.63
UPL = 0.59
BRITANNIA = 0.59
APOLLOHOSP = 0.56
COALINDIA = 0.56
EICHERMOT = 0.53
HEROMOTOCO = 0.5
BPCL = 0.43
SHREECEM = 0.41

Sentient levelThe indicator presented here is made based on the study published on NSE:INDIAVIX . Basically it shows 2 sigma (by default) trading ranges of the next day (by default) of indices e.g. NSE:NIFTY & NSE:BANKNIFTY . Everyday three new lines get plotted automatically on the chart of the instrument (preferably NSE:NIFTY & NSE:BANKNIFTY ) you want to trade. Generally it's expected that the index to be traded within the ranges however in case of major gap-up or gap-down if the index opens above the higher range or below the lower range then it's assumed that the day to remain very volatile. This three lines can be considered as important support/resistance . Default parameters are set in consideration of day trading however user can modify them manually as per their trading style.
If you like my work you can donate through Tradingview coin. Thanks

Banknifty Major Component TableThe table presented here is comprised of major Banknifty Index constituents showing price change in percentage terms and RSI value of three different timeframes to gauge overall Banknifty sentiment. This table is primarily created to cater scalpers and day traders. It helps traders to see market activity at a glance.
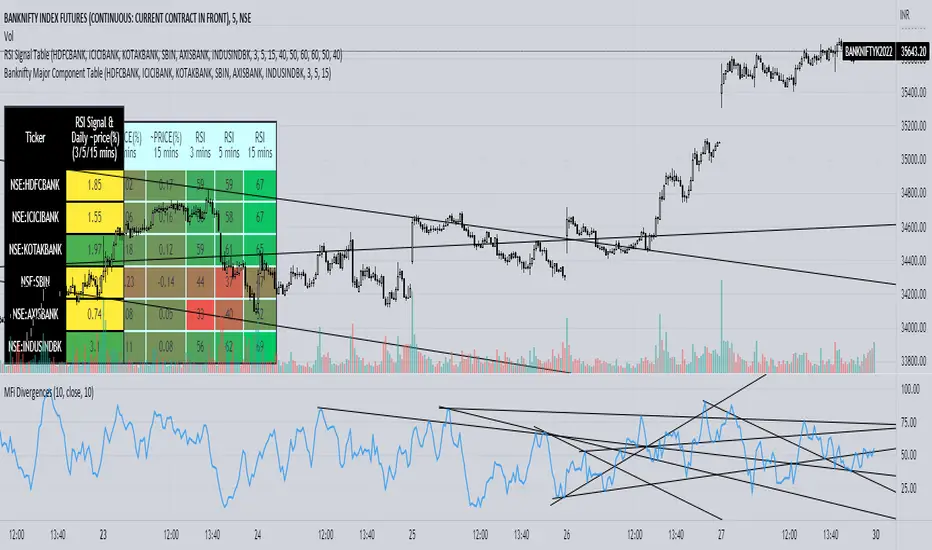
Contributing Constituents of BankniftyContributing Constituents of Banknifty
HOW Does it work ?
* Banknifty comprises of 12 Banks and each bank have its weightage, these weightage is updated every month by The Exchange.
* The Index Movements will be decided through these individual weightage.
* The Table is formed showing the contribution of each banks to the movement of index.
* Main concept here is that, during anytime of live market, which bank is dragging or leading the Banknifty can be detected, and trend can be followed.
# Table also contains the total points moved after opening of market.
Contributing Constituents of Banknifty comprises of following --
The 12 Banks are added with their latest weightage in index contribution.
User Inputs --
# User can update the weightage every month, through the link
www.niftyindices.com
How to learn the trend ?
# The most moving banks will show their actual contribution in index movement,
this will help following the trend of index.
# The data for the indicator will be very restricted, most of the parts in indicator wont work when the market closes.
# Pre-Opening or Post -Market data is tried to be ignored.
# Utmost Care is taken to implement the suggestions of users and also tried to keep the chart neat and clean.
Disclaimer:
# The indicator to be used for understanding / learning the markets.
# User is responsible for his / her profits / losses, that may occur during the markets.

IPB_NHNLThis indicator is a market breadth indicator.
This is an index that is derived from the number of stocks within the nifty constituents that has made 52weeks high and low.
Only top 40 stocks of nifty50 are selected as there is a limitation of calling securities in pinescript.
This indicator has to be used in conjunction with other market breadth indicators like IPB_MAMB, IPB_ADMIN, etc.
The index is customized for weekly chart. Hence please use only on weekly chart to analyze the market breadth .
Look for divergences with the price which indicate reversals.

High Volume Filter for Nifty and Bank Nifty - by PAHigh Volume Filter for Nifty and BankNifty Indices in NSE. The volume candles are shown normally if volume is greater than 50k for BankNifty Index futures and 125k for Nifty Index futures. The default is 50k for any symbol and can be modified to the desired value.
Heavy Weight Stocks for Bank NiftyHeavy Weight Stocks for Bank Nifty
Stocks which are part of Bank Nifty are displayed in the table.
If the %Change > 1 then bold green
If the %Change <1 and >0, then light green
If the %Change < -1 then bold red
If the %Change > -1 and <0 then light green
NSE:BANKNIFTY
NSE:HDFCBANK
NSE:ICICIBANK
NSE:AXISBANK
NSE:KOTAKBANK
NSE:SBIN
NSE:NIFTY
NSE:RELIANCE
NSE:HDFC

TradeWithAB Signal IndicatorThis indicator specifically designed for Momentum trading by an Intraday trader on index( Nifty , BankNifty ) and Equity stocks. This indicator works with DMI and PRICE ACTIONS which gives automated Buy and Sell signals along with Stop loss and Trailing Stop loss when certain criteria are met. It is not a Holy Grail system that gives you continuous profits and it has some limited downfalls also which can be controlled by proper risk Management and position sizing. This is a premium invite only indicator which can be use after given access to you by us. There are some guidelines on how to use this indicator which are given below and you have to follow these guidelines very strictly to get the maximum results.
Guidelines :-
1. Timeframe - 5 min
2. Period should be changed on daily basis(if required) for index trading.
3. Period value would be basically derived from IND VIX value (closest integer) divided by 2.
Ex 1. If the VIX value is 23.56, then it will be consider as 24. So the period value will be 24/2= 12.
Ex 2. If the VIX value is 23.10, then it will be considered as 24. So the period value will be 24/2= 12.
Ex 3. If the VIX value is 22.88, then it will be considered as 22. So the period value will be 22/2= 11.
4. Period value should be fixed at 20 for equity stocks.
5. DO NOT take any SWING or POSITIONAL trade with this indicator.
6. You have to take almost all the trade generated by this indicator on a particular stock/index for better results.
7. Signal confirmation is required for enter the trade as it will give you maximum profits.
8. GREEN TRIANGLE is represented as BUY Signal whereas RED TRIANGLE is represented as SELL Signal.
9. GREEN ARROW is considered as BUY TRAILING STOP LOSS as well as BUY RE-ENTRY for some scenarios.
10. RED ARROW is considered as SELL TRAILING STOP LOSS and SELL RE-ENTRY for some scenarios.
11. You have to avoid entering a trade on a round level zone. Eg- Banknifty 37000,35500,40000 etc etc.
BUY Trade Management :-
1. Trade should be initiated if and only if there is a buy signal(Green Triangle) is generated with confirmation of its respective indices (Recent candle of respective index should be similar to the signal candle).
*in case of BankNifty , Nifty will be its respective index and vice-versa.
2. You should only enter the trade at the CLOSE of the signal generated candle.
3. Your Stop loss should be placed at the LOW of the signal generated candle.
4. There is a trailing Stop loss signal (Green Arrow) after the buying signal is generated.
5. You should trail your Stop loss at the LOW of the trailing Stop loss signal generated candle.
6. You should trail your Stop loss repeatedly until your trailing Stop loss got hit and hence Exit your buy trade.
7. After Exiting the trade you have always option to re-enter at the next trailing Stop loss signal(green arrow) generated candle CLOSE and put your Stop loss at LOW of that candle and repeat the same trailing stop loss procedures.
SELL Trade Management :-
1. Trade should be initiated if and only if there is a sell signal(Red Triangle) is generated with confirmation of its respective indices (Recent candle of respective index should be similar to the signal candle).
*in case of BankNifty , Nifty will be its respective index and vice-versa.
2. You should only enter the trade at the CLOSE of the signal generated candle.
3. Your Stop loss should be placed at the HIGH of the signal generated candle.
4. There is a trailing Stop loss signal (Red Arrow) after the selling signal is generated.
5. You should trail your Stop loss at the HIGH of the trailing Stop loss signal generated candle.
6. You should trail your Stop loss repeatedly until your trailing Stop loss got hit and hence Exit your sell trade.
7. After Exiting the trade you have always option to re-enter at the next trailing Stop loss signal(red arrow) generated candle CLOSE and put your Stop loss at HIGH of that candle and repeat the same trailing stop loss procedures.
Disclaimer :-
*I am not a SEBI Registered Analyst and shall not be liable for any profit, loss or liability resulting, directly or indirectly from the use and results of the indicator. This is not a Holy Grail setup, sometimes the traders hit Stop loss and sometimes it gives amazing results as well.
Instructions to access to this invite-only script:-
*Send us a message if you wish to gain access to this indicator. The subscribers will get benefits of any future development or updates in the current script without any extra charges. Other trading style like swing and positional trading will also available in future updates.

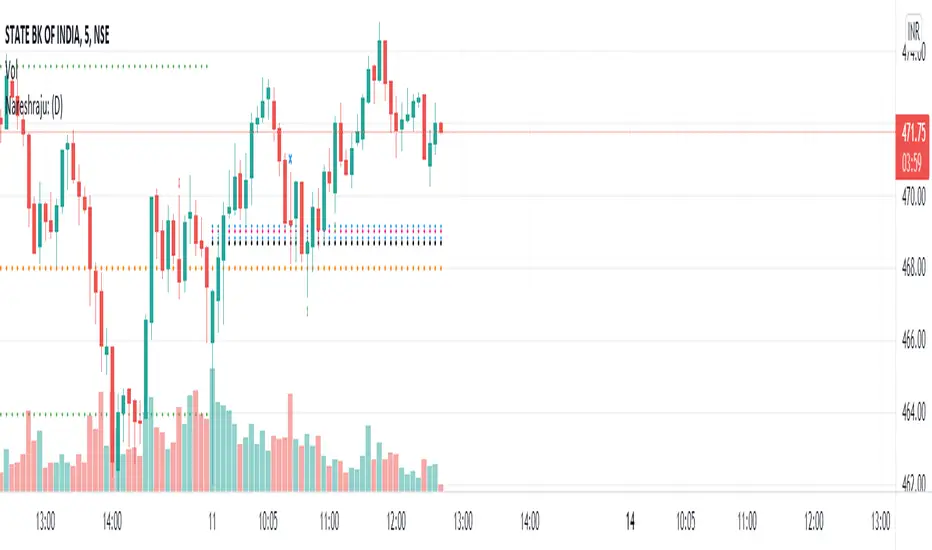
Nareshraju CPRHi friends this is Cpr indicator which means central pivot range. it contains supports and resistances to take perfect entry.
Nifty / Banknifty Dashboard by RiTzNifty / Banknifty Dashboard :
Shows Values of different Indicators on current Timeframe for the selected Index & it's main constituents according to weightage in index.
customized for Nifty & Banknifty (You can customize it according to your needs for the markets/indexes you trade in)
Interpretation :-
VWAP : if LTP is trading above VWAP then Bullish else if LTP is trading below VWAP then Bearish.
ST(21,1) : if LTP is trading above Supertrend (21,1) then Bullish , else if LTP is trading below Supertrend (21,1) then Bearish.
ST(14,2) : if LTP is trading above Supertrend (14,2) then Bullish , else if LTP is trading below Supertrend (14,2) then Bearish.
ST(10,3) : if LTP is trading above Supertrend (10,3) then Bullish , else if LTP is trading below Supertrend (10,3) then Bearish.
RSI(14) : Shows value of RSI (14) for the current timeframe.
ADX : if ADX is > 75 and DI+ > DI- then "Bullish ++".
if ADX is < 75 but >50 and DI+ > DI- then "Bullish +".
if ADX is < 50 but > 25 and DI+ > DI- then "Bullish".
if ADX is above 75 and DI- > DI+ then "Bearish ++".
if ADX is < 75 but > 50 and DI- > DI+ then "Bearish+".
if ADX is < 50 but > 25 and DI- > DI+ then "Bearish".
if ADX is < 25 then "Neutral".
MACD : if MACD line is above Signal Line then "Bullish", else if MACD line is below Signal Line then "Bearish".
PDH-PDL : "< PDH > PDL" means LTP is trading between Previous Days High(PDH) & Previous Days Low(PDL) which indicates Rangebound-ness.
"> PDH" means LTP is trading above Previous Days High(PDH) which indicates Bullish-ness.
"< PDL" means LTP is trading below Previous Days Low(PDL) which indicates Bearish-ness.
Alligator : If Lips > Teeth > Jaw then Bullish.
If Lips < Teeth < Jaw then Bearish.
If Lips > Teeth and Teeth < Jaw then Neutral/Sleeping.
If Lips < Teeth and Teeth > Jaw then Neutral/Sleeping.
Settings :
Style settings :-
Dashboard Location: Location of the dashboard on the chart
Dashboard Size: Size of the dashboard on the chart
Bullish Cell Color: Select the color of cell whose value is showing Bullish-ness.
Bearish Cell Color: Select the color of cell whose value is showing Bearish-ness.
Neutral Cell Color: Select the color of cell whose value is showing Rangebound-ness.
Cell Transparency: Select Transparency of cell.
Columns Settings :-
You can select which Indicators values should be displayed/hidden.
Rows Settings :-
You can select which Stocks/Symbols values should be displayed/hidden.
Symbol Settings :-
Here you can select the Index & Stocks/Symbols
Dashboard for Index : select Nifty/Banknifty
if you select Nifty then Nifty spot, Nifty current Futures and the stocks with most weightage in Nifty index will be displayed on the Dashboard/Table.
if you select Banknifty then Banknifty spot, Banknifty current Futures and the stocks with most weightage in Banknifty index will be displayed on the Dashboard/Table.
You can Customise it according to your needs, you can choose any Symbols you want to use.
Note :- This is inspired from "RankDelta" by AsitPati and "Nifty and Bank Nifty Dashboard v2" by cvsk123 (Both these scripts are closed source!)
I'm not a pro Developer/Coder , so if there are any mistakes or any suggestions for improvements in the code then do let me know!

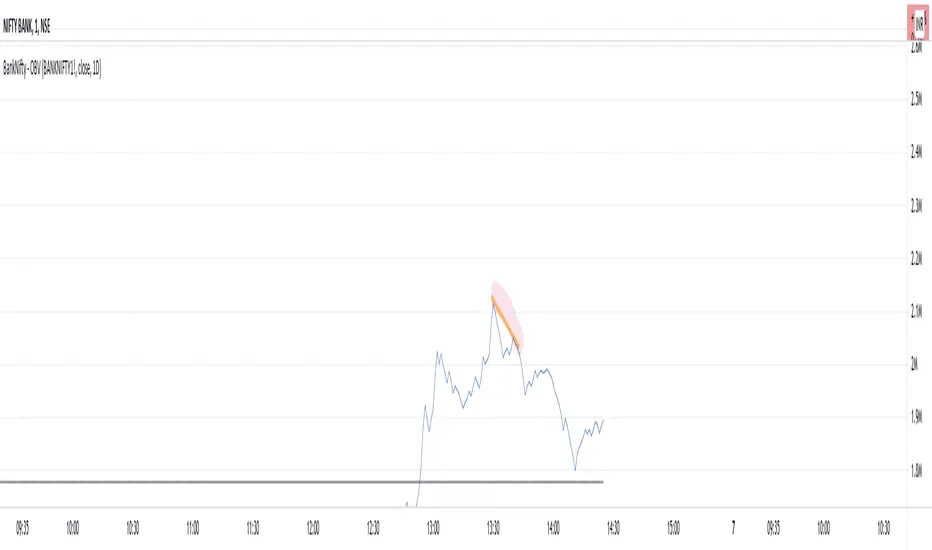
BankNifty - OBVThis script tries to draw OBV for BankNifty using Futures Volume along with Average OBV. For Nifty50 just change the Futures Volume symbol in settings. Look at devations in Price vs OBV or Average OBV breakout.
NSE:NIFTY
NSE:BANKNIFTY
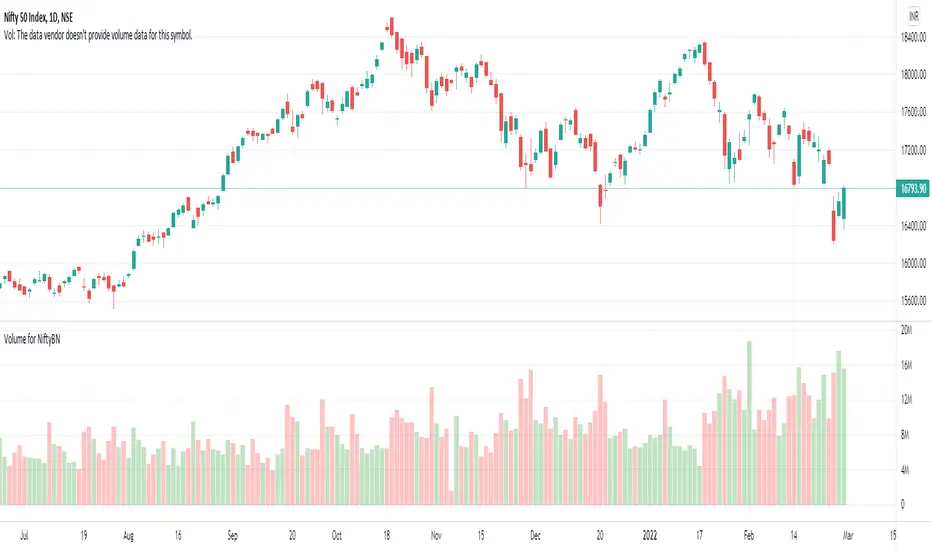
Volume for NiftyBNTo see the volume of Nifty and Banknifty indices we often refer to their Futures chart. With the help of this script, you can directly plot the volume of Nifty Futures over the Nifty chart and Bank Nifty Futures over the Bank Nifty chart.
If the scrip entered is other than Nifty or Bank Nifty it will plot the default volume of that scrip.
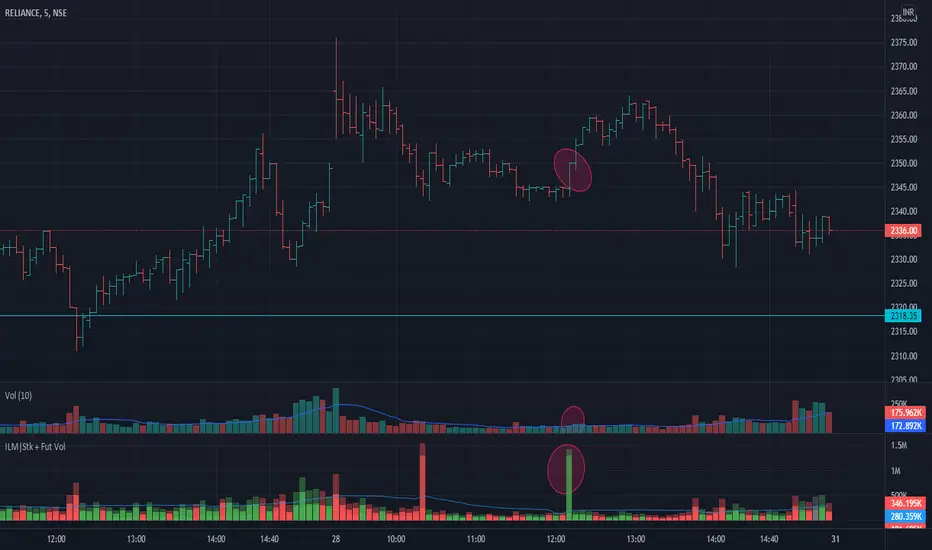
Volume Indicator NSE + BSE + Future Current & Next MonthThis indicator combines all the volumes from both the NSE & BSE exchanges as well as Future volumes ( Current Month & Next Month) if the symbol is available in FnO
Indicator shows 3 volumes
Total Volume = NSE + BSE + Current Month + Next Month
Stock Volume = NSE + BSE
Future volume = Current Month + Next Month
Benefits
As shown in the chart above, price shot up as the volume appeared in BSE but not NSE. These conditions can be caught easily and right decisions can be made
Since Future volumes are also combined, it gives an accurate picture of volumes on any given instrument during last of week of monthly expiries when contract rollovers happen
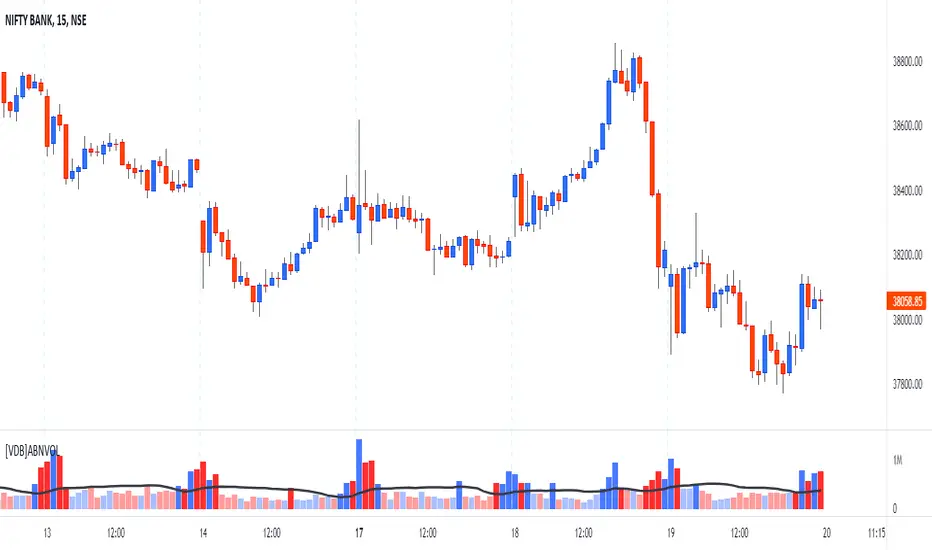
[VDB]Advanced BankNifty VolumeNSE:BANKNIFTY Index is traded significantly along with NIFTY and having a VOLUME indicator is very helpful for those who follow it extensively as it is used to measure the relative significance of a price move. Given TradingView doesn’t provide the VOLUME on Index chart, many end up using BANKNIFTY FUTURE chart for volume information. This indicator helps providing that VOLUME information.
Get VOLUME You Prefer –
FUTURE : This extracts VOLUME data from BANKNIFTY FUTURE chart.
INDEX : VOLUME is calculated by the weighted sum (Composite method) of underlying stock’s spot volume for all the 12 stocks of the Bank Nifty Index.
INPUTS :
Volume Moving Average in added to show the LINE and also used in calculation to change volume bars color if that input is selected.
Color Bars Based on Average VOLUME : Selecting this helps changing the Color of VOLUME bars to lighter color if volume < average volume.
Color Bars Based on Previous Close : Selecting this input changes the Color of VOLUME bars based on “Previous Close” than “Current Open”.
BANKS & WEIGHTAGE : Here all 12 underlying banking stocks of Bank Nifty Index are listed along with their weightage in the index.
IMPORTANT NOTE : Changing any settings of the indicator leads to its complete recalculation. The result may differ from the expected one. Weightage of each stock changes by end of every month. Always to refer NSE NIFTY BANK composition and weightage from NSE website.
DISCLAIMER : This indicator has been created for educational reference only and do not constitute investment advice. This indicator should not be relied upon as a substitute for extensive independent market research before making your actual trading decisions. Market data or any other content is subject to change at any time without notice. Liability for any loss or damage, including without limitation any loss of profit, which may arise directly or indirectly from use of this indicator is accountability of user.
BANKNIFTY Expiry Price v1.0This indicator will predict the BankNifty Expiry price for the last 30 min.
Use this indicator on a 1 min chart on BankNifty index as shown above. The orange line is the predicted price.
BankNifty closing price is calculated based on the Weighted Average Price of its constituents in the last 30 min and will vary from the actual index price.
Last 30 min on expiry day is very volatile in Banknifty and option premiums are mis-priced due to the underlying moves.
This indicator helps in estimating the actual Banknifty weighted avg closing price.
The weights of the constituents need to be updated constantly on a weekly basis to keep the error rate to minimum.
The prediction is normally off by +/- 10 points to the actual closing price.
